How to analyze the demand and consumer behavior?


How to analyze the demand and consumer behavior? 2 1
…it is difficult to link the subjective preferences of consumers to changes in prices, income and other market variables that are objective… 2

The ordinal approach to the consumer balance 3

The combinations of goods should be arranged in the order of preference 4
assumption: consumers can define packages of goods and services in the order of preferences 5
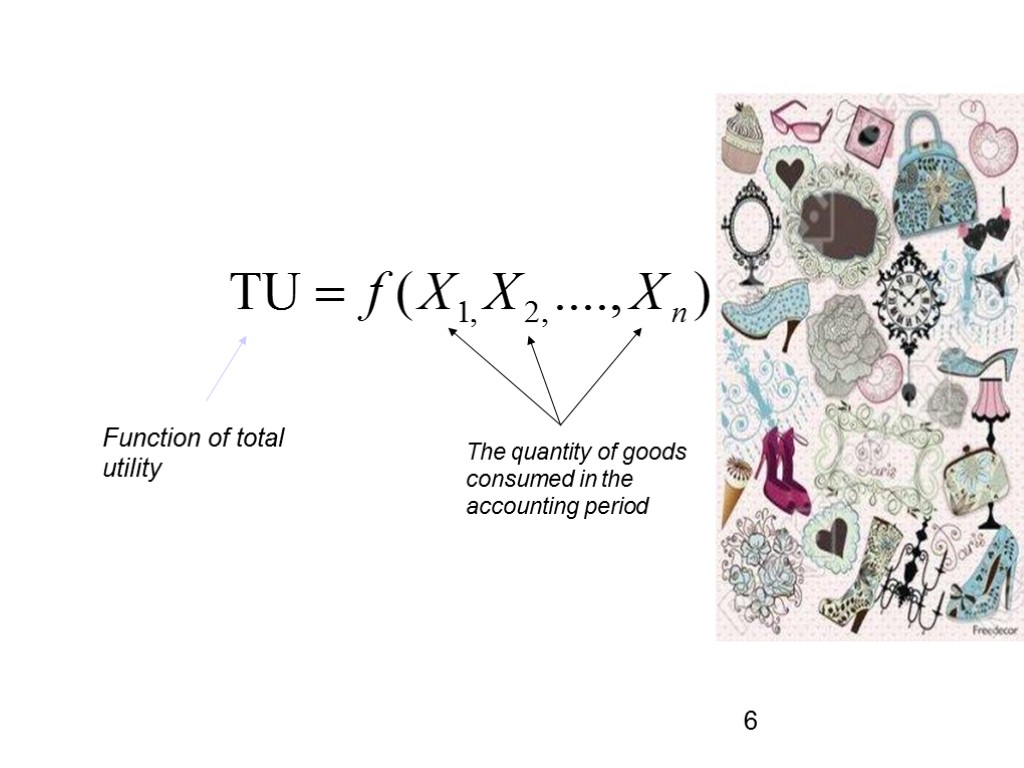
Function of total utility The quantity of goods consumed in the accounting period 6
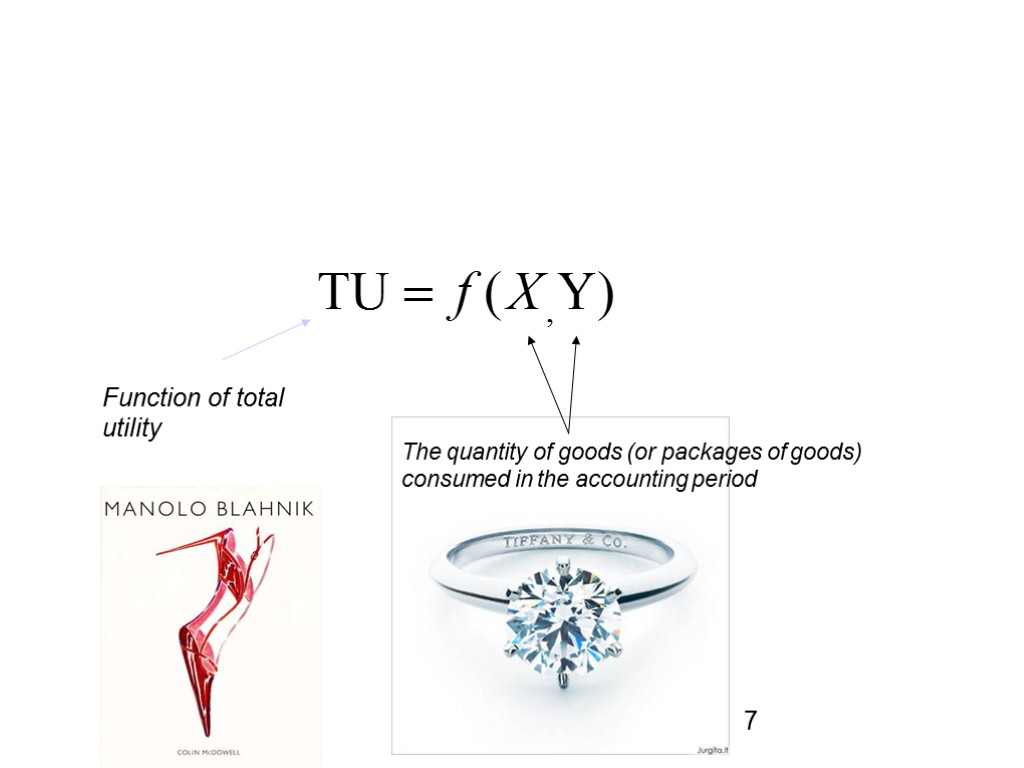
The quantity of goods (or packages of goods) consumed in the accounting period Function of total utility 7
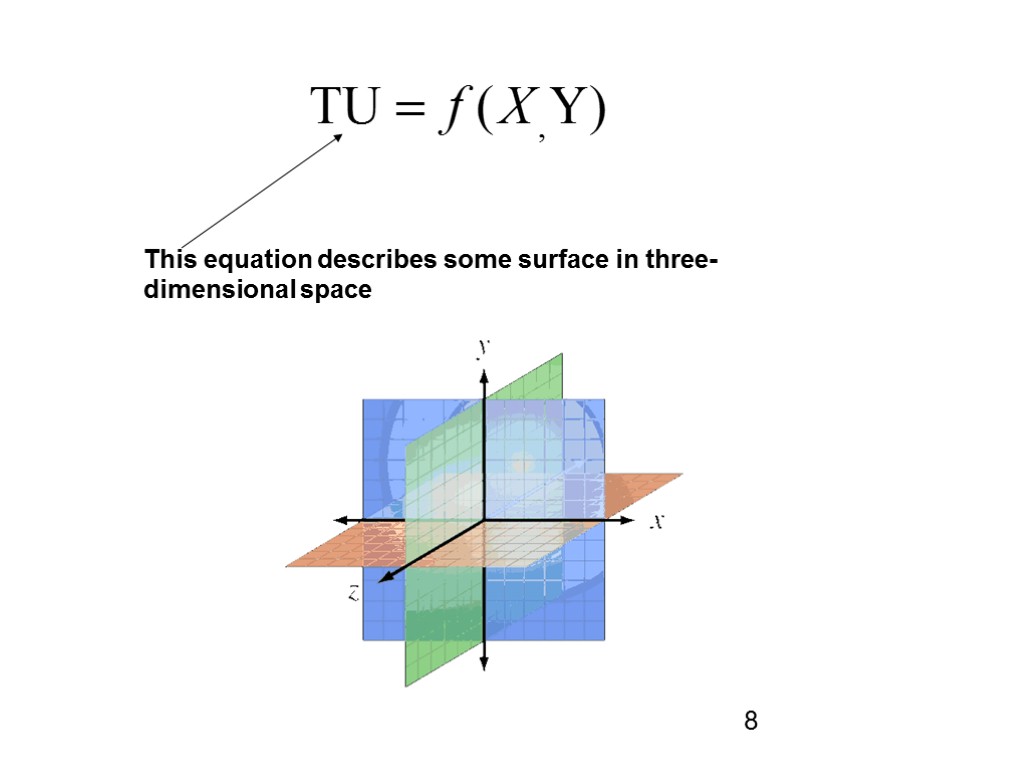
This equation describes some surface in three-dimensional space 8
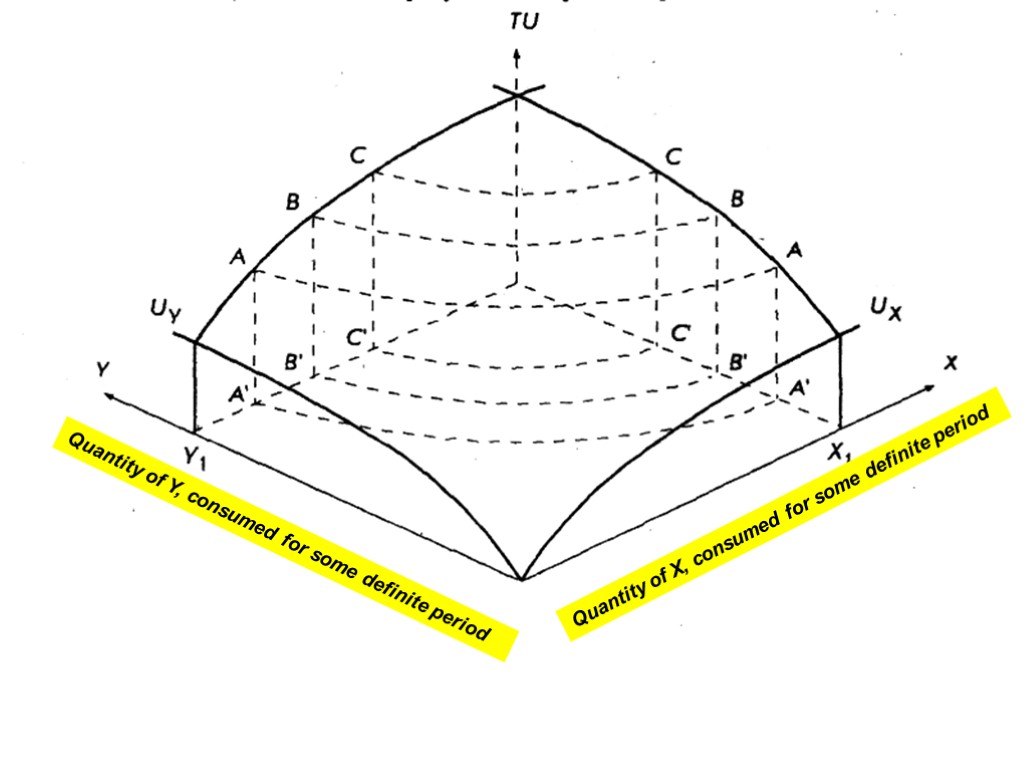
9 Quantity of Y, consumed for some definite period Quantity of X, consumed for some definite period
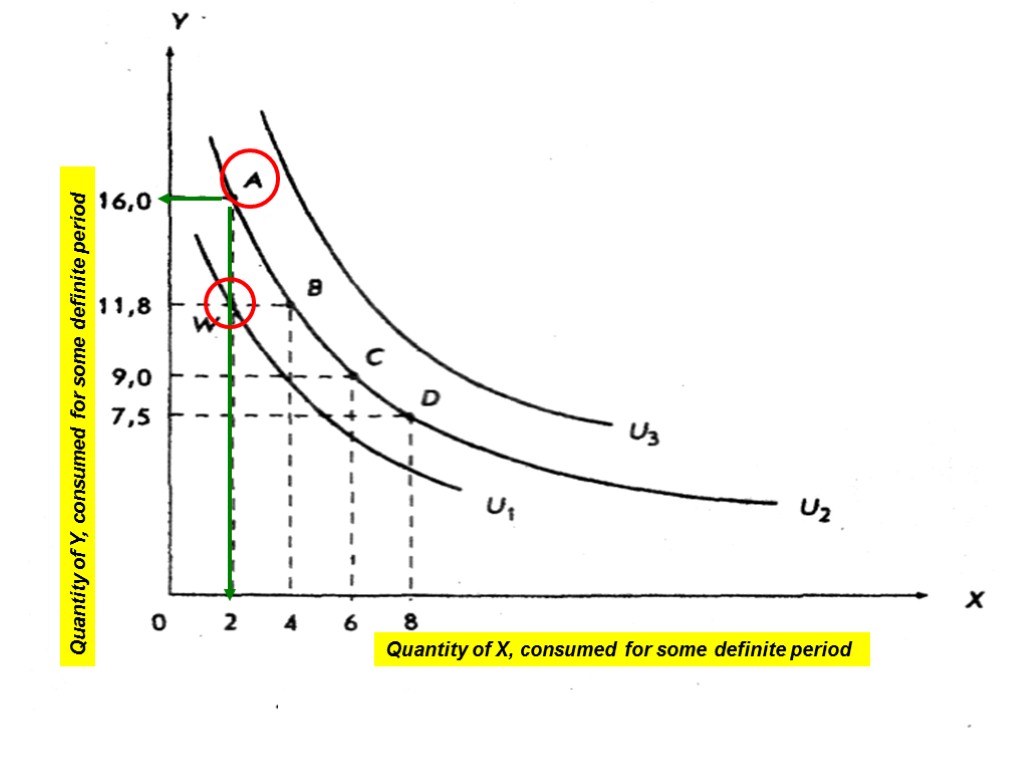
Indifference curve is the sum of all combinations of goods X and Y, which provide the same level of total utility or satisfaction Indifference map is a chart that reflects indifference curves 10
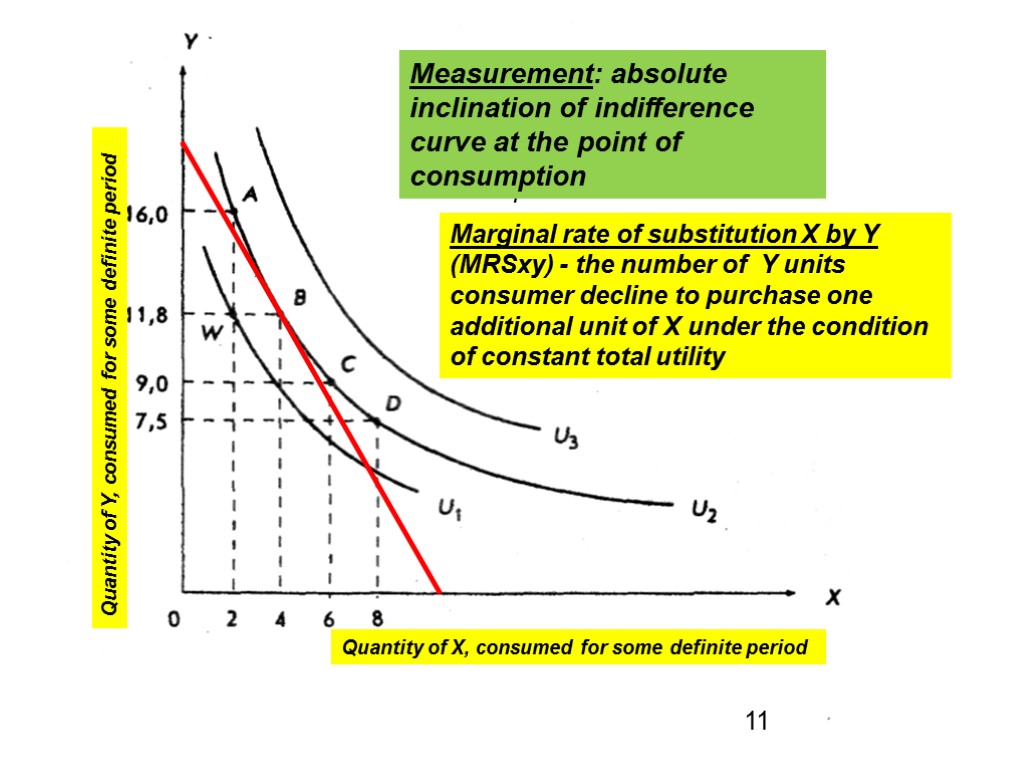
Curves U1, U2, U3 - three multitudes of the many possible levels of utility from consumption of different combinations of X and Y for the same period 11 Quantity of Y, consumed for some definite period Quantity of X, consumed for some definite period The rate at which the consumer is willing to make such substitution is called the marginal rate of substitution Marginal rate of substitution X by Y (MRSху) - the number of Y units consumer decline to purchase one additional unit of X under the condition of constant total utility Measurement: absolute inclination of indifference curve at the point of consumption
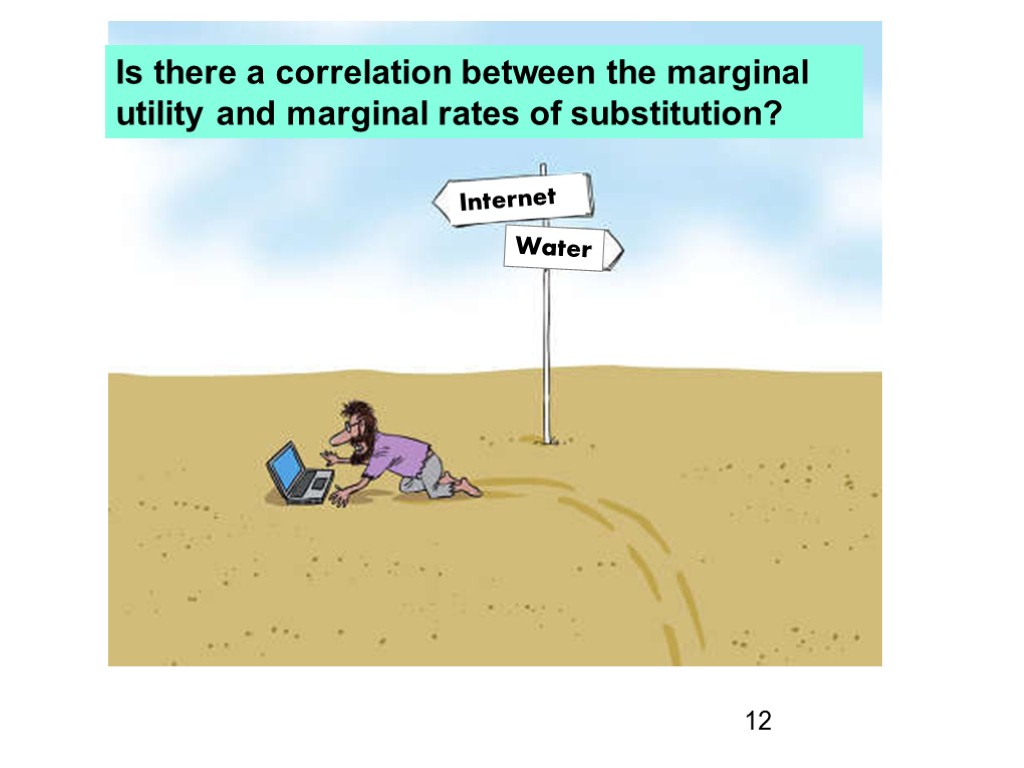
Is there a correlation between the marginal utility and marginal rates of substitution? 12 Internet Water
![] consumption of Y is reduced by ∆Y that leads to the loss of ] consumption of Y is reduced by ∆Y that leads to the loss of](https://present5.com/customparser/222386723_450922467 --- 11_ordinal_approach_to_consumers_behavior.ppt/slide_13.jpg)
] consumption of Y is reduced by ∆Y that leads to the loss of utility - ∆Y MUy units of utility 13 Quantity of Y, consumed for some definite period Quantity of X, consumed for some definite period
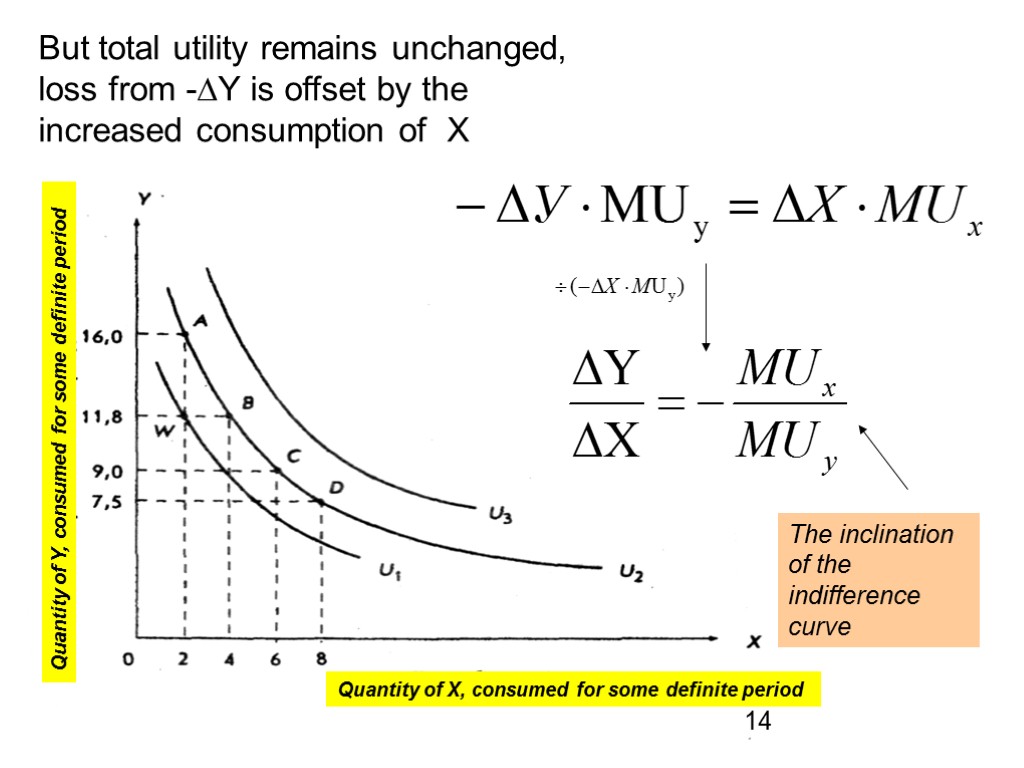
But total utility remains unchanged, loss from -∆Y is offset by the increased consumption of X The inclination of the indifference curve 14 Quantity of Y, consumed for some definite period Quantity of X, consumed for some definite period
15 Quantity of Y, consumed for some definite period Quantity of X, consumed for some definite period
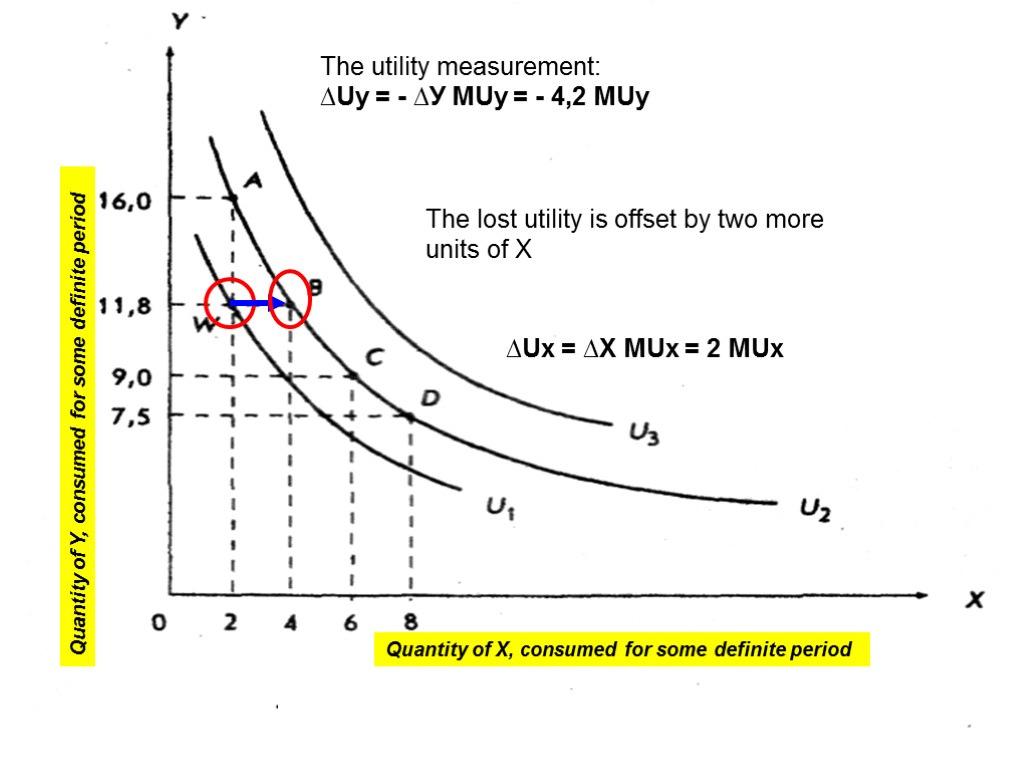
The utility measurement: ∆Uу = - ∆У MUy = - 4,2 MUy The lost utility is offset by two more units of X ∆Uх = ∆Х MUх = 2 MUх 16 Quantity of Y, consumed for some definite period Quantity of X, consumed for some definite period
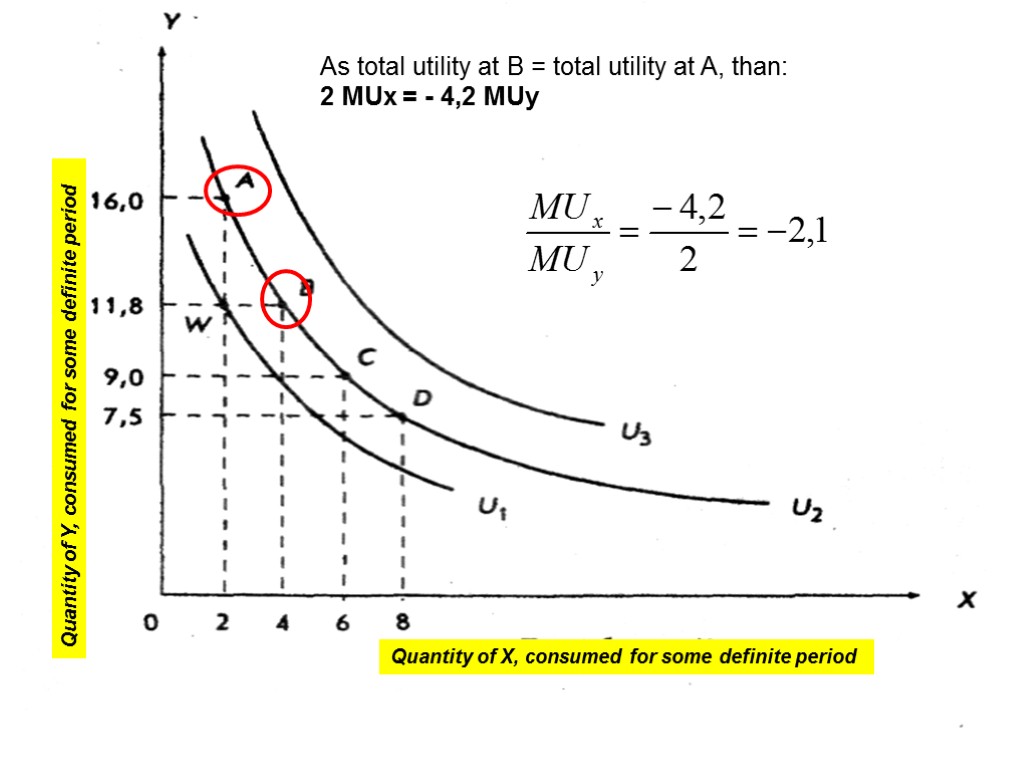
As total utility at B = total utility at A, than: 2 MUх = - 4,2 MUy 17 Quantity of Y, consumed for some definite period Quantity of X, consumed for some definite period
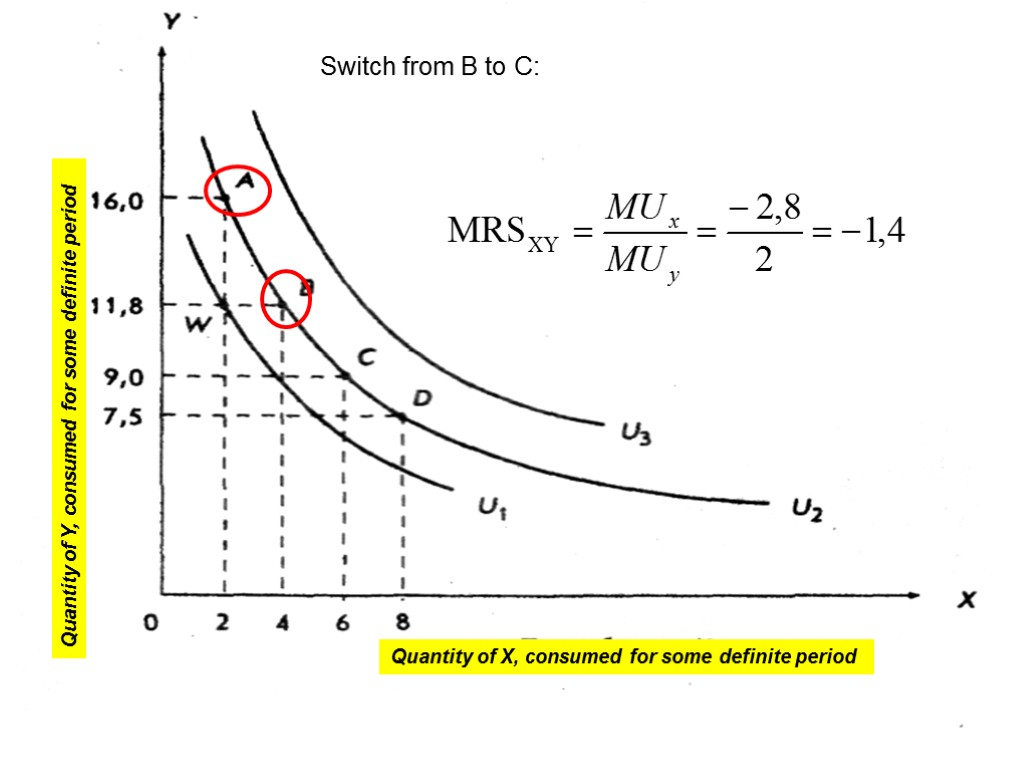
Switch from В to С: 18 Quantity of Y, consumed for some definite period Quantity of X, consumed for some definite period
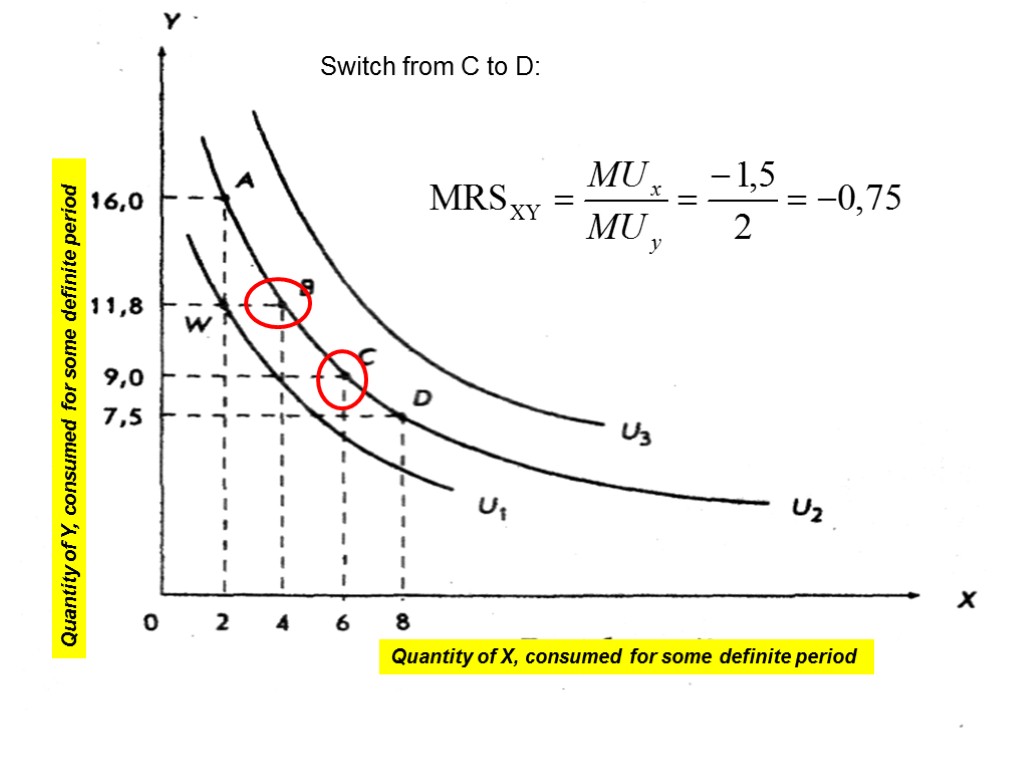
Switch from С to D: 19 Quantity of Y, consumed for some definite period Quantity of X, consumed for some definite period
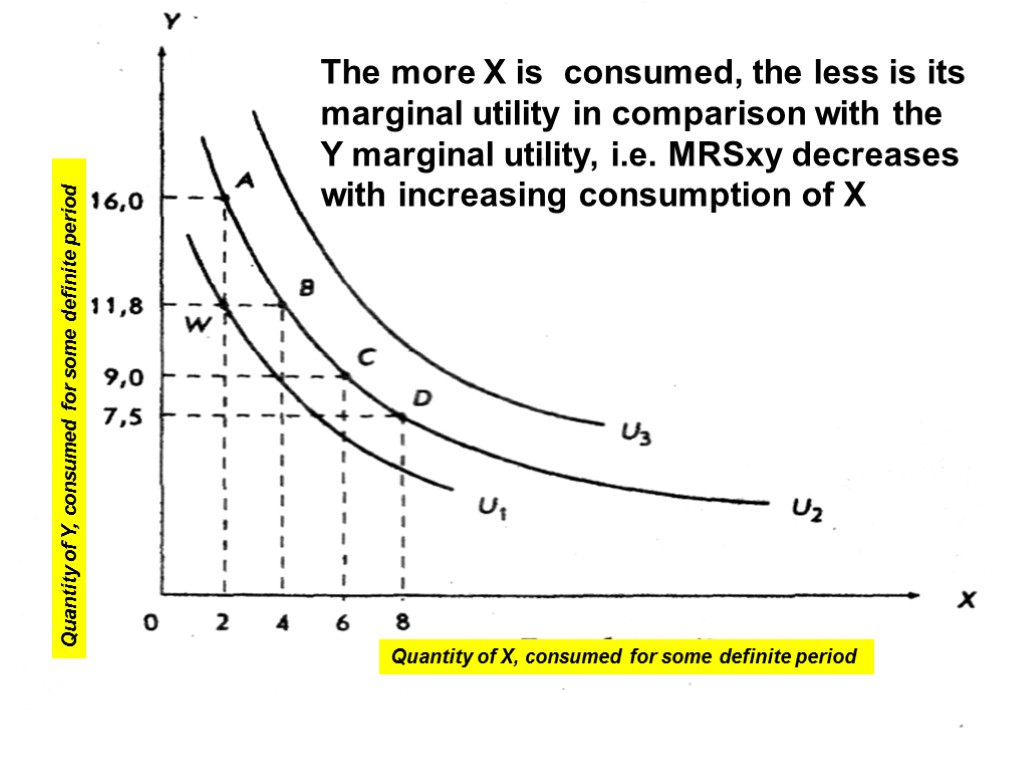
The more X is consumed, the less is its marginal utility in comparison with the Y marginal utility, i.e. MRSxy decreases with increasing consumption of X 20 Quantity of Y, consumed for some definite period Quantity of X, consumed for some definite period
Constantly decreasing MRS is a logical result of the assumption that the marginal utility of the product decreases as we acquire more of it Ех: 21
11_ordinal_approach_to_consumers_behavior.ppt
- Количество слайдов: 21

