e00d8d28f98396cb14eee88aa6a6846f.ppt
- Количество слайдов: 42
Hobbit – Monitoring that works Hobbit Monitor Linuxforum 2007 rd 2007 March 3 Henrik Storner <henrik@hobbitmon. com>
Agenda Hobbit history What does “monitoring” mean? Demo / Screen shots Architecture: The Hobbit components Hobbit server Network server monitoring Server monitoring with the clients Setting it up: Quick tour of the configuration Custom checks Hobbit at the CSC Copenhagen data center Future
Hobbit history In 2001, CSC's Managed Web Services division had no monitoring of websites, only boxmonitoring with Unicenter/TNG. Enter Big Brother – the UI is great, but BB is written in Korn shell and is slooooow! bbgen toolkit (2002) eliminated some slow parts of BB, but kept the BB daemon. Hobbit (2005) is mostly compatible with BB but has a completely different architecture. Hobbit contains no BB parts.
What does “monitoring” mean? Availability: Can I access the website? Performance: . . . without getting bored ? Capacity: . . . when we triple the number of users? It is vital that you know which of these questions you must answer. The main focus for Hobbit is availability (but there's a bit of the others thrown in)
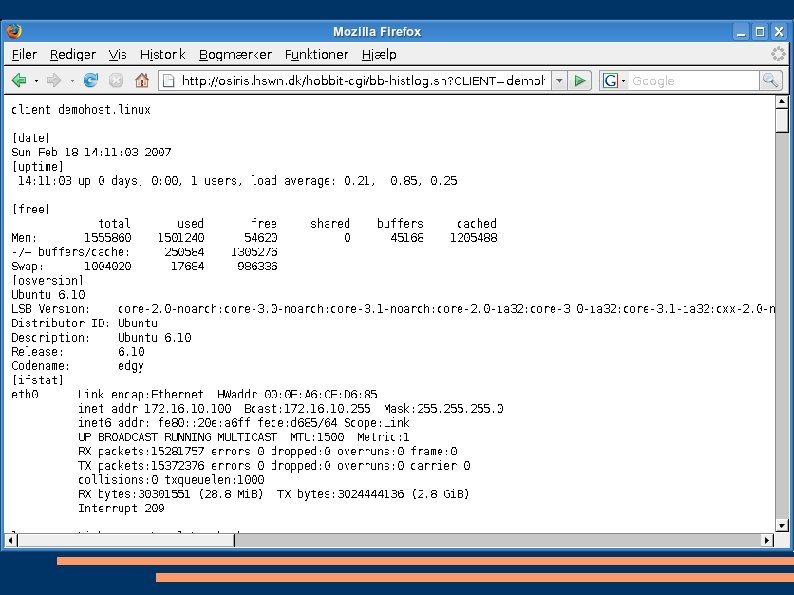
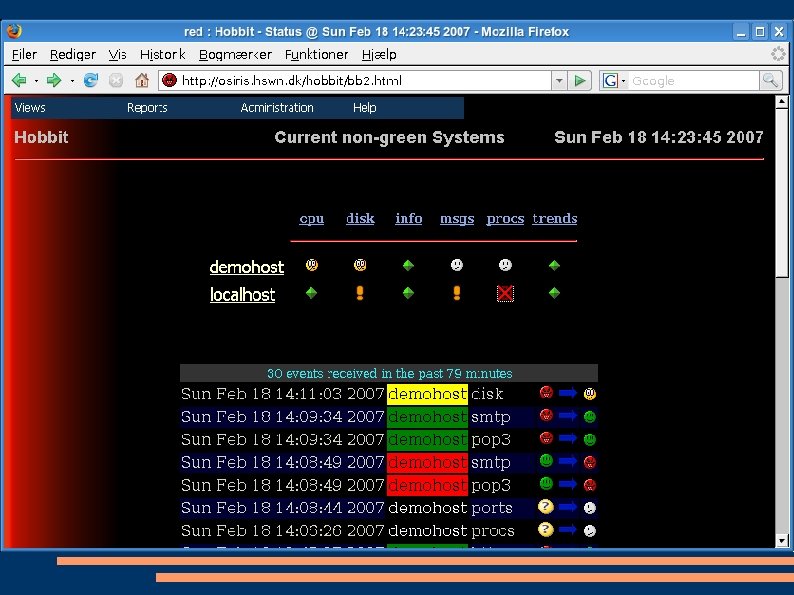
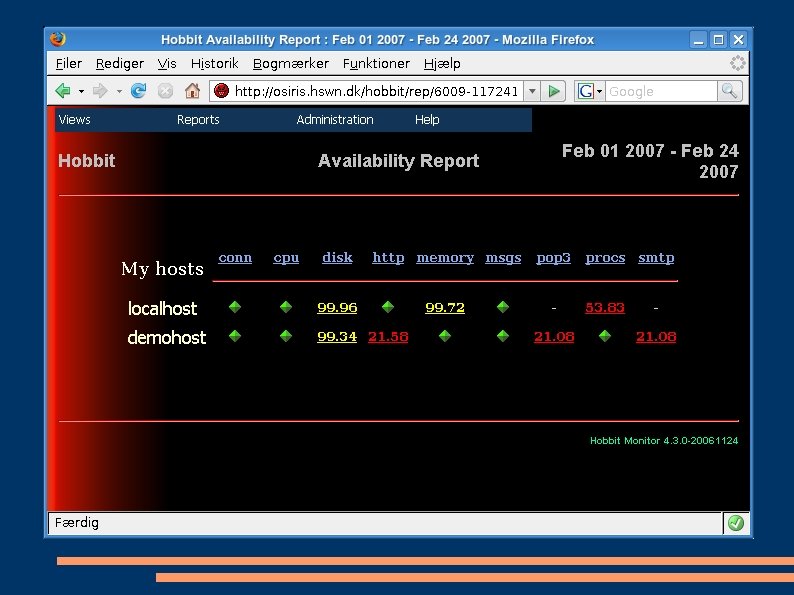
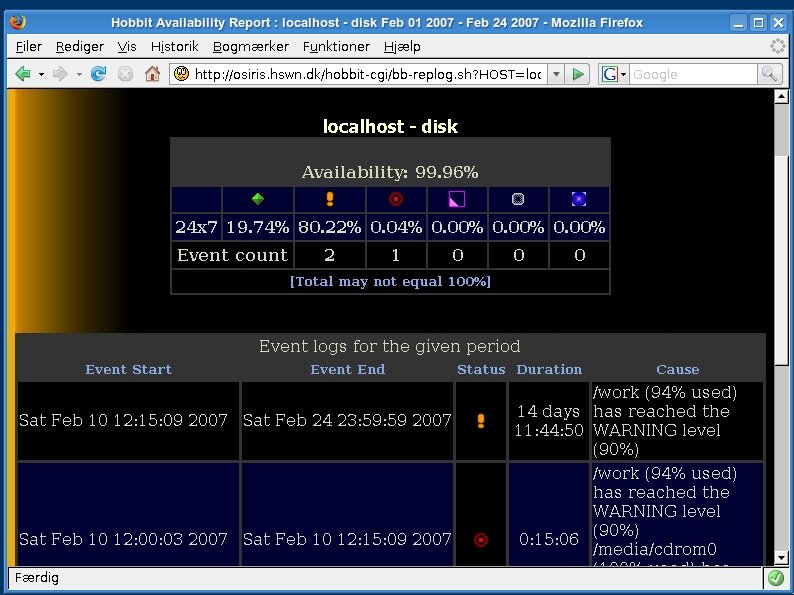
Hobbit overview A small demo
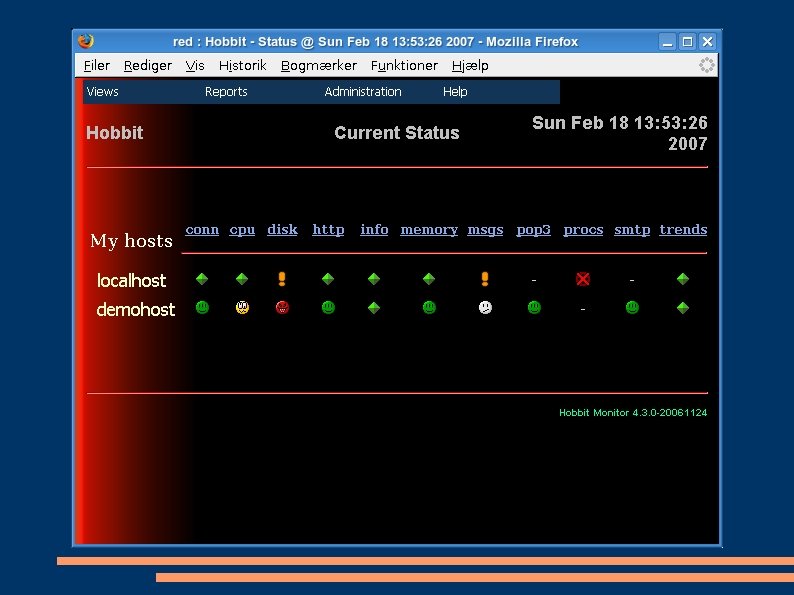
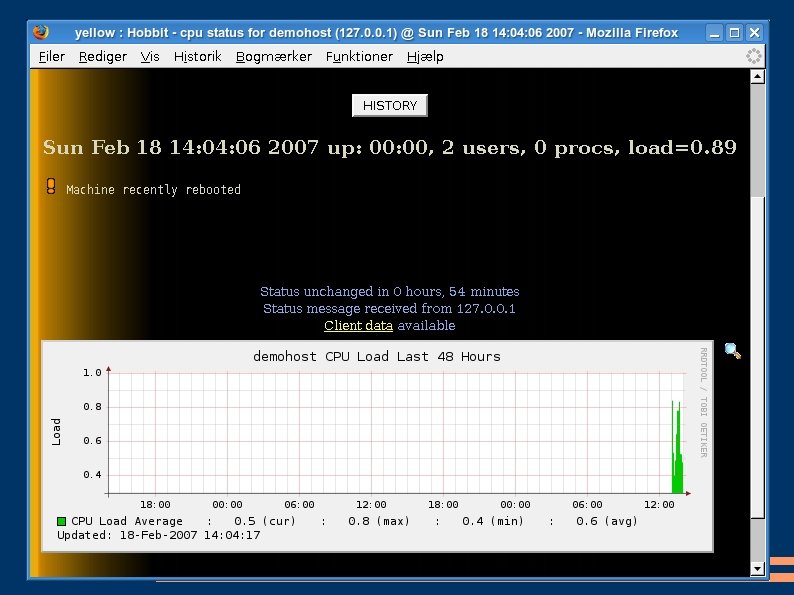
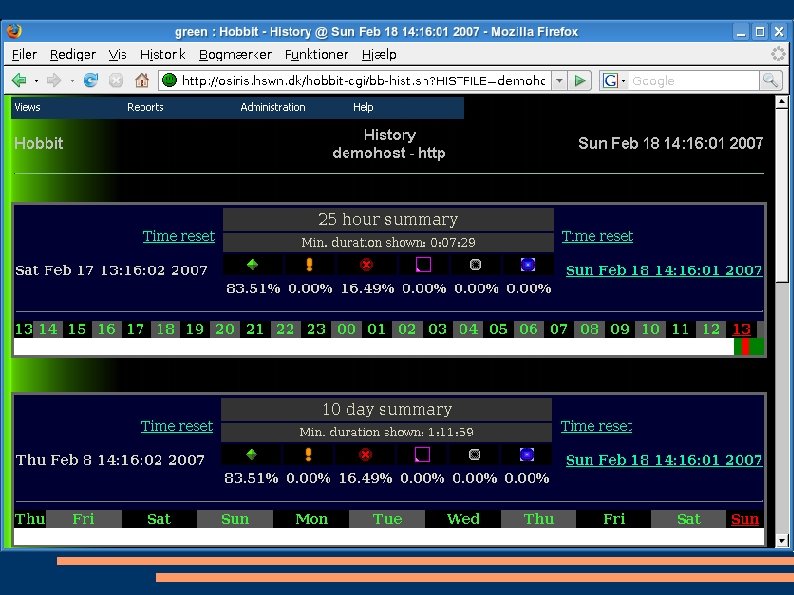
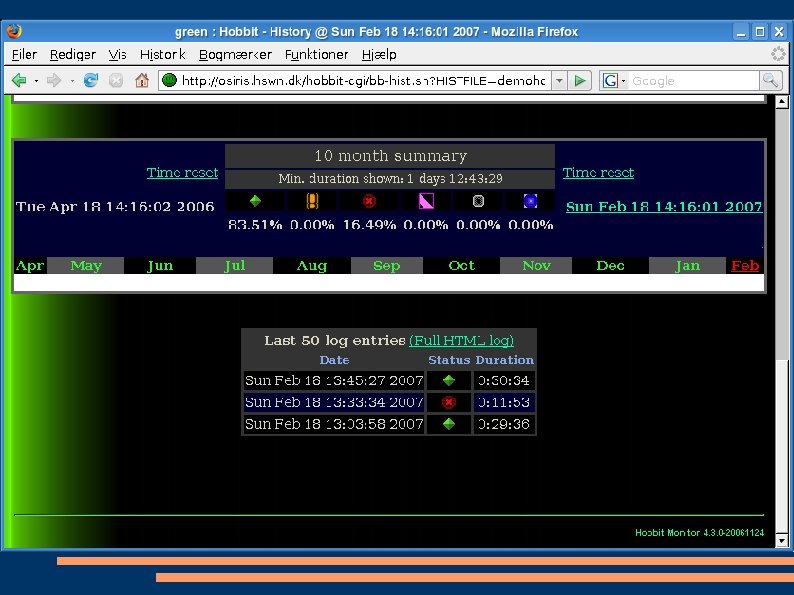
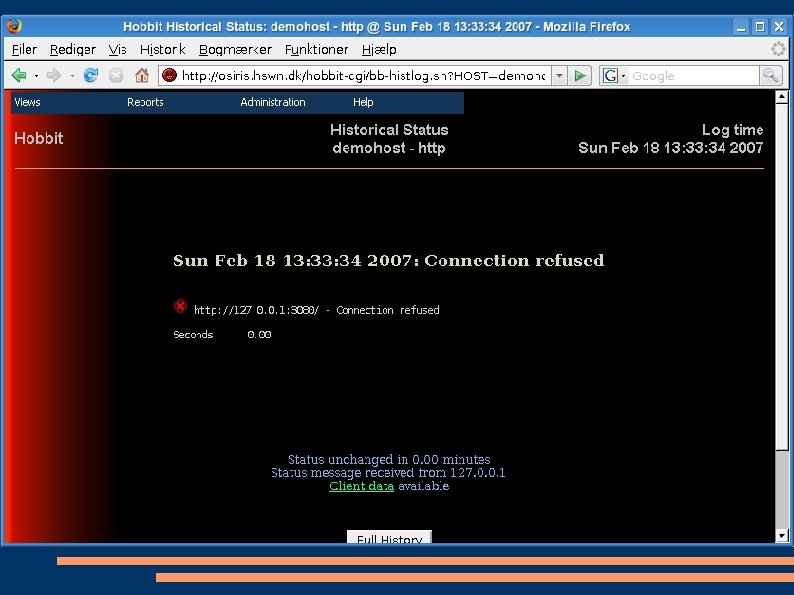

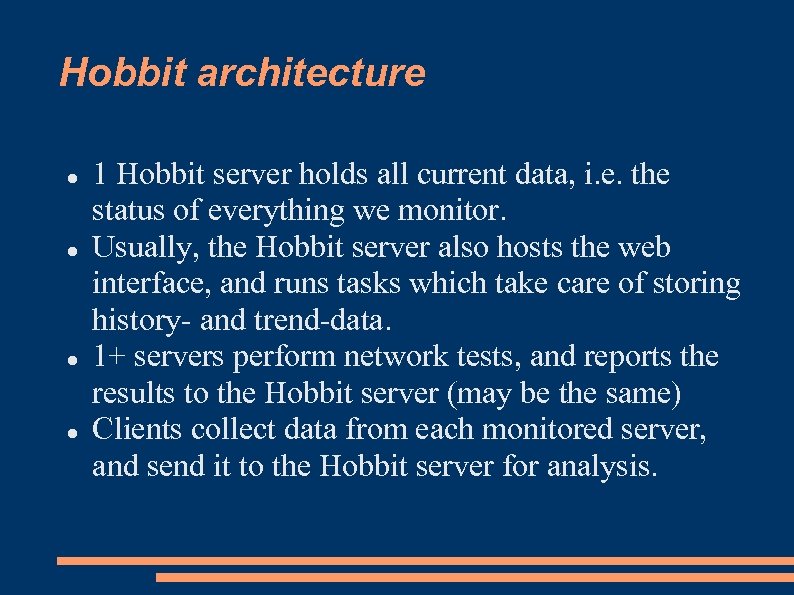
Hobbit architecture 1 Hobbit server holds all current data, i. e. the status of everything we monitor. Usually, the Hobbit server also hosts the web interface, and runs tasks which take care of storing history- and trend-data. 1+ servers perform network tests, and reports the results to the Hobbit server (may be the same) Clients collect data from each monitored server, and send it to the Hobbit server for analysis.
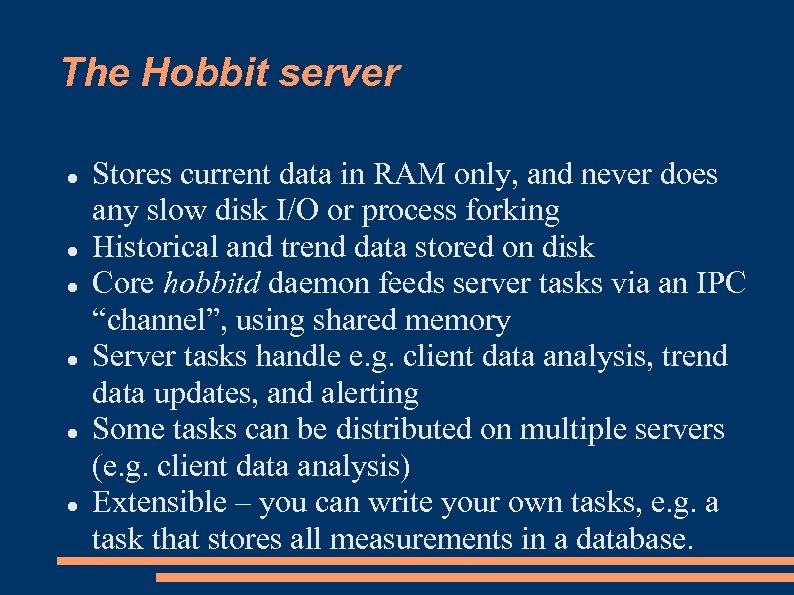
The Hobbit server Stores current data in RAM only, and never does any slow disk I/O or process forking Historical and trend data stored on disk Core hobbitd daemon feeds server tasks via an IPC “channel”, using shared memory Server tasks handle e. g. client data analysis, trend data updates, and alerting Some tasks can be distributed on multiple servers (e. g. client data analysis) Extensible – you can write your own tasks, e. g. a task that stores all measurements in a database.
Hobbit web interface Overview pages are static HTML, rebuilt once a minute with the current status data. Detailed status pages are dynamically generated “Critical Systems” view is dynamic Will probably switch to an all-dynamic setup The web UI is not particularly attractive or flexible, so web designers are welcome! Some customization is possible by modifying header- and footer-files
Network service monitoring ping : Is the server alive ? Connect : Will it accept new connections ? Service : Is the network service running ? Application : Is it working ? It is easy to check that the service is running because it uses a standard protocol (eg HTTP) But the end-user only cares about the application!
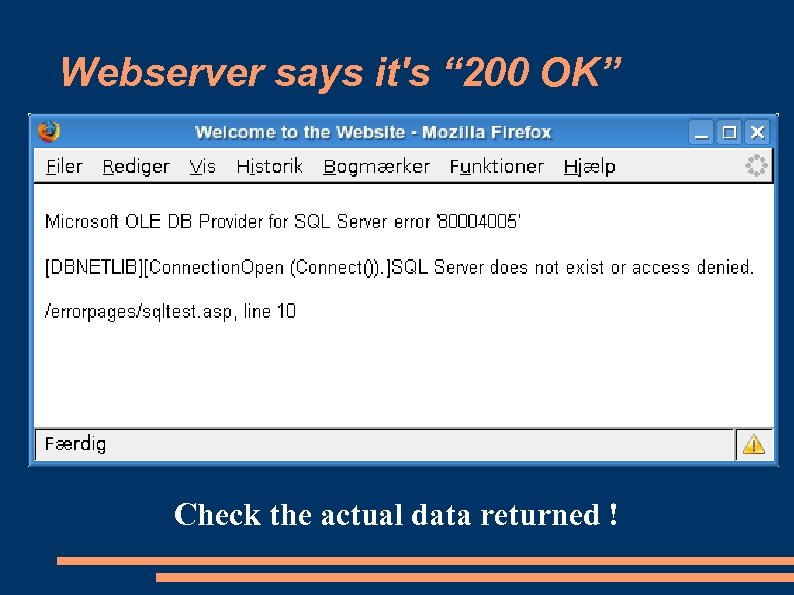
Webserver says it's “ 200 OK” Check the actual data returned !
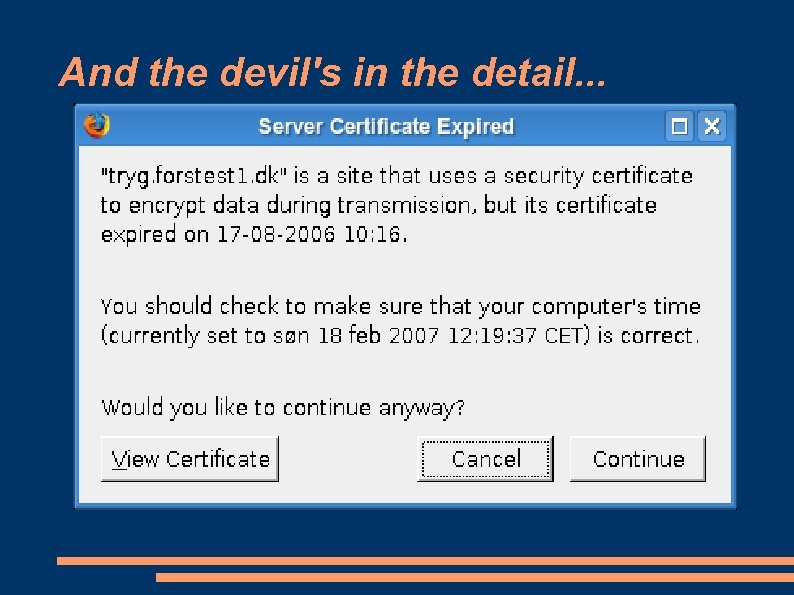
And the devil's in the detail. . .
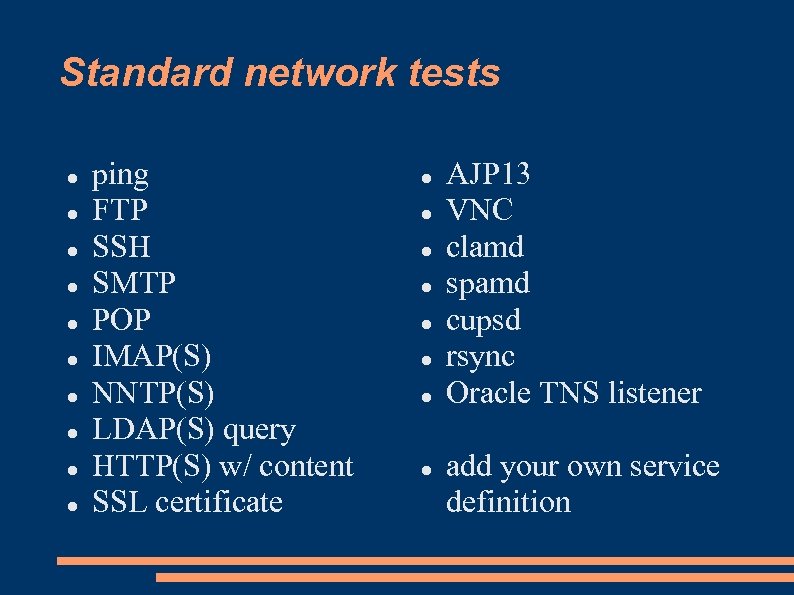
Standard network tests ping FTP SSH SMTP POP IMAP(S) NNTP(S) LDAP(S) query HTTP(S) w/ content SSL certificate AJP 13 VNC clamd spamd cupsd rsync Oracle TNS listener add your own service definition
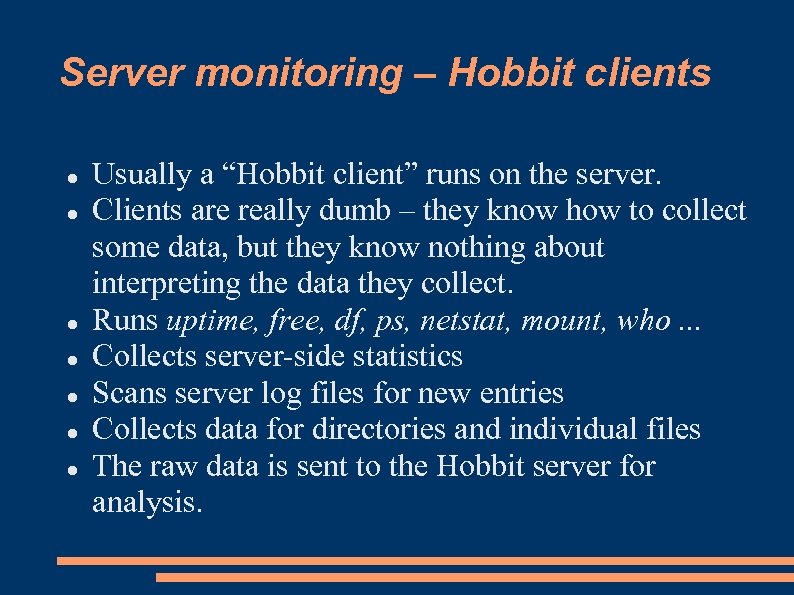
Server monitoring – Hobbit clients Usually a “Hobbit client” runs on the server. Clients are really dumb – they know how to collect some data, but they know nothing about interpreting the data they collect. Runs uptime, free, df, ps, netstat, mount, who. . . Collects server-side statistics Scans server log files for new entries Collects data for directories and individual files The raw data is sent to the Hobbit server for analysis.
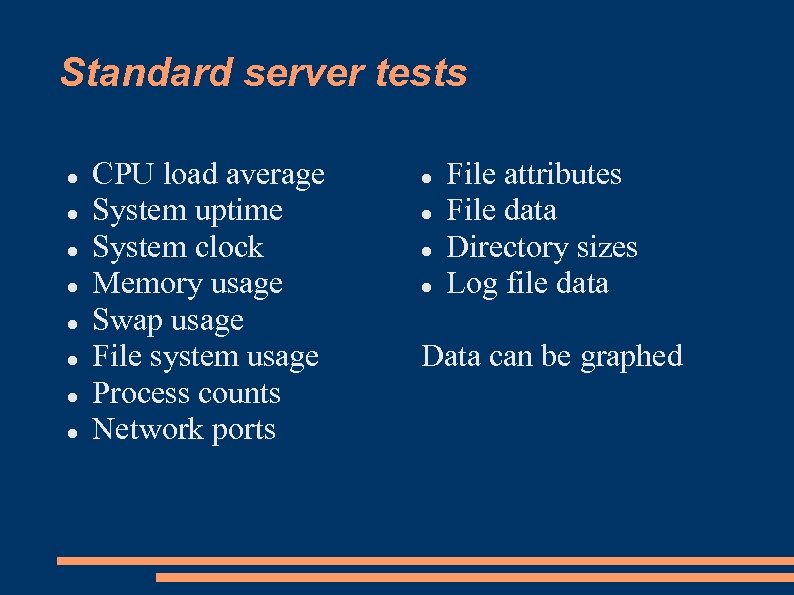
Standard server tests CPU load average System uptime System clock Memory usage Swap usage File system usage Process counts Network ports File attributes File data Directory sizes Log file data Data can be graphed
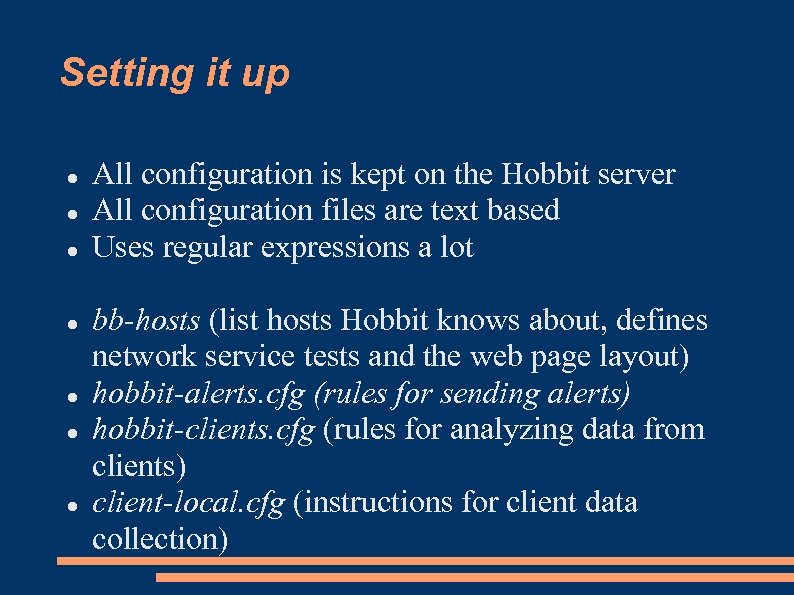
Setting it up All configuration is kept on the Hobbit server All configuration files are text based Uses regular expressions a lot bb-hosts (list hosts Hobbit knows about, defines network service tests and the web page layout) hobbit-alerts. cfg (rules for sending alerts) hobbit-clients. cfg (rules for analyzing data from clients) client-local. cfg (instructions for client data collection)
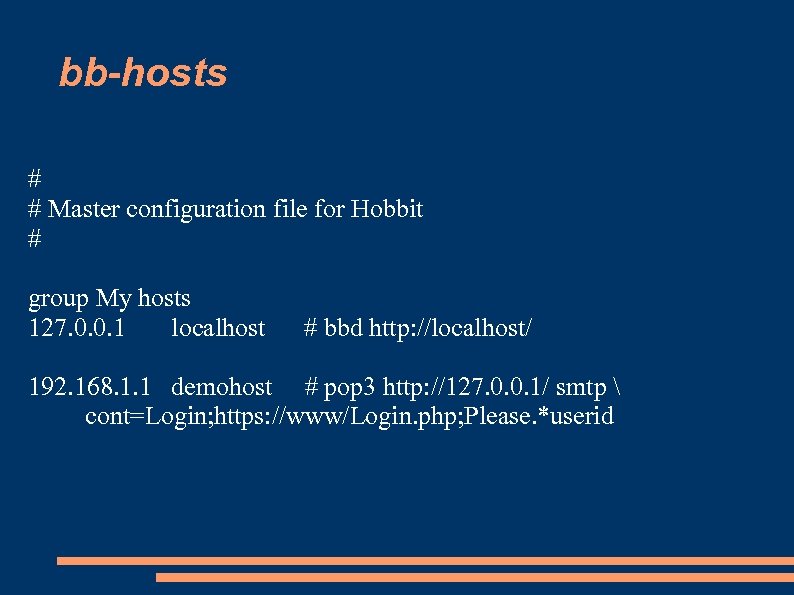
bb-hosts # # Master configuration file for Hobbit # group My hosts 127. 0. 0. 1 localhost # bbd http: //localhost/ 192. 168. 1. 1 demohost # pop 3 http: //127. 0. 0. 1/ smtp cont=Login; https: //www/Login. php; Please. *userid
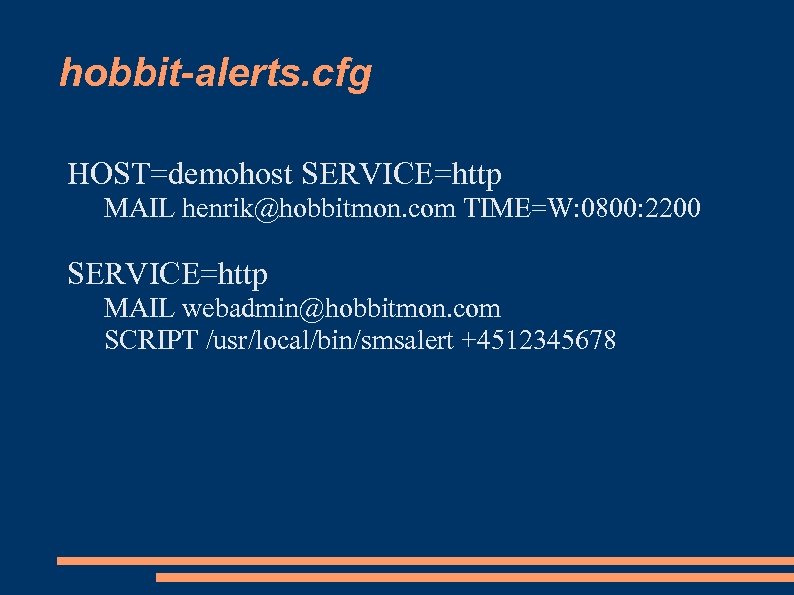
hobbit-alerts. cfg HOST=demohost SERVICE=http MAIL henrik@hobbitmon. com TIME=W: 0800: 2200 SERVICE=http MAIL webadmin@hobbitmon. com SCRIPT /usr/local/bin/smsalert +4512345678
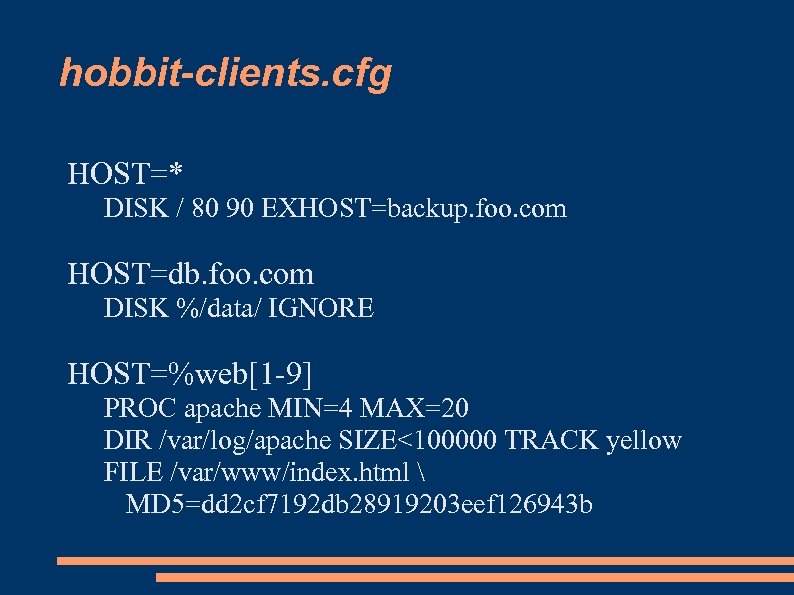
hobbit-clients. cfg HOST=* DISK / 80 90 EXHOST=backup. foo. com HOST=db. foo. com DISK %/data/ IGNORE HOST=%web[1 -9] PROC apache MIN=4 MAX=20 DIR /var/log/apache SIZE<100000 TRACK yellow FILE /var/www/index. html MD 5=dd 2 cf 7192 db 28919203 eef 126943 b
![client-local. cfg # This file tell clients what file/log data to report [linux] log: client-local. cfg # This file tell clients what file/log data to report [linux] log:](https://present5.com/presentation/e00d8d28f98396cb14eee88aa6a6846f/image-29.jpg)
client-local. cfg # This file tell clients what file/log data to report [linux] log: /var/log/messages [web 1] dir: /var/log/apache file: /var/www/default. html: md 5
Why server-side analysis? Managing configuration files on each monitored server is impossible when you have 2000 clients. Bulk configuration updates are much easier Configuration settings can apply to groups of hosts Adding new analysis tools only requires upgrading the Hobbit server – not all of the clients (provided they already collect the necessary data, of course) Having RAW data available is USEFUL. Only downside: Your Hobbit server must spend some cpu time analyzing the raw client data
Custom checks Custom checks normally check something, then send a red/yellow/green “status” message A check can run locally on a host as part of the client installation A check can run centrally and pull data from several hosts (eg. grabbing data with SNMP) A check can run on the Hobbit server, using data that has already been collected (“combo-tests” or extra client-data analysis) Numeric data can be tracked in graphs
![Simple client-side check #!/bin/bash COLUMN=weather; COLOR=green DEGREES=`/usr/local/bin/getweather temperature` if [ $DEGREES -ge 30 ]; Simple client-side check #!/bin/bash COLUMN=weather; COLOR=green DEGREES=`/usr/local/bin/getweather temperature` if [ $DEGREES -ge 30 ];](https://present5.com/presentation/e00d8d28f98396cb14eee88aa6a6846f/image-32.jpg)
Simple client-side check #!/bin/bash COLUMN=weather; COLOR=green DEGREES=`/usr/local/bin/getweather temperature` if [ $DEGREES -ge 30 ]; then COLOR=red; fi $BBDISP “status $MACHINE. $COLUMN $COLOR `date` temperature=$DEGREES” exit 0
Server-side checks You can hook modules into all kinds of Hobbit data: Status messages, data collected from Hobbit clients and so on. E. g. Hobbit clients run “who” to report who is logged on. To monitor for a root login on all servers only takes is 62 lines of Perl (see hobbitd_rootlogin. pl in source)
Windows, SNMP and other stuff Windows client: BBWin Note: Does not support central configuration SNMP add-on: Devmon Both are OSS, available on Sourceforge. net Other add-ons available, e. g. for database monitoring. Add-ons for Big Brother (available from deadcat. net) can be used – but check licensing
Hobbit@CSC - Summary The Copenhagen data center is the largest CSC data center in EMEA, globally in the top 5. Hobbit/BBWin/BB clients on 90% of all servers. Hobbit is considered mission-critical. Lots of network tests, especially for Web- and middleware systems (J 2 EE and LDAP) Web application monitoring done through customer-built “monitoring” web pages
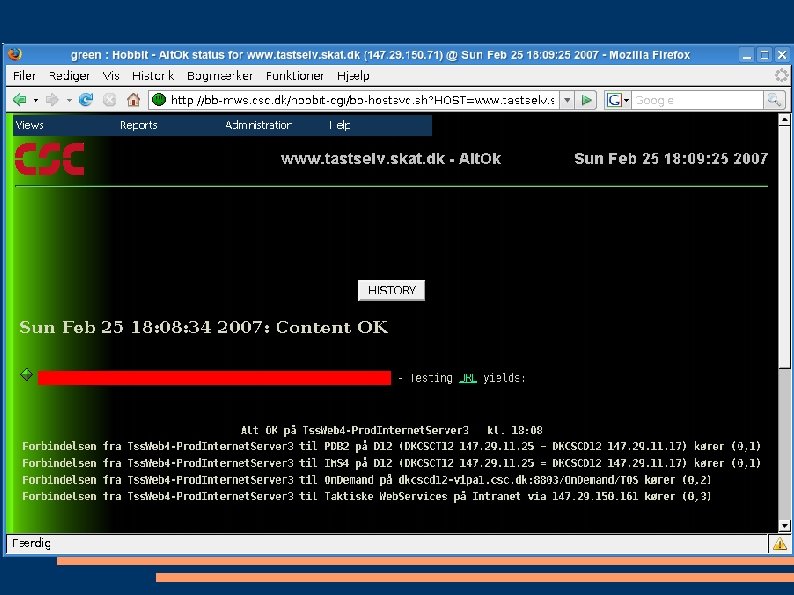
Hobbit@CSC – Multiple views Multiple sets of web pages with Hobbit data: One set grouped by account manager, then by account: Lets the account manager quickly see if his customers are running OK One set grouped by sysadmin group, then by account: Lets the system administrators quickly see what servers need attention One set for customers who want access to Hobbit The “Critical Systems” view is monitored 24 x 7
Hobbit@CSC - reports Availability reports pre-generated for daily, weekly and monthly availability Reports and detailed history available on-line for 3 months Monthly reports available for 12 months Graphs clean-up automatically, provide data for 1½ years (1 day average)
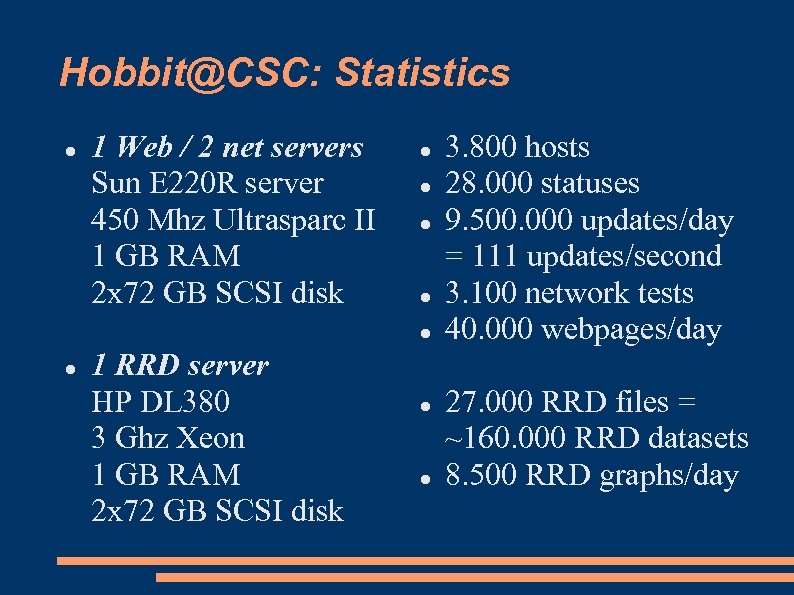
Hobbit@CSC: Statistics 1 Web / 2 net servers Sun E 220 R server 450 Mhz Ultrasparc II 1 GB RAM 2 x 72 GB SCSI disk 1 RRD server HP DL 380 3 Ghz Xeon 1 GB RAM 2 x 72 GB SCSI disk 3. 800 hosts 28. 000 statuses 9. 500. 000 updates/day = 111 updates/second 3. 100 network tests 40. 000 webpages/day 27. 000 RRD files = ~160. 000 RRD datasets 8. 500 RRD graphs/day
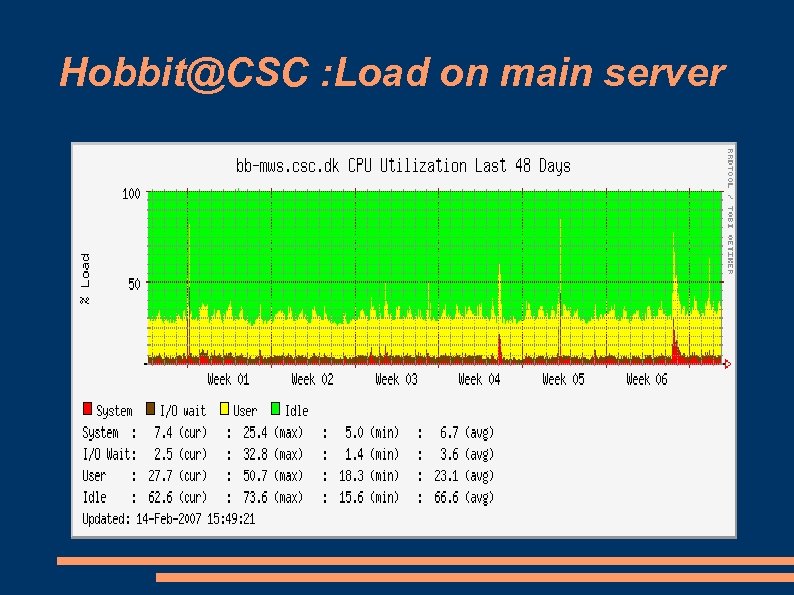
Hobbit@CSC : Load on main server
Future work Load balancing of Hobbit tasks: 4. 3. 0 Graph updates and viewing History log storage Client data analysis Network checks High availability ? Maybe not. . . can be handled externally Re-design the web UI – any volunteers ? Automated web checking of a full user session, perhaps using Mozilla or Konqueror

The End Questions ?
e00d8d28f98396cb14eee88aa6a6846f.ppt