

5998ca2b02632f32488e43b9ec354e5c.ppt
- Количество слайдов: 52
 HIV Epidemiology and Treatment in 2009 David A. Wohl, MD Associate Professor The University of North Carolina at Chapel Hill
 Overview • State of the epidemic • When to initiate antiretroviral therapy in HIV patients remains an important and debated question • Treatment continues to evolve with new options for initial therapy and for treatment-experienced patients
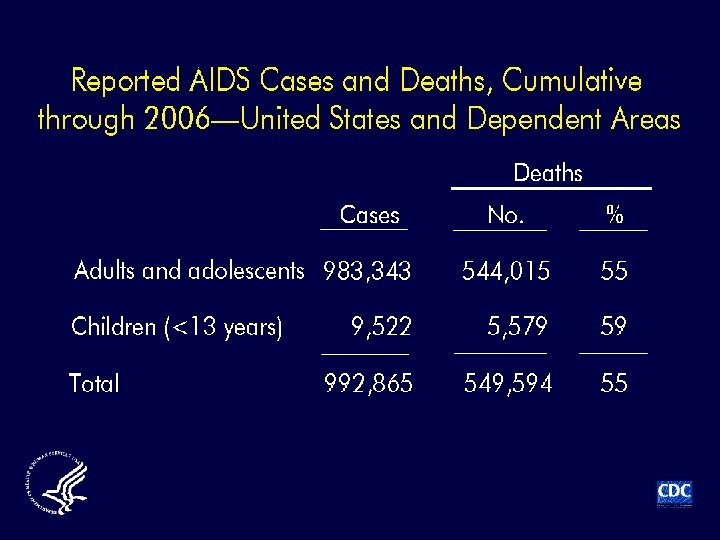
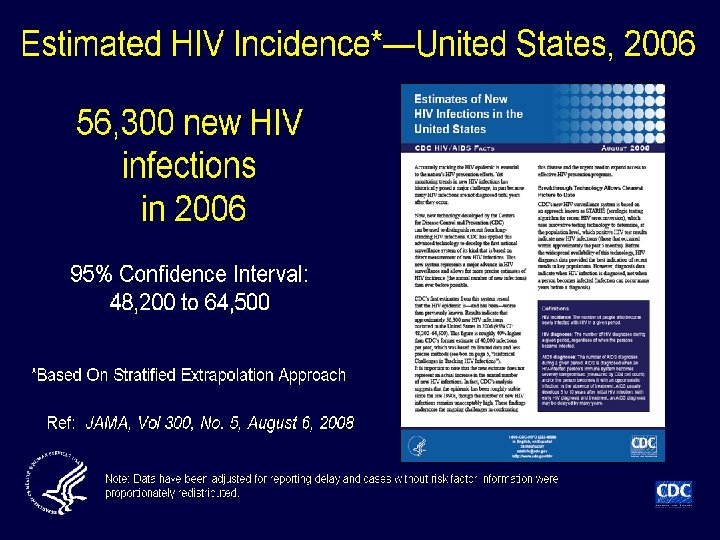
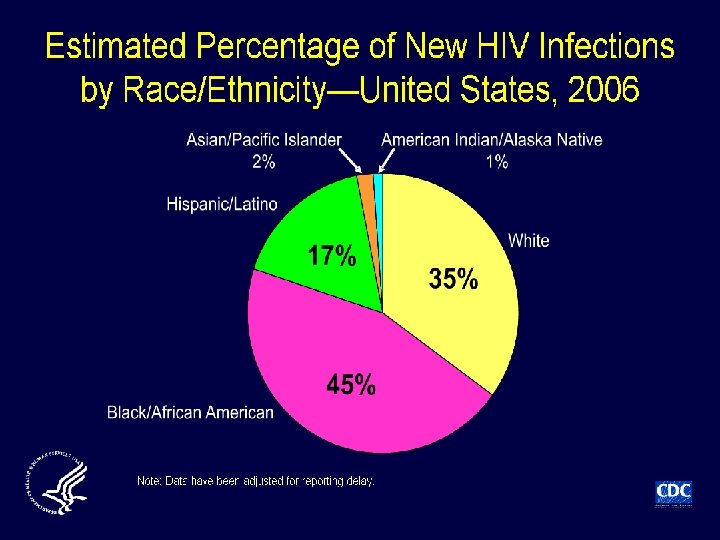
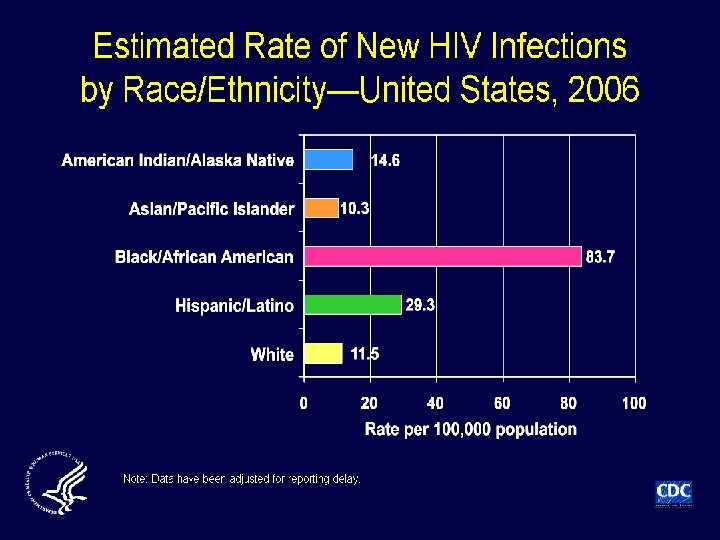
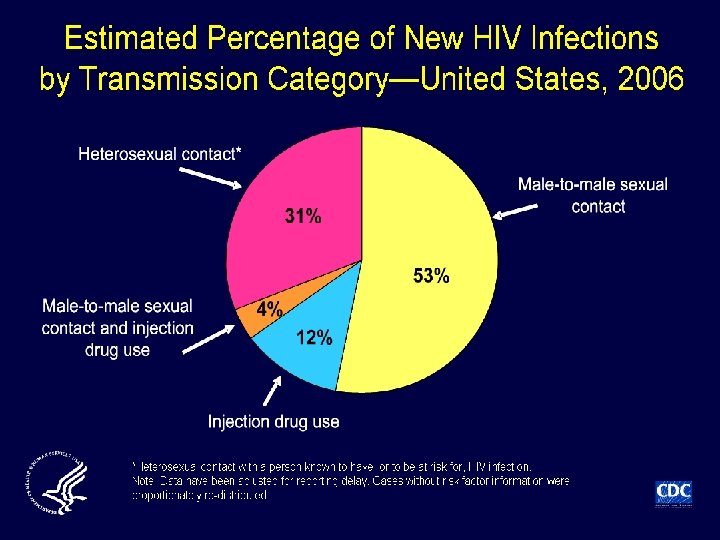
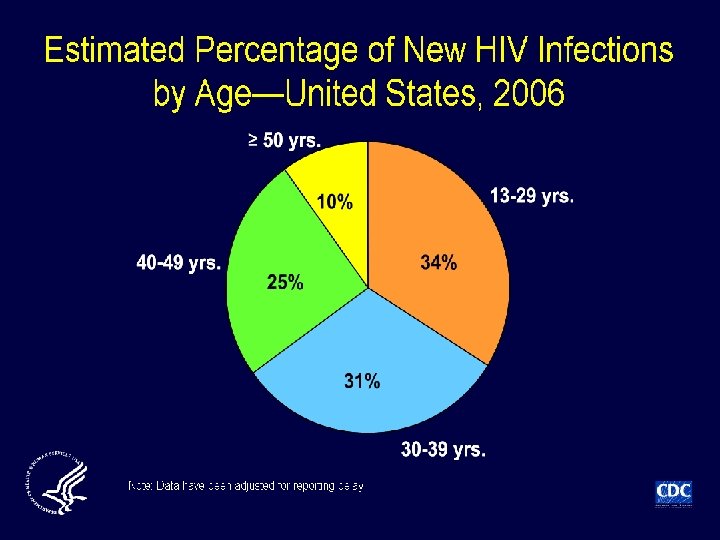
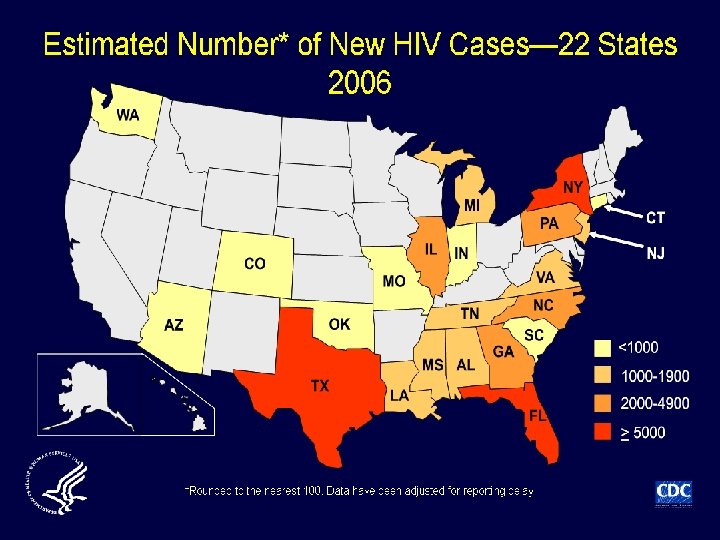
 not previously directly") Incidence of HIV infection in the USA • Incidence (new infections) not previously directly measured; estimated at 40, 000 cases/year Method • Immunoassays (infection classified as recent or longstanding) applied to select serum samples of newlydiagnosed HIV infection from 22 states in 2006 Results • 2133/6864 (31%) specimens classified as recent • Extrapolation from these data: 56, 300 new cases of HIV annually in USA Hall HI, et al. JAMA 2008; 300: 520– 529
Incidence of HIV infection in the USA • Incidence (new infections) not previously directly measured; estimated at 40, 000 cases/year Method • Immunoassays (infection classified as recent or longstanding) applied to select serum samples of newlydiagnosed HIV infection from 22 states in 2006 Results • 2133/6864 (31%) specimens classified as recent • Extrapolation from these data: 56, 300 new cases of HIV annually in USA Hall HI, et al. JAMA 2008; 300: 520– 529
 HIV Prevention Efforts Abstain, Be faithful, Condoms, Counseling & testing ABC Immunization HSV-2 suppressive treatment I C H Genital tract infection control D G F E Female-controlled microbicides Ramjee G. XVI IAC; 2006 Toronto. Abstract TUPL 02 Circumcision Diaphragms Exposure prophylaxis (MTCT, PEP, Pr. EP)
 Changing Treatment Models
 pt 94 19 M 19 95 ar ch Se 1 pt 99 1 5 S 99 – M ep 5 ar t 1 ch 99 5 M 199 – ar 6 c Se h 1 pt 99 1 6 Se 996 – M p ar t 1 ch 99 M 19 6– ar 97 c Se h 1 pt 99 1 7 Se 997 – M p ar t 1 ch 99 M 19 7– ar 98 c Se h 1 pt 99 19 8– S M ept 98 ar 1 ch 99 M 19 8– ar 9 c 9 Se h 1 pt 99 1 9 Se 999 – M p ar t 1 ch 99 20 9– M ar 00 c Se h 2 pt 00 2 0– Se 000 M p ar t 2 ch 00 M 20 0– ar 01 c Se h 2 pt 00 20 1– Se 01 pt on 20 w 01 ar – ds rc h
 D: A: D - 2, 192 deaths/158, 959 person-years = death rate of 13. 8 per 1000 person years (95% CI 13. 2 -14. 4)1 • Euro. SIDA – Non-AIDS events more common and of these large proportion were due to CVD 2 1 Smith C, et al. CROI 2009 #145; 2 Mocroft A, et al CROI 2009 #707
 Evolution of the DHHS Recommendations In 1998: 1998 1999 2000 § Antiretroviral therapy should be offered to asymptomatic patients 1 with CD 4+ T-cell counts <500 cells/mm 3 § Many experts would delay therapy and observe asymptomatic patients with CD 4+ T-cell counts >500 cells/mm 3; however, some experts would treat 1 2002 2003 2004 2005 2006 2007 2008 In 2004: § Antiretroviral therapy is recommended for symptomatic patients or asymptomatic patients 2 with CD 4+ T-cell counts <200 cells/mm 3 § Asymptomatic patients with CD 4+ T-cell counts 201– 350 cells/mm 3 should be offered treatment 2 In 2008: § Antiretroviral therapy should be initiated 3 in patients with a history of an AIDS-defining illness or with a CD 4+ T-cell count <350 cells/mm 3 § Antiretroviral therapy may be considered 3 in some patients with CD 4+ T-cell counts >350 cells/mm 3 1. Centers for Disease Control and Prevention. Report of the NIH panel to define principles of therapy of HIV Infection and guidelines for the use of antiretroviral agents in HIV-infected adults and adolescents. MMWR. 1998; 47(No. RR-5): 43, 47, 48. 2. Panel on Antiretroviral Guidelines for Adults and Adolescents. Guidelines for the use of antiretroviral agents in HIV-1 -infected adults and adolescents. March 23, 2004; 1 -97. Available at: http: //aidsinfo. nih. gov/Content. Files/Adultand. Adolescent. GL 03232004003. pdf. Accessed February 10, 2009. 3. Panel on Antiretroviral Guidelines for Adults and Adolescents. Guidelines for the use of antiretroviral agents in HIV-1 -infected adults and adolescents. Department of Health and Human Services. November 3, 2008; 1 -139. Available at: http: //aidsinfo. nih. gov/contentfiles/Adultand. Adolescent. GL. pdf. Accessed February 10, 2009. 19
 2008 DHHS Guidelines for Initiation of HIV Therapy HIV Infection History of AIDS -defining illness Treat CD 4+ T cells/mm 3 ≥ 350 Treatment may be considered in some patients <350 Treat Antiretroviral therapy should be initiated for the following groups regardless of CD 4+ T-cell count: • Pregnant women • Patients with HIV-associated nephropathy • Patients coinfected with HBV when treatment for HBV infection is indicated Panel on Antiretroviral Guidelines for Adult and Adolescents. Guidelines for the use of antiretroviral agents in HIV -1 -infected adults and adolescents. Department of Health and Human Services. November 3, 2008; 1 -139. Available at: http: //aidsinfo. nih. gov/contentfiles/Adultand. Adolescent. GL. pdf. Accessed February 10, 2009. 20
 Current Antiretroviral Medications NRTI • • Abacavir Didanosine Emtricitabine Lamivudine Stavudine Zidovudine Tenofovir PI ABC DDI FTC 3 TC D 4 T ZDV TDF NNRTI • • Delavirdine Efavirenz Nevirapine Etravirine Integrase Inhibitor • Raltegravir DLV EFV NVP ETV RAL • • • Amprenavir Atazanavir Darunavir Fosamprenavir FPV Indinavir Lopinavir Nelfinavir Ritonavir Saquinavir Tipranavir APV ATV DRV IDV LPV NFV RTV SQV TPV Entry Inhibitor • • Enfuvirtide Marviroc T-20 MVC
 A Nucs PI TRUVADA KALETRA LEXIVA/NOR VIR REYATAZ/NO RVIR B Non-Nucs SUSTIVA
 A Nucs PI TRUVADA KALETRA LEXIVA/NOR VIR REYATAZ/NO RVIR B Non-Nucs SUSTIVA
 A Nucs PI TRUVADA KALETRA LEXIVA/NOR VIR REYATAZ/NO RVIR B Non-Nucs SUSTIVA
 A Nucs PI TRUVADA KALETRA LEXIVA/NOR VIR REYATAZ/NO RVIR B Non-Nucs SUSTIVA
 TDF/3 TC/EFV compared to d 4 T/3 TC/EFV < 400 Copies/m. L ITT Gallant, J. E. et al. JAMA 2004; 292: 191 -201. Copyright restrictions may apply.
 Weighing the Benefits and Risks Associated With Earlier Initiation of HIV Therapy Potential Benefits • Improved immune function Potential Risks • Development of treatment- • Prevention of opportunistic infections (OIs) • Reduced secondary complications, including cardiovascular, renal, hepatic disease, and non. AIDS-associated malignancies and infections • Decreased risk of transmission to others • • • related side effects and toxicities Adherence challenges Resistance emergence, resulting in loss of future treatment options Treatment fatigue Premature use of therapy before the development of improved ARV combinations Transmission of drug-resistant virus in patients without full virologic suppression Panel on Antiretroviral Guidelines for Adult and Adolescents. Guidelines for the use of antiretroviral agents in HIV-1 -infected adults and adolescents. Department of Health and Human Services. November 3, 2008; 1 -139. Available at: http: //aidsinfo. nih. gov/contentfiles/Adultand. Adolescent. GL. pdf. Accessed February 10, 2009. 27
 Immune Recovery by Baseline CD 4+ T-cells in Patients with Sustained Viral Suppression Median CD 4+ Cell Count Over Time Stratified by Baseline CD 4+ Cell Counts CD 4 lymphocyte count, cells/µL ≤ 200 cells/µL 900 800 700 600 500 400 300 200 100 0 0 201 -350 cells/µL Year 1 Year 2 Year 3 Year 4 Years after starting HAART Moore RD, Keruly JC. Clin Infect Dis. 2007; 44: 441– 446. >350 cells/µL Year 5 Year 6
 SMART: Continuous Treatment vs Treatment Interruption • • • Randomized, controlled study of treatment interruption Primary endpoint: development of opportunistic disease or death from any cause Select secondary endpoints: death from any cause; serious opportunistic disease; major cardiovascular, renal, or hepatic disease; and Grade 4 adverse events (not including opportunistic disease) Total Patients (N = 5472) Entry criteria: baseline CD 4+ T-cell count >350 cells/mm 3 Viral Suppression (VS) Strategy (n = 2752) Continuous Treatment Drug Conservation (DC) Strategy (n = 2720) Treatment Interruption* *Patients in the treatment interruption ART arm initiated therapy when CD 4+ T-cell count decreased to <250 cells/mm 3, and continued until CD 4+ T-cell count increased to >350 cells/mm 3, with repeated interruptions and reinitiation at CD 4+ T-cell counts of >350 and <250 cells/mm 3, respectively The Strategies for Management of Antiretroviral Therapy (SMART) Study Group. N Engl J Med. 2006; 355: 2283 -2296. 29
 Cumulative probability of event Treatment Interruption Associated With Higher Rates of AIDS-related OI or Death (Any Cause) 0. 20 Hazard ratio, 2. 6; 95% CI, 1. 9 -3. 7; P<0. 001 0. 15 Treatment Interruption (DC group) 0. 10 0. 05 Continuous Treatment (VS group) 0. 00 No. at Risk Drug conservation (DC) Viral suppression (VS) 0 4 8 12 16 20 24 28 32 36 40 44 540 572 444 474 372 388 280 288 162 173 Months 2720 2074 2752 2081 1666 1301 1040 1695 1310 1077 870 906 689 724 The Strategies for Management of Antiretroviral Therapy (SMART) Study Group. N Engl J Med. 2006; 355: 2283 -2296. Adapted with permission from New England Journal of Medicine. © 2006. 30
 Treatment Interruption Associated With Higher Rates of Major Cardiovascular, Hepatic, and Renal Disease • No apparent reductions in rates of major cardiovascular, hepatic, and renal disease associated with deferred ART or periodic ARTsparing regimens End Point Hazard Ratio (95%CI)* Death, any cause 1. 8 (1. 2 -2. 9) Major cardiovascular, renal, or hepatic disease 1. 7 (1. 1 -2. 5) Serious opportunistic disease 6. 6 (1. 5 -29. 1) Grade 4 adverse event 1. 2 (1. 0 -1. 5) *Treatment Interruption vs Continuous Treatment The Strategies for Management of Antiretroviral Therapy (SMART) Study Group. N Engl J Med. 2006; 355: 2283 -2296. Adapted with permission from New England Journal of Medicine. © 2006. 31
 • Regional collaboration of") North American AIDS Cohort Collaboration On Research and Design (NA-ACCORD) • Regional collaboration of 22 HIV research cohorts from the United States and Canada established in 2006 • Objective: Test the hypothesis that initiating HAART rather than deferring treatment at earlier stages of disease improves survival • Methods: – Study patients: All HIV-infected individuals with CD 4+ cell count of >500 cells/mm 3 while in active follow-up between 1996 and 2006 – Outcome: All-cause mortality – Groups compared from same CD 4+ cell count level • Immediate treatment: Initiate HAART within 1. 5 years after first CD 4+ cell count >500 cells/mm 3 • Deferred treatment: Initiate HAART when CD 4+ cell count reaches ≤ 500 cells/mm 3 Kitahata M, et al. Oral Presentation at: 16 th Conference on Retroviruses and Opportunistic Infections. February 8 -11, 2009; Montreal, Canada. http: //www. retroconference. org/2009/data/files/webcast. htm. Accessed February 11, 2009. 32
North American AIDS Cohort Collaboration On Research and Design (NA-ACCORD) • Regional collaboration of 22 HIV research cohorts from the United States and Canada established in 2006 • Objective: Test the hypothesis that initiating HAART rather than deferring treatment at earlier stages of disease improves survival • Methods: – Study patients: All HIV-infected individuals with CD 4+ cell count of >500 cells/mm 3 while in active follow-up between 1996 and 2006 – Outcome: All-cause mortality – Groups compared from same CD 4+ cell count level • Immediate treatment: Initiate HAART within 1. 5 years after first CD 4+ cell count >500 cells/mm 3 • Deferred treatment: Initiate HAART when CD 4+ cell count reaches ≤ 500 cells/mm 3 Kitahata M, et al. Oral Presentation at: 16 th Conference on Retroviruses and Opportunistic Infections. February 8 -11, 2009; Montreal, Canada. http: //www. retroconference. org/2009/data/files/webcast. htm. Accessed February 11, 2009. 32
 Distribution of 9155 Study Patients by HAART Initiation vs Deferral Groups 500 1 st CD 4+ >500 cells/mm 3 measured 1996 -2006 and no prior ART or AIDS (N=9155) Initiate HAART in 1. 5 years (n=2616) Defer HAART (n=6539) Transit to CD 4+ ≤ 500 cells/mm 3 1996 No Transit (n=2658) Initiate HAART in 1. 5 years (n=945) No HAART Initiation in 1. 5 years (n=2936) 2006 Kitahata M, et al. Oral Presentation at: 16 th Conference on Retroviruses and Opportunistic Infections. February 8 -11, 2009; Montreal, Canada. http: //www. retroconference. org/2009/data/files/webcast. htm. Accessed February 11, 2009. 33
 Defer HAART") HAART Initiation, Regimen, and VL Response Initiate HAART >500 cells/mm 3 (n=2616) Defer HAART and Initiate <500 cells/mm 3 (n=945) Median (IQR) CD 4+ cell count cells/mm 3 prior to HAART initiation 674 (579, 831) 390 (300, 451) Median (IQR) time (months) from first CD 4+ cell count in the interval to HAART 1 (<1 -2) 3 (<1 -8) 1/00 (4/98, 12/01) 3/00 (4/98, 1/03) PI-based (non-boosted) 51 41 Boosted PI-based 7 9 NNRTI-based 32 40 PI and NNRTI-based 3 2 ≥ 3 NRTIs 6 8 79 73 Median month/year HAART initiation (IQR)a Type of initial HAART regimen (%) Viral load <500 copies/m. L within 12 months of HAART a Patients initiating HAART >500 cells/mm 3 by year peaked at 16% in 1998; <10% by 2003 Kitahata M, et al. Oral Presentation at: 16 th Conference on Retroviruses and Opportunistic Infections. February 8 -11, 34 2009; Montreal, Canada. http: //www. retroconference. org/2009/data/files/webcast. htm. Accessed February 11, 2009.
HAART Initiation, Regimen, and VL Response Initiate HAART >500 cells/mm 3 (n=2616) Defer HAART and Initiate <500 cells/mm 3 (n=945) Median (IQR) CD 4+ cell count cells/mm 3 prior to HAART initiation 674 (579, 831) 390 (300, 451) Median (IQR) time (months) from first CD 4+ cell count in the interval to HAART 1 (<1 -2) 3 (<1 -8) 1/00 (4/98, 12/01) 3/00 (4/98, 1/03) PI-based (non-boosted) 51 41 Boosted PI-based 7 9 NNRTI-based 32 40 PI and NNRTI-based 3 2 ≥ 3 NRTIs 6 8 79 73 Median month/year HAART initiation (IQR)a Type of initial HAART regimen (%) Viral load <500 copies/m. L within 12 months of HAART a Patients initiating HAART >500 cells/mm 3 by year peaked at 16% in 1998; <10% by 2003 Kitahata M, et al. Oral Presentation at: 16 th Conference on Retroviruses and Opportunistic Infections. February 8 -11, 34 2009; Montreal, Canada. http: //www. retroconference. org/2009/data/files/webcast. htm. Accessed February 11, 2009.
 Cumulative Mortality Estimates Calculated Using Extended Kaplan-Meier Survival Estimates Cumulative Mortality 0. 20 0. 15 CD 4+ >500 cells/mm 3 & Defer HAART (n=6539) 0. 10 0. 05 CD 4+ >500 cells/mm 3 & Initiate HAART (n=2616) 0. 00 0 2 4 6 8 Years after 1996 Kitahata M, et al. Oral Presentation at: 16 th Conference on Retroviruses and Opportunistic Infections. February 8 -11, 2009; Montreal, Canada. http: //www. retroconference. org/2009/data/files/webcast. htm. Accessed February 11, 2009. 35 10
a 95% Confidence Interval P-value") Inverse Probability Weighted Cox Regression Multivariate Analysis Relative Hazard (RH)a 95% Confidence Interval P-value Deferral of HAART at >500 cells/mm 3 1. 6 1. 3, 1. 9 <0. 001 Female 1. 2 0. 9, 1. 6 0. 117 Older age (per 10 years) 1. 6 1. 5, 1. 7 <0. 001 Baseline CD 4+ cell count (per 100 cells/mm 3) 1. 0, 1. 1 0. 696 • Baseline HIV RNA (RH deferral = 1. 5, 95% CI: 1. 2, 1. 9; P<0. 001) – HIV RNA was not an independent predictor of mortality • Increased risk of mortality with deferral was similar throughout the 10 -year and calendar year. a. Stratified by cohortstudy period Kitahata M, et al. Oral Presentation at: 16 th Conference on Retroviruses and Opportunistic Infections. February 8 -11, 2009; Montreal, Canada. http: //www. retroconference. org/2009/data/files/webcast. htm. Accessed February 11, 2009. 36
Inverse Probability Weighted Cox Regression Multivariate Analysis Relative Hazard (RH)a 95% Confidence Interval P-value Deferral of HAART at >500 cells/mm 3 1. 6 1. 3, 1. 9 <0. 001 Female 1. 2 0. 9, 1. 6 0. 117 Older age (per 10 years) 1. 6 1. 5, 1. 7 <0. 001 Baseline CD 4+ cell count (per 100 cells/mm 3) 1. 0, 1. 1 0. 696 • Baseline HIV RNA (RH deferral = 1. 5, 95% CI: 1. 2, 1. 9; P<0. 001) – HIV RNA was not an independent predictor of mortality • Increased risk of mortality with deferral was similar throughout the 10 -year and calendar year. a. Stratified by cohortstudy period Kitahata M, et al. Oral Presentation at: 16 th Conference on Retroviruses and Opportunistic Infections. February 8 -11, 2009; Montreal, Canada. http: //www. retroconference. org/2009/data/files/webcast. htm. Accessed February 11, 2009. 36
 When is Antiretroviral Therapy Started? Median CD 4 count at start of ART, 2003– 5 42 countries, 176 sites, 33, 008 patients • Review of data from 42 countries, 176 sites; n=33, 008 • Since 2000, CD 4+ cell count at initiation in developed countries remained stable at ~150– 200 cells/mm 3, increasing in Sub-Saharan Africa from 50 to 100 cells/mm 3 Egger M et al. 14 th CROI; 2007; Los Angeles. Abstract 62.
 CD 4+ T-cell Count Associated with Risk of Non–HIV Related Death (D: A: D Study) • Cohort study of >23, 000 patients in Europe, Australia, USA RR of death according to immune function and specific cause • 1248 (5. 3%) deaths 2000– 2004 (1. 6/100 personyears) • Both HIV- and non–HIVrelated mortality associated with CD 4+ cell count depletion, suggesting role for immunosuppression in causes of death typically considered not HIV-related* HIV Malignancy Liver Heart RR – Of these, 82% on ART Overall 100 10 1. 0 <50 50– 99 100– 199 200– 349 350– 499 >500 CD 4+ Cells/mm 3 0. 1 Weber R et al. 12 th CROI; 2005; Boston. Abstract 595. *Liver-related: Chronic viral hepatitis, liver failure (other); malignancy-related: malignancy, non-AIDS non-hepatitis; heart-related: MI, other CVD, other heart disease
 CD 4+T-cell Count Associated with Risk of AIDS and Non-AIDS-related Malignancies • Risk factors for fatal AIDS-defining malignancies (ADM) and non -ADM in the D: A: D study – Of 1246 deaths, 112 ADM and 193 non-ADM related • 4 most common non-ADM: lung, GI, hematologic, anal • Risk of ADM and non-ADM increased as CD 4 cells decrease • Additional risk factors – ADM: Prior AIDS event (RR 2. 43, P<0. 0001) – Non-ADM: Older age (RR 1. 53/5 years older, P<0. 0001), current smoking (RR 2. 42, P<0. 0001), active HBV (RR 1. 89, P=0. 008) D’Arminio Monforte A et al. 14 th CROI; 2007; Los Angeles. Abstract 84.
 Non-AIDS defining malignancies") Malignancies and CD 4+ T-cell Count Latest CD 4 (cells/mm 3) Non-AIDS defining malignancies Person Years AIDS-defining malignancies Rate (/1000 p-y) n RR (P) <50 2335 6. 0 (14) 15 (<0. 001) 20. 1 (47) 175 (<0. 001) 50 -99 2295 9. 6 (22) 19 (<0. 001) 4. 8 (11) 41 (<0. 001) 100 -199 8097 6. 8 (55) 10 (<0. 001) 2. 8 (23) 24 (<0. 001) 200 -349 21048 2. 0 (43) 3 (<0. 001) 0. 7 (14) 6 (<0. 001) 350 -499 24052 1. 1 (27) 2 (0. 3) 0. 3 (7) 3 (0. 09) ≥ 500 46903 0. 6 (27) 1 0. 1 (5) 1 D’Arminio Monforte A et al. 14 th CROI; 2007; Los Angeles. Abstract 84.
Malignancies and CD 4+ T-cell Count Latest CD 4 (cells/mm 3) Non-AIDS defining malignancies Person Years AIDS-defining malignancies Rate (/1000 p-y) n RR (P) <50 2335 6. 0 (14) 15 (<0. 001) 20. 1 (47) 175 (<0. 001) 50 -99 2295 9. 6 (22) 19 (<0. 001) 4. 8 (11) 41 (<0. 001) 100 -199 8097 6. 8 (55) 10 (<0. 001) 2. 8 (23) 24 (<0. 001) 200 -349 21048 2. 0 (43) 3 (<0. 001) 0. 7 (14) 6 (<0. 001) 350 -499 24052 1. 1 (27) 2 (0. 3) 0. 3 (7) 3 (0. 09) ≥ 500 46903 0. 6 (27) 1 0. 1 (5) 1 D’Arminio Monforte A et al. 14 th CROI; 2007; Los Angeles. Abstract 84.
 Maintaining Viral Suppression and CD 4+ T-Cells Makes a Difference
 Consequences of Stopping ART: SMART Trial HIV-1 -infected patients with CD 4+ cell count > 350 cells/mm 3 (N = 5472) 95. 4% treatment experienced Continuous antiretroviral therapy throughout follow-up* (n = 2752) ART stopped/deferred† until CD 4+ <250 cells/mm 3 then started to increase CD 4+ to >350 cells/mm 3 (n = 2720) El-Sadr W et al. N Engl J Med. 2006; 355: 2283 -2296. *Mean follow-up 16 months †The protocol also permitted antiretroviral therapy to be initiated/reinitiated if symptoms of disease from HIV infection developed or the percentage of CD 4+ lymphocytes (CD 4+ percentage) was less than 15%.
 SMART: Primary Endpoint and Components Endpoints #Pts w/ Events Death from any cause or Opportunistic Disease Relative Risk (95% CI) 2. 6 167 Death from any cause Serious opportunistic disease 1. 8 85 15 Severe Complications* 6. 6 1. 7 104 0. 1 1 Favors VS ► (drug conservation) (viral suppression) ► *CVD, Renal, Hepatic Events (fatal/nonfatal) El-Sadr W et al. N Engl J Med. 2006; 355: 2283 -2296. Favors DC 10
 Potential Public Health Benefits of Early Therapy
 (1/30 -1/200) Risk") Risk of Transmission 5 HIV RNA in Semen (Log 10 copies/ml) (1/30 -1/200) Risk of Transmission Reflects Genital Viral Burden 4 3 (1/100 -1/1000) (1/1000 - 1/10, 000) (1/500 - 1/2000) 2 Acute Asymptomatic Infection HIV AIDS Progression
Risk of Transmission 5 HIV RNA in Semen (Log 10 copies/ml) (1/30 -1/200) Risk of Transmission Reflects Genital Viral Burden 4 3 (1/100 -1/1000) (1/1000 - 1/10, 000) (1/500 - 1/2000) 2 Acute Asymptomatic Infection HIV AIDS Progression
 ART-Induced Reduction in Plasma HIV RNA Associated with Decreased Levels in Semen Controls (drug naive) n=55 Effective ART n=114 detectable HIV in semen Patients (%) with 100 P<0. 0001 80 60 P=0. 01 40 20 0 HIV-RNA Vernazza PL et al. AIDS. 2000; 14: 117 -121. HIV-DNA
 Couthino et al. , Bulletin of Mathematical Biology 2001
 STAT Testing Protocol + HIV Positive EIA/ Western Blot - HIV RNA testing + F/U Testing (Ab + HIV RNA) HIV Negative + Acute HIV
 Pooling and HIV RNA testing 90 individual HIV antibody negative specimens 9 intermediate pools (10 specimens) 1 master pool (90 specimens) A B C D E F G H I 1 2 3 4 5 6 7 8 9 10 A B C D E F G H I
 PEARLS • Not all patients with HIV are at risk for an OI • Keep CD 4 cell count in mind • Don’t give PPIs to those on ATAZANAVIR (REYATAZ) • Bronch early if PCP is suspected • If ARV to be stopped, stop all at once • Post DC ID clinic appts are available – Lynda Bell • Keep Acute HIV in mind – esp ER and urgent care • Consult ID on non-Med K cases of HIV
 Summary • Despite the evolution of the HIV treatment model, there remains no clearly optimal time for initiating therapy • The argument against earlier treatment includes risk of resistance and metabolic considerations • Potential considerations in favor of earlier treatment include: – Studies demonstrating better outcomes/less toxicity with ART – Evidence that viral suppression and enhanced CD 4+ Tcell numbers can be associated with better outcomes