2-2 Hemodynamic assessment.pptx
- Количество слайдов: 45
 Hemodynamic assessment using Echocardiography Geu-Ru Hong, MD, Ph. D Cardiology Division, College of Medicine, Yonsei University, Seoul, Korea
 Echocardiography Anatomic Information Functional Information
 Echocardiography Systolic Functional Information Wall Motion Analysis Diastolic Function Valvular Function Hemodynamic Function
 Doppler Echocardiography • • • Pressure Gradient Chamber Pressure Measurement Calculation of Stenotic Valve Area Calculation of Regurtgitant Volume Calculation of Flow Volume Assessment of LV Diastolic Function
 Christian Doppler was an Austrian mathematician who lived between 1803") - Christian Johann Doppler(1842) Christian Doppler was an Austrian mathematician who lived between 1803 -1853. He is known for the principle he first proposed in Concerning the coloured light of double stars in 1842. He hypothesised that the pitch of a sound would change if the source of the sound was moving. He didn't test this hypothesis until 1845.
- Christian Johann Doppler(1842) Christian Doppler was an Austrian mathematician who lived between 1803 -1853. He is known for the principle he first proposed in Concerning the coloured light of double stars in 1842. He hypothesised that the pitch of a sound would change if the source of the sound was moving. He didn't test this hypothesis until 1845.
 -") Doppler Effect - Christian Johann Doppler(1842) -
Doppler Effect - Christian Johann Doppler(1842) -
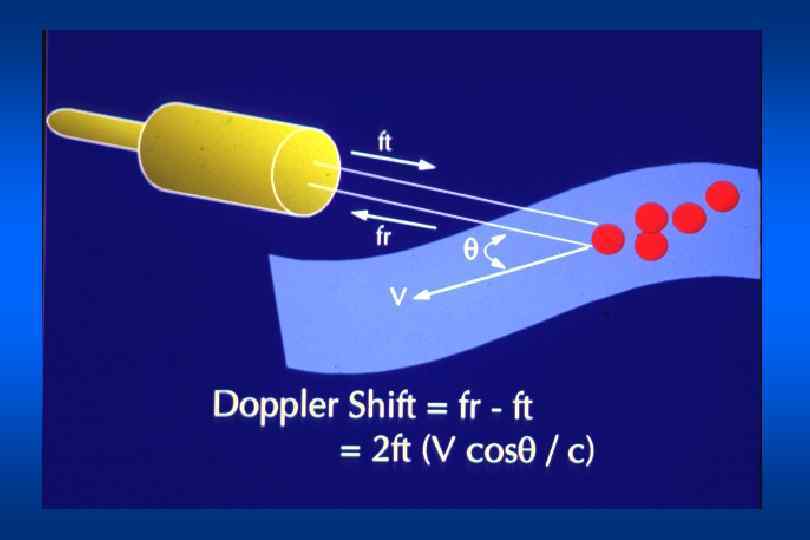
 Doppler shift = f = fr-f 0 = 2 f 0 Vcos /C f 0 = transmitted freq. fr = reflected freq. V = velocity of RBC C = speed of ultrasound in blood
 Zero line
 Laminar flow Turbulent flow Doppler signal
 Doppler • continuous measurement using different element • No depth Pulsed wave(PW)") Continuous wave(CW) Doppler • continuous measurement using different element • No depth Pulsed wave(PW) Doppler • measure velocity at certain depth • sample volume • Low velocity
Continuous wave(CW) Doppler • continuous measurement using different element • No depth Pulsed wave(PW) Doppler • measure velocity at certain depth • sample volume • Low velocity
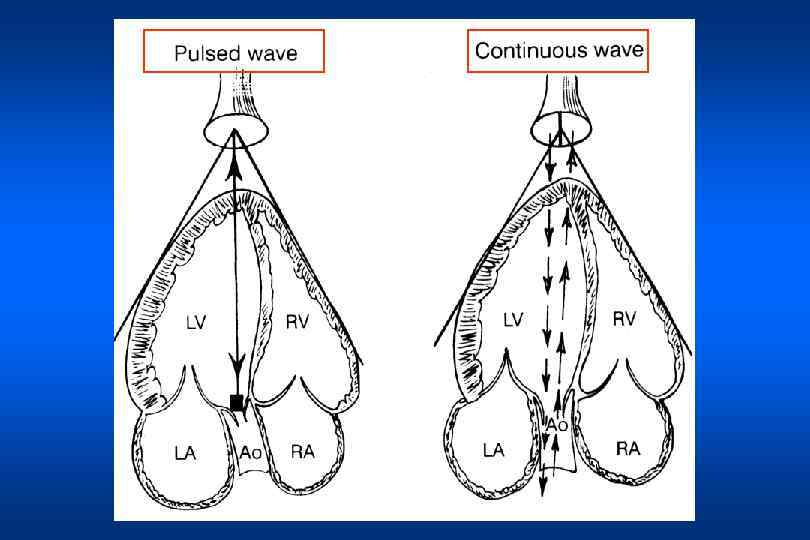
 Continuous Wave Doppler Pulsed Wave Doppler
 Pulsed-wave Continous-wave Measure specific blood flow velocity by placing the “sample volume” at the region of interest Measures blood-flow velocities along the axis of the entire ultrasound beam Maximal measurable velocity without Aliasing is usually < 2 m/s able to measure high velocities < 9 m/s Suited for measuring low velocity at a particular intracardiac location Suited for measuring peak velocities across intracardiac orifices
 Doppler Echocardiography History • 1959 Satomura detected arterial flow • 1961 Franklin measurement of flow velocity • 1973 Johnson located place of cardiac murmur • 1978 Hatle measured PG between LA and LV • 1982 Namekawa real time color Doppler using autocorrelator technique
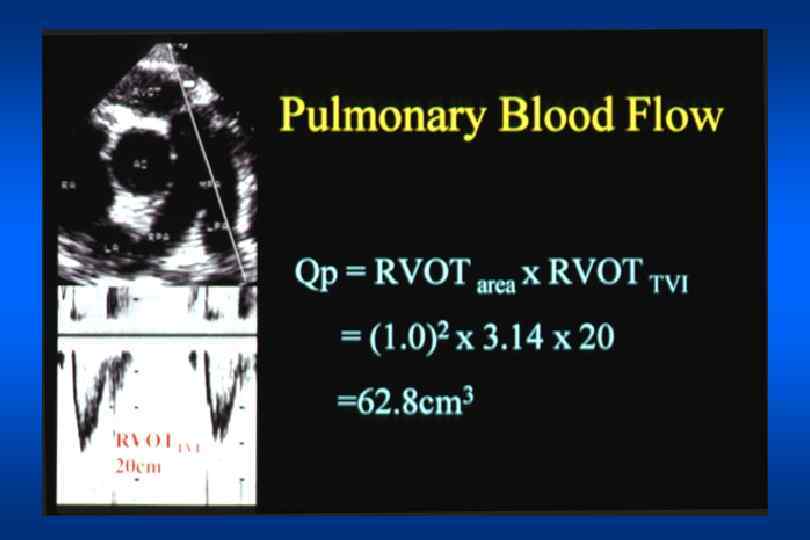
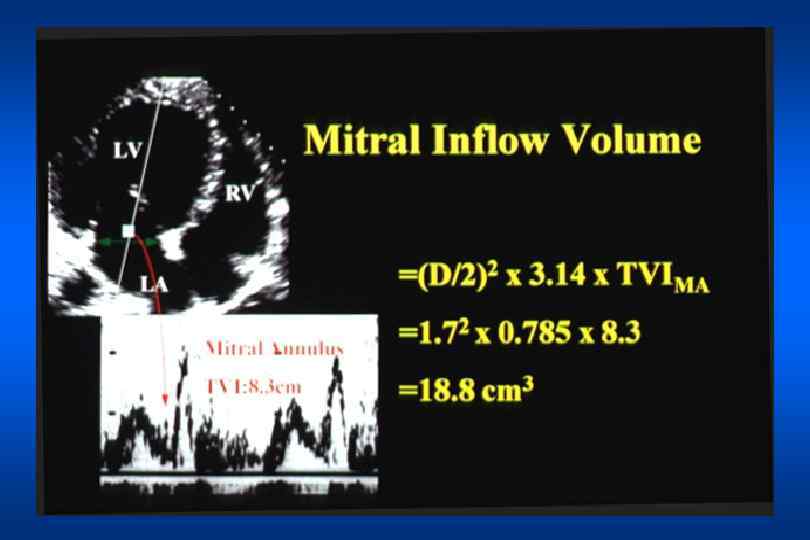
 Hemodynamic data that can be obtained with Doppler echocardiography Volumetric measurements Stroke volume and cardiac output Regurgitant volume and fraction Pulmonary-systemic flow ratio(Qp/Qs) Pressure gradients Maximal instantaneous gradient Mean gradient Valve area Stenotic valve area Regurgitant orifice area Intracardiac pressure Pulmonary artery pressure, LA pressure, LVEDP
 Pressure gradient from Doppler measurements • Pressure gradient • Modified Bernoulli Eq. P = 4 V 2 Limitation of Doppler velocity (and pressure gradient derived thereof) Volume and Rate-dependent
 Time Velocity Integral • Calculate area under the Doppler curve over a specified period of time • Distance(cm) that blood travels with each stroke Normal : aortic TVI 18 - 22 cm mitral TVI 10 - 13 cm
 Area (cm 2) Area x Flow distance = Flow volume") Flow distance(cm) Area (cm 2) Area x Flow distance = Flow volume
Flow distance(cm) Area (cm 2) Area x Flow distance = Flow volume
 • r 2 = 0. 785 x D 2 Normal : aortic") Orifice Area(CSA) • r 2 = 0. 785 x D 2 Normal : aortic annulus 1. 8 – 2. 2 cm mitral annulus 3. 0 – 3. 5 cm
Orifice Area(CSA) • r 2 = 0. 785 x D 2 Normal : aortic annulus 1. 8 – 2. 2 cm mitral annulus 3. 0 – 3. 5 cm
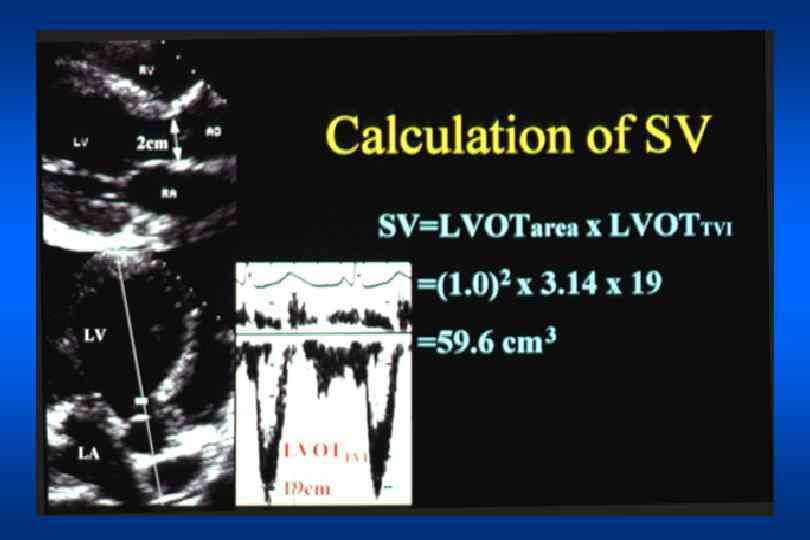
 Stroke Volume TVI x Area
 = TVI(cm) x CSA(cm 2) •") Stroke Volume, Cardiac Output, Cardiac Index • SV(cc) = TVI(cm) x CSA(cm 2) • CO(liters/min) = SV(cc) x HR(beats/min) • CI(liters/min/m 2) = CO(liters/min) x BSA(m 2)
Stroke Volume, Cardiac Output, Cardiac Index • SV(cc) = TVI(cm) x CSA(cm 2) • CO(liters/min) = SV(cc) x HR(beats/min) • CI(liters/min/m 2) = CO(liters/min) x BSA(m 2)
 Estimation of Left Ventricular Enddiastolic Pressure Systemic BP : 160/80 mm. Hg 4 m/s Diastolic BP=LVEDP+(AR enddiastolic velocity)2 x 4 80 mm. Hg= LVEDP + 42 x 4 LVEDP= 80 -64=16 mm. Hg Aortic Regurgitation
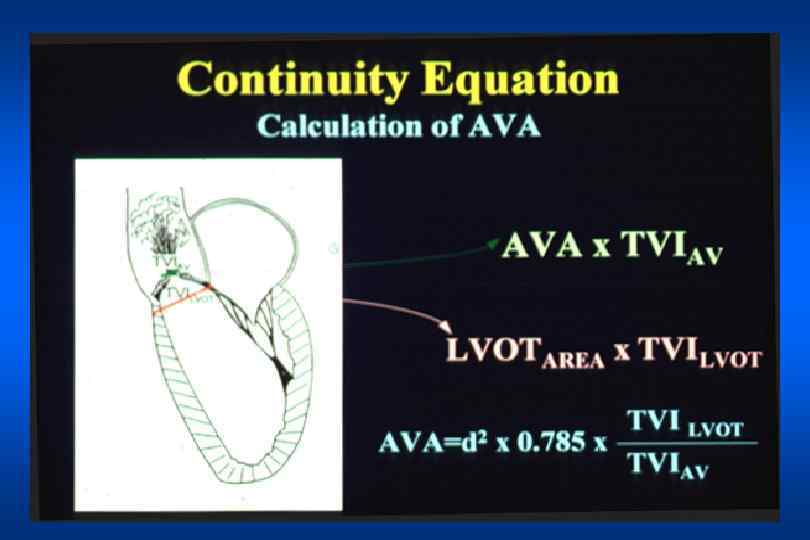
 Continuity Equation Calculation of AVA x TVIAV LVOTAREA x TVILVOT TVI LVOT AVA=d 2 x 0. 785 x TVI AV
 The Reason for Shorter PHT in Severe AR
 CW Doppler of Aortic Regurgitation pressure half time PHT: 200 ms 5 m/s PHT: 540 ms
 Pressure Half Time in MS LV LA Mild MS Severe MS
 Pressure Half Time in MS Vmax 2 m/sec V 1/2 max Vmax = 2 m/s V 1/2 max = Vmax / 1. 4 = 1. 43 m/s PHT MVA PHT: 220 msec = 220/220 = 1. 0 cm 2
 Simultaneous Measurement of Doppler and Catheter Derived Pressures LV PCWP DPG: 9. 6 mm. Hg DPG: 10 mm. Hg
 Pressure = 4 x 2 V
 LV RV RA CS Estimation of RV Systolic Pressure Assume RAP 10 mm. Hg RVSP=(TR)2 x 4+ RAP =32 x 4 +10 =36 + 10 =46 mm. Hg 3 m/sec
2 x 4") Estimation of LA Pressure Blood Pressure = 100/80 mm. Hg Systolic BP=(MR)2 x 4 + LAP 100 mm. Hg= 4. 52 x 4+ LAP=100 -81 =19 mm. Hg 4. 5 m/s
Estimation of LA Pressure Blood Pressure = 100/80 mm. Hg Systolic BP=(MR)2 x 4 + LAP 100 mm. Hg= 4. 52 x 4+ LAP=100 -81 =19 mm. Hg 4. 5 m/s
 Severe Pulmonary Hypertension TR Velocity PR Velocity 3 m/s 4. 5 m/s M-mode of PV
 Estimation of Pulmonary Arterial Pressure Assume RAP 10 mm. Hg TR: 4. 5 m/sec PR: 3 m/se c PASP =TR 2 x 4 + RAP =4. 52 x 4 + 10 =81 + 10 = 91 mm. Hg PADP =PR 2 x 4 + RAP =32 x 4 + 10 =36 + 10 = 46 mm. Hg
 Meaurement of dp/dt
2 + RA") Intracardiac pressures • RV or PA systolic pr. = 4(TR sys. velocity)2 + RA pressure • PA diastolic pr. = 4(PR end diastolic velocity)2 + RA pressure • LA pressure = Systolic BP – 4(MR systolic velocity)2 • RV systolic pr. = Systolic BP – (VSD velocity)2
Intracardiac pressures • RV or PA systolic pr. = 4(TR sys. velocity)2 + RA pressure • PA diastolic pr. = 4(PR end diastolic velocity)2 + RA pressure • LA pressure = Systolic BP – 4(MR systolic velocity)2 • RV systolic pr. = Systolic BP – (VSD velocity)2
 Transmitral Pressure Gradient Mean Pressure Gradient
 Doppler-derived vs Catheter-derived Continuous-wave Doppler peak velocity Aortic Valve Measure velocity at the level of the vena contracta Invasive catheterization Maximum Instantaneous gradient Peak to Peak gradient Different ! Measure the differences between LV and the fully recovered static pressure in the aorta
 Grade 1 : 4 - 8 Grade") Measurement of jet area Jet area(cm 2) Grade 1 : 4 - 8 Grade 2 : 8 - 12 Grade 3 : 12 - 16 Grade 4 : > 16
Measurement of jet area Jet area(cm 2) Grade 1 : 4 - 8 Grade 2 : 8 - 12 Grade 3 : 12 - 16 Grade 4 : > 16
 Quantification of MR - Volumetric method MV Reg V = MV flow – LVOT flow AO LA MV RF = MV Reg V/MV flow x 100 MV Reg V : mitral valve regurgitant volume MV RF : mitral valve regurgitant fraction(%) LV
 Quantification of MR - PISA method r = 1. 1 cm Alias Velocity = 29 cm/sec MR Velocity = 4. 3 m/sec r ERO = 6. 28 (1. 1)2 29 430 RV = ERO MR TVI = 0. 51 114 = 58 ml