b6f526939b291764ee62728380d994fb.ppt
- Количество слайдов: 15
 Height and weight as predictors of achievement, grade repetition and dropout in rural Peru Santiago Cueto Group for the Analysis of Development (GRADE)
 Peru - Study areas
 Longitudinal Design 1998 1999 2000 2001 Ideal progress 4 th grade 5 th grade 6 th grade 1 st grade high school Data collected Baseline (Achievement and Anthropometry) No Achievement Grade in school
 Number of students by grades and situation in 2001 High school Sixth grade First grade Primary school Fourth grade Fifth grade Attending 4 57 Dropout 60 42 16 Total 64 99 163 250 % 458 80% 118 147 Total 20% 576 100%
 Situation of dropouts from 2000 to 2001 Females Males Returned to school 7% 3% Maintained its condition 57% 33% Total 64% 36% Situation n=86
 Age, height, weight of students in 1998 by situation in 2001 Attending Retained Dropouts M SD Height for age -2. 2 a 1. 0 -2. 2 a 0. 9 -2. 3 a 1. 0 Student's age 11. 4 a 1. 7 11. 0 a 1. 5 13. 1 b 2. 1 Weight for age -1. 4 a 0. 8 -1. 4 a 0. 7 -1. 3 a 0. 8 Body mass index 17. 1 a 1. 7 16. 8 a 1. 4 18. 5 b 2. 3 *Means with different superscripts in each group indicate differences are significant (p<0. 05).
 Other Characteristics of the students according to their condition in 2001 Attending Retained M SD Proportion of students who attended preschool 0. 68 a 0. 47 0. 63ª 0. 49 Student’s proficiency in Spanish (3 point scale) 2. 45 a 0. 66 2. 13 b 0. 75 2. 16 b 0. 73 Number of siblings 2. 69 a 1. 34 2. 78 a 1. 43 2. 99ª 1. 63 Number of education books in the house (school texts, dictionaries, tales) 4. 26 a 1. 71 3. 96ª 1. 62 3. 51 b 1. 71 Proportion of the students who live with one or two parents 0. 94 a 0. 25 0. 86 b 0. 35 0. 59 c 0. 49 Father’s education 4. 97 a 3. 35 4. 51ª 3. 09 3. 82 b 2. 86 Mother’s education 2. 73 a 3. 44 2. 57ª 2. 79 1. 65 b 2. 04 Mother uses Spanish to communicate with her child (proportion) 0. 64 a 0. 48 0. 45 b 0. 5 0. 38 b 0. 49 Number of rooms in the house (without bathroom, kitchen, garage) 2. 61 a 1. 55 2. 32 a 1. 45 1. 91 b 1. 23 Time from the house to school (in minutes) 22. 84 a 22. 91 28. 68 a 32. 76 34. 66ª 41. 06 *Means with different superscripts in each group indicate differences are significant (p<0. 05). Dropouts
 Arithmetic test") Scores in Arithmetic test – common items (maximum possible score: 13 points) Arithmetic test (1998) Arithmetic test (2000) Variation (20001998) 4. 3 c 7. 5 b 3. 2 Standard deviation 2. 5 2. 8 N 48 48 5. 0 c 8. 4 b 3. 5 Standard deviation 2. 3 2. 7 N 129 7. 2 a 10. 2 a 3. 0 Standard deviation 2. 7 2. 4 N 222 6. 2 b 7. 9 b 1. 6 Standard deviation 2. 5 3. 3 N 69 69 Grade in 2001 Fourth and Fifth graders Mean Sixth graders High school First graders Mean Dropouts *Tests with different superscripts within each test administrated indicate differences are significant at the 5%.
Scores in Arithmetic test – common items (maximum possible score: 13 points) Arithmetic test (1998) Arithmetic test (2000) Variation (20001998) 4. 3 c 7. 5 b 3. 2 Standard deviation 2. 5 2. 8 N 48 48 5. 0 c 8. 4 b 3. 5 Standard deviation 2. 3 2. 7 N 129 7. 2 a 10. 2 a 3. 0 Standard deviation 2. 7 2. 4 N 222 6. 2 b 7. 9 b 1. 6 Standard deviation 2. 5 3. 3 N 69 69 Grade in 2001 Fourth and Fifth graders Mean Sixth graders High school First graders Mean Dropouts *Tests with different superscripts within each test administrated indicate differences are significant at the 5%.
 Reading comprehension test (1998)") Reading comprehension – common items (maximum possible score: 40 points) Reading comprehension test (1998) Reading comprehension test (2000) Variation (2001998) 12. 3 b 19. 7 c 7. 4 Standard deviation 6. 3 6. 2 N 59 59 13. 5 b 23. 4 b 9. 9 Standard deviation 5. 7 5. 1 N 143 19. 4 a 26. 8 a 7. 3 Standard deviation 6. 2 5. 6 N 239 13. 9 b 21. 0 b, c 7. 1 Standard deviation 6. 5 8. 0 N 78 78 Grade in 2001 Fourth and Fifth graders Mean Sixth graders High school First graders Mean Dropouts *Tests with different superscripts within each test administrated indicate differences are significant at the 5%.
Reading comprehension – common items (maximum possible score: 40 points) Reading comprehension test (1998) Reading comprehension test (2000) Variation (2001998) 12. 3 b 19. 7 c 7. 4 Standard deviation 6. 3 6. 2 N 59 59 13. 5 b 23. 4 b 9. 9 Standard deviation 5. 7 5. 1 N 143 19. 4 a 26. 8 a 7. 3 Standard deviation 6. 2 5. 6 N 239 13. 9 b 21. 0 b, c 7. 1 Standard deviation 6. 5 8. 0 N 78 78 Grade in 2001 Fourth and Fifth graders Mean Sixth graders High school First graders Mean Dropouts *Tests with different superscripts within each test administrated indicate differences are significant at the 5%.
 Results in Reading comprehension and arithmetic tests in 2000 – additional items (maximum possible score: 17 and 29 points respectively) Reading comprehension* Arithmetic* 5. 5 ª 4. 3 b Standard deviation 2. 8 4. 3 N 61 60 5. 3 ª 5. 4 b Standard deviation 3. 0 4. 0 N 144 146 6. 0 a 7. 8 a Standard deviation 3. 1 4. 9 N 248 247 5. 9 ª 5. 9 b Standard deviation 3. 8 5. 8 N 80 85 Grade in 2001 Fourth and Fifth graders Mean Sixth graders High school First graders Mean Dropouts *Tests with different superscripts within each test administrated indicate differences are significant at the 5%.
 Correlation among nutrition variables and achievement ** Correlation significant at 1%, * at 5% (2 tailed)
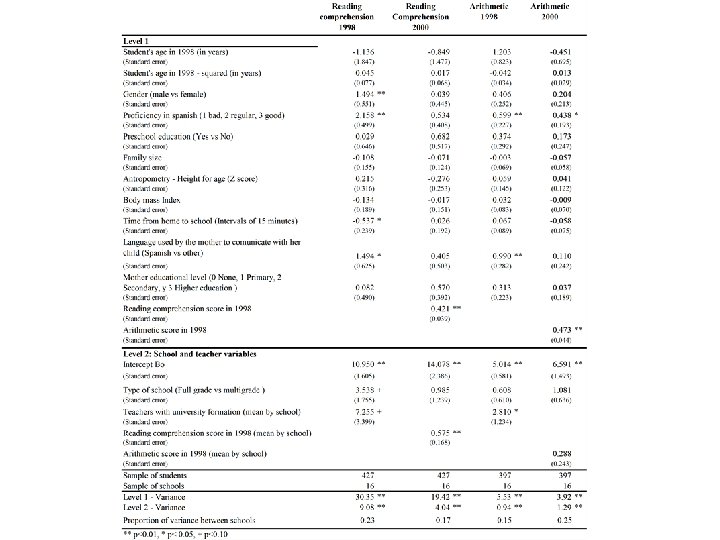
 Hierarchical Linear Model analysis for arithmetic and reading comprehension achievement 1998 and 2000 (common items)
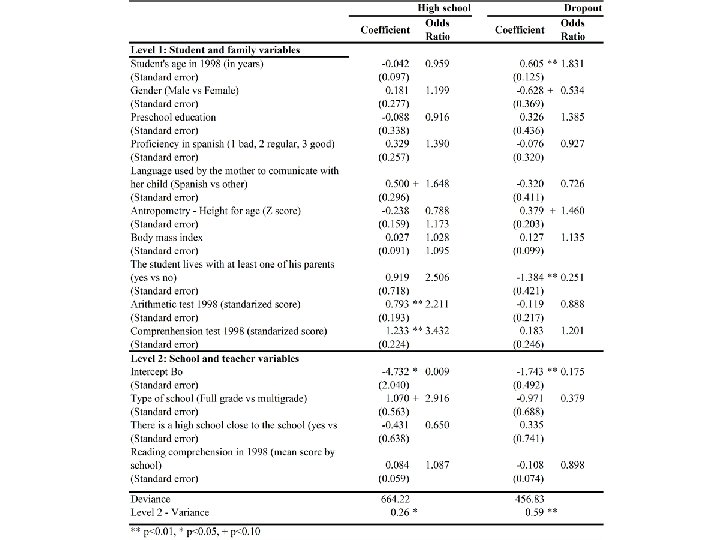
 Hierarchical Generalized Nonlinear Model analysis for pass to high school and dropout