1f08625f4ce3da32a6c5ce260c5db13f.ppt
- Количество слайдов: 33


Health Disparities/ Diabetes Care Sheldon Greenfield, MD Orange County Diabetes Education Collaborative Conference January 31, 2009

Optimizing the ‘Physician Effect’ on Hb. A 1 c levels

Coached Care Team • • • Quyen Ngo-Metzger, MD, MPH Israel De Alba, MD, MPH Dara Sorkin, Ph. D John Billimek, Ph. D Dana Mukamel, Ph. D Community-based Coaches

Background: Disparities in Diabetes Care in the U. S. • More ethnic minorities fail to meet diabetes quality benchmarks than nonminority patients • Rates of diabetes complications are higher among many ethnic minorities • All cause mortality rates are higher among African Americans and Hispanic patients

Purposes of Study • Document disparities in diabetes care among three ethnic groups (Mexicans, Vietnamese, Non-Hispanic Whites) in defined population • Reduce disparities through Coached Care program for improving patients’ participation in care using communitybased patients with diabetes
 • Cross-sectional DAWN Minority Survey (measures development;")
Study Designs • Diabetes Registry (population definition) • Cross-sectional DAWN Minority Survey (measures development; comparison ethnic groups) • Randomized controlled trial (intervention test)

Sampling • Diabetes Registry: – All patients seen for diabetes at UCI Medical Center clinics • Cross-sectional DAWN Minority Survey: – Random sample 300 patients each ethnic group • Randomized controlled trial: – Balanced design, n=100 exp/cont by ethnic group

Optimizing the ‘Physician Effect’ on Hb. A 1 c levels

Features of Coached Care • Algorithm mapping decisions, treatment options; detailed explanations • Patient’s medical record; tailored, personalized information • Reviewed immediately before office visit • ‘Coaching’ for more effective participation during visit

Tailored Algorithm Information: Example, Patient on Insulin Using insulin alone yes Adherence as instructed Problems with insulin regimen no no both OPTIONS yes Change insulin to rapid acting qd Use insulin Pen for administration Stop or reduce insulin; add oral agent Improve diet, exercises

Control Group • Matched for session length • Same venue, same staff • Content = state of the art patient education materials for each disease

PRIOR RESULTS FROM THE COACHED CARE PROGRAM: Health Outcomes • Compared to controls, patients in experimental group had: – 1. 5% reduction in Hb. A 1 c 10 mm Hg reduction in diastolic BP – 25% reduction in symptoms – 30% improvement in functional status –

PRIOR RESULTS FROM THE COACHED CARE PROGRAM: Communication • Compared to controls, patients in experimental group (based on audiotapes): – 3 times more queries, ‘controlling’ conversational behaviors – 2 times more effective in information seeking – 30% increase in emotional response from physicians

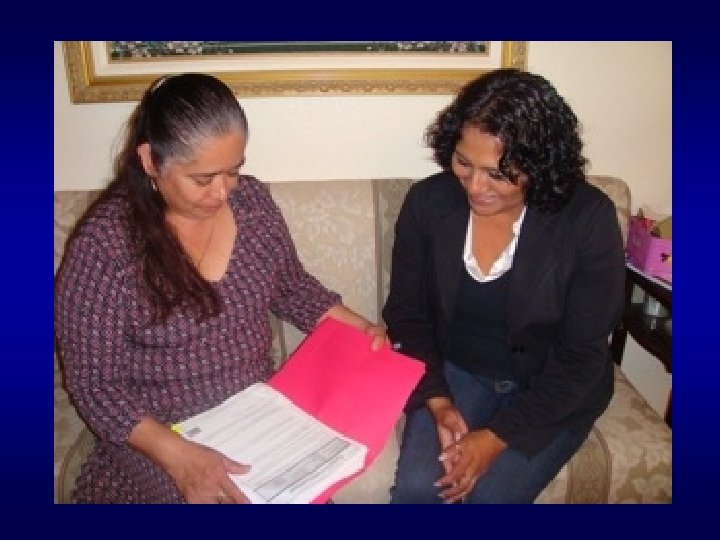
Features of Coached Care for Diabetes Program • Use of community-based ethnic minority coaches • Training program for, quality monitoring of coaches • Use of diabetes registry at UC Irvine to ensure representativeness of patient sampling, assignment

Coached Care for Diabetes Program: DAWN Minority Survey Results

Characteristics of Patient Sample Characteristics Mean Hb. A 1 c Mean LDL Registry (n=3, 894) 7. 6 [1. 5] 96. 1 [28. 6] Survey Sample (n=1001) 8. 3 [1. 8] 103. 2 [33. 0]

Baseline Hb. A 1 c by Ethnicity Ethnic Group White Hispanic Vietnamese F-value = 63. 1, p<. 001 Mean Hb. A 1 c 7. 3 [1. 5] 8. 2 [2. 0] 6. 8 [0. 9]

% Hb. A 1 c <7 by Ethnicity Ethnic Group % Hb. A 1 c <7 White Hispanic Vietnamese Chi Square = 49. 7, p<. 001 54. 8 32. 4 55. 6

DAWN Minority Survey Measures • • General health status Diabetes specific health status Adherence to diabetes regimen Disease management/health enhancing behaviors • Quality of interpersonal care • Access to care • Total Illness Burden

DAWN Minority Survey Measures • General health status – SF-36 – General health distress – WHO – Euro. Qual – CESD – Quality of life – Stress level • Diabetes specific health status – Diabetes management hassles – Diabetes frustration – Diabetes distress – Diabetes worry/concern – Diabetes burden – Stress managing diabetes

Sample Questions: Diabetes Management Hassles “During the past 4 weeks, how much of a problem or hassle has each of the following been for you in your everyday life? ” (A major hassle No hassle at all) h. Having to keep your schedule (eating, drugs, exercise) in mind all the time…. .

Sample Questions: Diabetes Frustrations “Sometimes diabetes can be a source of frustration to those who have it. During the past 4 weeks, how often: (All of the time None of the time) a. Were you frustrated about diabetes? . .

Sample Questions: Diabetes Worries or Concern “Sometimes people with diabetes have concerns about complications that may develop. How much are you worried or concerned about each of the following? ” (Extremely worried Not worried at all) a. Losing my eyesight from diabetes? . .

Sample Questions: Diabetes Burden “Overall, how much of a burden is your having diabetes on you and your family in each of the following areas? ” (Very great burden No burden at all) a. Our finances in general? . . b. Our finances due to the cost of my medications? ….
 (n=502) (n=283) Mean Diff")
Ethnic Differences: Survey Measures Whites Hispanic Vietnamese General health (n=216) (n=502) (n=283) Mean Diff P-value SF-36 PFI 10 65. 4 65. 1 57. 3 <. 01 SF-36 Role Physical 67. 1 69. 9 53. 9 <. 01 WHO 55. 8 57. 1 54. 4 . 331 Euro. Qual 2. 1 2. 7 . 381 CESD 10. 7 12. 2 13. 9 <. 01 Measure:
 (n=502) (n=283) Mean Diff P-value Hassles")
Ethnic Differences: Survey Measures Whites Hispanic Vietnamese (n=216) (n=502) (n=283) Mean Diff P-value Hassles 35. 6 36. 3 30. 5 <. 01 Frustrations 33. 9 43. 3 44. 4 <. 01 Worry/concern 48. 9 68. 8 46. 6 <. 01 Burden 31. 0 50. 5 32. 7 <. 01 Management stress 36. 1 47. 8 37. 2 <. 01 Measure: Diabetes health

Correlation Health Status Measures with Hb. A 1 c Health status measures SF-36 PFI 10 SF-36 Role physical WHO Euro. Qual Diabetes Hassles Diabetes Frustration Diabetes Worry/Concern Diabetes Burden DM Management Stress ***p<. 001 Hb. A 1 c. 01. 04 -. 03. 17***. 18***. 25***. 27***. 21***

Coached Care for Diabetes Program: DAWN Minority Trial Results

Mean Hb. A 1 c Preliminary Results Study Period Control N Coached Care Mean Diff Baseline 244 8. 2 8. 4 0. 2 6 months 159 8. 1 8. 3 0. 1 12 months 112 7. 7 8. 3 0. 6* *p<. 05

Hb. A 1 c >8% Preliminary Results Study Period Control N Coached Care Mean Diff Baseline 125 9. 4 0. 0 6 months 64 9. 0 8. 9 -0. 1 12 months 38 7. 9 9. 4 1. 6* **p<. 01

Conclusions • Coached Care may improve diabetes outcomes among poor and ethnic minorities • Despite disparities in diabetes care at baseline, Coached Care improved Hb. A 1 c, diabetes health status across ethnic groups • Community-based coaches of same culture can be trained; less expensive
1f08625f4ce3da32a6c5ce260c5db13f.ppt