d15d0cdf670d8c1080d9c6895fcfaff9.ppt
- Количество слайдов: 36


Harnessing grazing systems to be more profitable Dr Michael O’Donovan Teagasc, Animal & Grassland Research and Innovation Centre, Moorepark, Fermoy, Co. Cork michael. odonovan@teagasc. ie

Industry overview • Target of 50% expansion by 2020 • Increase S. R (1. 8 2. 5 cows/ha) • Increase grass growth (9 t DM/ha 12 -16 t DM/ha) • Cost to produce 1 t DM of ryegrass = € 76 • Approximate value of grass grown € 2 billion • Key to system Dairy cows grazing ‘high quality’ grass to achieve high levels of performance
 No land cost (€/t")
Grass as a feed is competitive! Total costs (€/t UDM) No land cost (€/t UDM) €/1000 UFL Relative to grass PRG 2. 5 LU/ha (80% utilised) 75 42 73 1. 00 PRG 2 LU/ha (75% utilised) 78 40 76 1. 04 PRG 1. 65 LU/ha (60% utilised) 104 47 107 1. 47 First cut silage (6. 0 t DM/ha) 185 156 230 3. 15 Purchased Rolled Barley 188 - 162 2. 22 PRG – perennial ryegrass UDM – Utilisable Dry Matter Source: Finneran (2010)

Key Performance Indicators for Resilient Systems Based on 2012 statistics Current Average 6 - 8 75* Current Top 10% 10 - 16 80* Target Herd EBI (€) 6 week herd calving rate (%) 100 55 140 70* >200 90 Grass utilisation (tons DM/ha) Milk solids (kg/ha) 7. 0* 665 9. 0* 850 14. 0 1, 400 25* - 40 40 - 80 80 - 100 - 150 Pasture growth (t DM/ha) Pasture Quality (% OMD) Nitrogen use efficiency (%) Cows per labour unit (No. /LU) 12 - 20 85 *estimates based on available information

Alignment of Grass Supply & Animal Requirements 4. High milk productivity (1, 250 kg MS/ha) 3. Long grazing lactation (285+ days) 2. Environmentally efficient 1. 90% home grown feed Compact calving high fertility status dairy herd 285+ DIM

Identifying the stocking rate for a resilient system Previous stocking rate studies have highlighted the biologically optimum SR t supplement DM/cow Pasture grown, t 12 14 2. 0 2. 3 0. 00 10 1. 5 0. 25 1. 7 2. 1 2. 4 2. 8 0. 50 1. 8 2. 2 2. 5 3. 0 0. 75 1. 9 2. 3 2. 7 3. 1 1. 00 2. 4 2. 9 3. 2 1. 25 2. 1 2. 5 3. 0 3. 4 1. 50 2. 2 2. 6 3. 1 3. 5 *All of these stocking rates equate to 85 kg live weight/t feed DM available. 16 2. 6

The Grazing Season Spring Turnout to April Main season April – August Autumn September to Closing (Spring rotation planner) (Wedge) (Autumn budget)

Increased Grass Production and Utilisation Perennial ryegrass/white clover pasture Increased grass production/ utilisation Soil P, K & p. H Grazing management Grazing infrastructure
 Example SRP for a 40 ha dairy farm")
Using the Spring Rotation Plan (SRP) Example SRP for a 40 ha dairy farm with 100 dairy cows Week Rotation Daily area (days) (ha/day) 1 st to 7 th Feb 15 th to 21 st Feb 22 nd 8 th to to 28 th 14 th Feb Mar 22 nd to 28 th Mar 29 th Mar to 4 th Apr Total area grazed by week end (%) 100 0. 4 7 82 0. 49 23 73 0. 55 33 56 0. 72 56 38 1. 06 90 29 1. 38 114 For the plan to be successful • Stick to the planned area • Post-grazing residual 3. 5 cm • Use a strip wire on a 12 -hour basis. • Grazing area should be back fenced • On/Off grazing is essential in wet weather.

Early grazed sward Early Grazing Effects on Sward Characteristics Early grazed sward Late grazed sward

Spring Grazing Research • Spring grass remains the highest quality feed post calving – optimise it • Spring – overgrazing (<3. 5 cm) reduces total DM production by 1. 2 t DM/ha (8%) graze to 3. 5 cm • No benefit to grazing beyond 3. 5 cm • On/off grazing - 30% increase in regrowth

Grazing Mid Season • Graze swards at 3 leaves - 1200 -1600 kg DM/ha • Grazing lighter covers (<1200 kg DM/ha) can reduce total DM production by up to 40% • More supervision and more requirement for intervention with supplements when grazing light covers • Higher covers (>1600 kg DM/ha) more difficult to graze – increased post grazing height and poorer quality • Higher covers reduce milk solids production in Autumn Managing swards at a pre grazing yield of 1200 – 1600 kg DM/ha strikes the balance between animal production and sward management efficiency

Spring Grazing Principles Ryegrass supports 3 actively growing leaves - maximum average growth rate - high in sugar and nutritionally balanced To achieve 2. 5 - 3 leaves - Slow 1 st rotation (100 days) - Rapid 2 nd & subsequent rotations (21 days) High Autumn Covers (>1, 200 kg DM/ha) should be grazed before Mid-march Herbage mass Regrowth curve Approximately 25, 35 and 40% of total final yield comes from the 1 st, 2 nd and 3 rd leaf Leaf 3 - 40% Leaf 2 - 35% Leaf 1 - 25% Time

Increased Grass Production and Utilisation Perennial ryegrass/white clover pasture Increased grass production/ utilisation Soil P, K & p. H Grazing management Grazing infrastructure

Farm Infrastructure • Roadways • Cow paths • Multiple entrances to paddocks • Water troughs • Land improvement

Farm infrastructure - land improvement • 21% of soils in Ireland are characterised as having impeded drainage (gley soils) • Impeded drainage leads to: • Lower grass production • Shorter grazing season length • Increased poaching • Reduced nutrient use efficiency

Heavy Land Poaching 50 % Reduction in DM Production

Effect of poaching damage on herbage production on dry and wet soils Damage event Dry land – March grazing Subsequent rotation 30% Reduction Annual DM production No Effect Wet land - April grazing Zero regrowth ↓ 34% Wet land - October Zero regrowth ↓ 19% Wet land - April and October Zero regrowth ↓ 50%

Increased Grass Production and Utilisation Perennial ryegrass/white clover pasture Increased grass production/ utilisation Soil P, K & p. H Grazing management Grazing infrastructure

Agronomy – Growing more higher quality feed Soil fertility status & nutrient management planning Currently only 11% of dairy soil samples are of satisfactory status S. Lawlor; Irish Dairy Industry Statistics, Teagasc 2014

Increased Grass Production and Utilisation Perennial ryegrass/white clover pasture Increased grass production/ utilisation Soil P, K & p. H Grazing management Grazing infrastructure

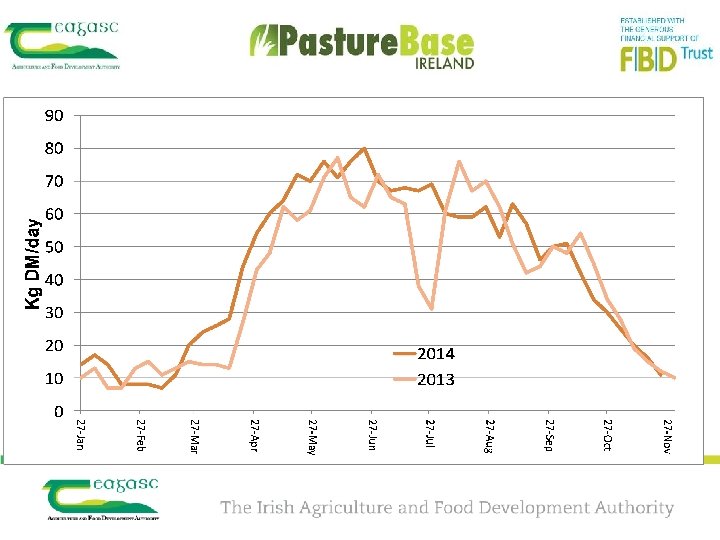
Seasonality of Grass DM Production as influenced by Perennial Ryegrass content

Perennial Ryegrass Swards • Higher DM production – especially spring • More nutrient efficient - more responsive to Nitrogen (+ 24%) • Faster regrowth • Increased carrying capacity & utilisation • PRG + Clover – 1 -2 t DM/ha

13. 0 11. 1 12. 1 10. 6 10. 4 10. 8 14. 9 13. 4 18. 8 15. 4 12. 1 15. 1 11. 6 12. 3 12. 1 13. 7 17. 5 11. 2 17. 1 13. 2 14. 9 11. 2 14. 3 15. 2 14. 111. 2 10. 5 15. 1 14. 4 13. 7 13. 1 14. 1 18. 1 13. 9 15. 7 16. 8 16. 9 13. 7 11. 2 16. 3 17. 0 13. 3 12. 0 15. 9 13. 014. 6 12. 1 16. 7 12. 4 14. 2 13. 1 16. 4 12. 7

Pasture Base Ireland Farms DM Production

Spring grazing yield and its association with total grazing DM production

Association between number of grazings achieved and grazing DM Production

What are high producing farms doing ? • High Soil fertility – Index 3, Ph >6. 0 • Routine measurement and proactive management • Low variation between highest and lowest paddocks • Spring grazing • All paddocks contributing • More grazings per farm • Reseeding part of management

Pasture Profit Index • Total merit index developed to assist in cultivar selection • Assigns an economic value to important traits • Define the total economic merit of a cultivar (€ per ha per year) • Rank cultivar's on Total Economic Merit • Traits of importance: • Seasonal DM yield • Quality • Silage DM Yield • Persistency
 – Test Proof Pasture Profit Index Details Variety Details Rank")
Pasture Profit Index (PPI) – Test Proof Pasture Profit Index Details Variety Details Rank PPI Sub-Indexes (€ per ha per year) DM yield Total €/ha per year Spring Summer Autumn Variety Ploidy Heading date Aber. Gain T 5 June 234 49 54 Dunluce T 28 May 232 56 Aberchoice D 9 June 198 Kintyre T 6 June Aber. Magic D Magican Silage Quality Persistency 63 14 60 -7 51 78 13 35 0 23 58 65 -3 55 0 176 29 45 76 2 25 0 29 May 175 48 57 101 1 13 -45 T 20 May 170 57 38 61 17 -3 0 Navan T 5 June 162 23 50 73 -1 25 -7 Trend T 23 May 149 24 47 49 27 2 0 Delphin T 1 June 148 21 52 52 11 12 0 Aspect T 5 June 146 26 51 49 -1 28 -7 Drumbo D 7 June 139 26 41 53 -16 36 0 Carraig T 23 May 135 39 47 57 19 -20 -7 Solomon D 21 May 127 63 38 55 10 -31 -7 Abercraigs T 4 June 120 13 44 40 8 16 0 Twymax T 6 June 106 -11 54 39 6 26 -7 Tyrella D 3 June 102 45 33 39 -9 -6 0
 – Test Proof Pasture Profit Index Details Variety Details Rank")
Pasture Profit Index (PPI) – Test Proof Pasture Profit Index Details Variety Details Rank Variety Ploidy Heading date Mezquita D 6 June Glenveagh D 2 June Majestic D 2 June Paccadilly D 3 June Stefani D 1 June Clanrye D 5 June Aberplentiful T 7 June Boyne D 22 May Seagoe T 28 May Rosetta D 23 May Giant Rodrigo T D 19 May 26 May PPI Sub-Indexes (€ per ha per year) DM yield Total €/ha per year Spring Summer Autumn 59 15 41 34 Silage Quality Persistency -6 -25 0

Pasture Profit Index - Summary • Emphasis is now be placed on key traits • Large difference between varieties • Difference is derived from their agronomic performance • More traits will be added to the index • PPI will be published within Recommended list • 95% of variety’s available will have a PPI value in 2015

New Grassland Developments 2015 -2025 • Target 16 -18 t grass/ha grown • Grass breeding- genomic selection • Pasture base Ireland - Improving grazing management on farm - On farm grass evaluation - Grass growth prediction (forward grass supply) • Pasture Profit Index - varieties for grazing • Clover persistence in grazing swards • Precision Grassland - automated measurement

Conclusions • Outlook & profit potential for well managed dairy systems is excellent • Future expanded industry health dependant on milk from grazing • Expanding dairy farm businesses must have a resilient strategy • Agronomic practices to maximise grass DM production • An appropriate overall farm SR to utilise produced DM • A high fertility/compact calving easy care dairy cow • Excellent business & tactical management skills

Acknowledgements Dairy Levy – Irish Dairy Farmers Grassland Farmers on Pasture base Ireland Department of Agriculture, Food and the Marine staff Department of Agriculture Fisheries & Food Research Stimulus Fund (RSF 11/S/09)
d15d0cdf670d8c1080d9c6895fcfaff9.ppt