

dfc9b9fb944b7ddafacbb0c8e8979277.ppt
- Количество слайдов: 24
 HAARP-induced Ionospheric Ducts Gennady Milikh, University of Maryland in collaboration with: Dennis Papadopoulos, Chia-Lee Chang, BAE systems Evgeny Mishin, AFRL/RVBXI, Hanscom AFB Michel Parrot, LPCE/CNRS, France Joe Huba, NRL Andrei Demekhov, IAP, N-Novgorod, Russia Conference on Dynamical Processes in Space Plasma , Israel, April, 2010
 Motivation • Naturally induced field aligned irregularities of the plasma density exhibit enhanced refractive indices and act as ducts that guide waves in the whistler range between the two hemispheres. • HF heating of the ionosphere creates density perturbations that may propagate into the plasmasphere, thus produce artificial ducts.
 Objectives • To present the observations of the density perturbations caused by the HF-heating of the ionosphere by HAARP and detected by Demeter and DMSP satellites. • To check the observations against a model of the artificial ducts due to HF-heating of the ionosphere.
 Demeter observations of the daytime artificial ducts 10/16/09 f=5. 1 MHz, O-mode CW, Magn. Zen. 04/24/07 f=3. 2 MHz O-mode 0. 1 Hz Magn. Zen. No electrojet 4
 Kodiak radar diagnostics HF-heating 5
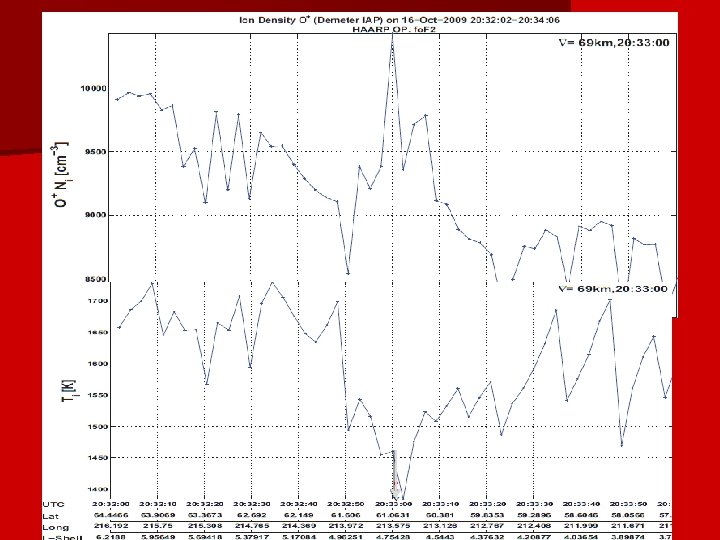
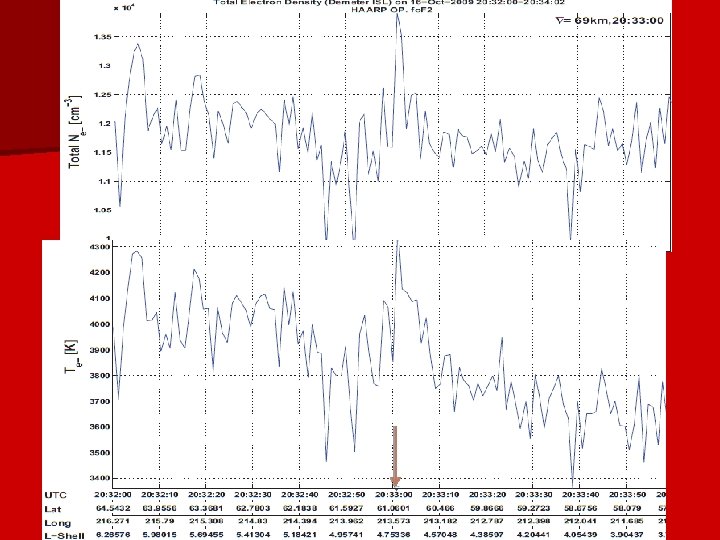
 Daytime artificial ducts are narrow (the width in N-S direction is") Daytime Measurements (summarizing) Daytime artificial ducts are narrow (the width in N-S direction is under 100 km), and relatively weak (N i, e and Ti, e perturbations are under 10%). Thus they can be detected only from a close overfly. The artificial ducts required a strong HF-heating which produces the ionospheric perturbations, such as observed by Kodiak. To generate such perturbations the heating frequency should be close to MUF. 8
Daytime Measurements (summarizing) Daytime artificial ducts are narrow (the width in N-S direction is under 100 km), and relatively weak (N i, e and Ti, e perturbations are under 10%). Thus they can be detected only from a close overfly. The artificial ducts required a strong HF-heating which produces the ionospheric perturbations, such as observed by Kodiak. To generate such perturbations the heating frequency should be close to MUF. 8
 Demeter observations of the nighttime artificial ducts 10/21/09 f=2. 8 MHz, O-mode CW, Magn. Zen. 04/24/07 f=3. 2 MHz O-mode 0. 1 Hz Magn. Zen. No electrojet 9
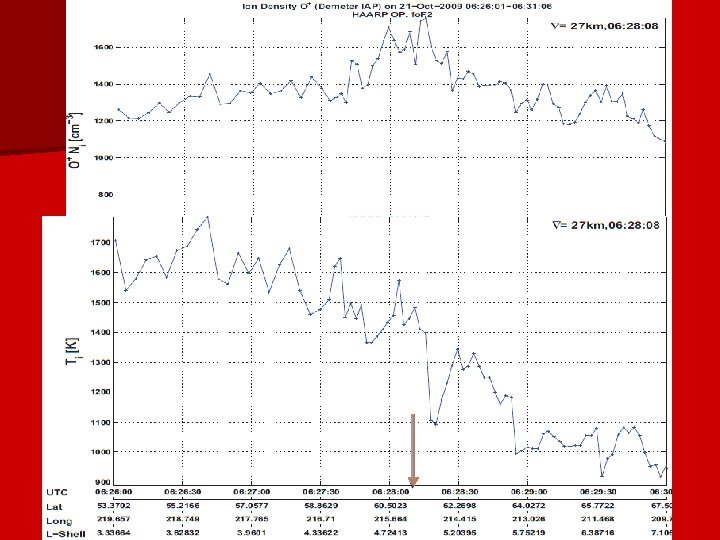
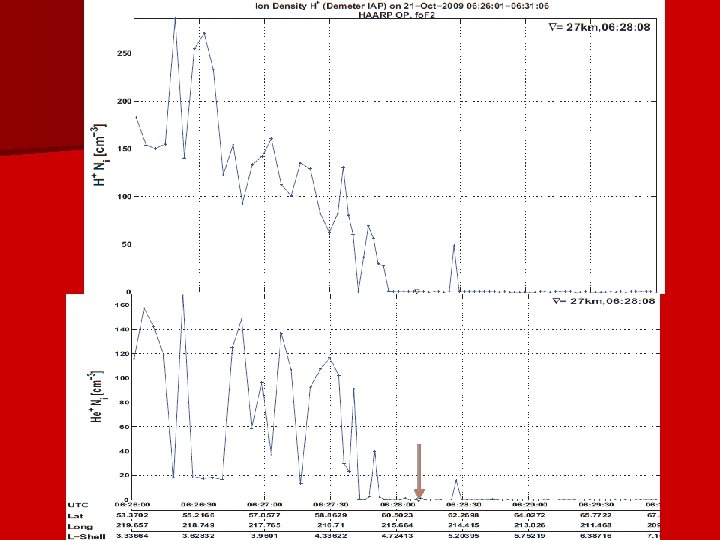
 • Nighttime artificial ducts broader than daytime (the width reaches 200") Nighttime Measurements (summarizing) • Nighttime artificial ducts broader than daytime (the width reaches 200 km), and Ni, e and Ti, e perturbations reach 80%. Detectable even at few hundred km distances from the HAARP MZ. • Outflow of O+ ions pushes H+ and He+ upward – artificial polar wind. 12
Nighttime Measurements (summarizing) • Nighttime artificial ducts broader than daytime (the width reaches 200 km), and Ni, e and Ti, e perturbations reach 80%. Detectable even at few hundred km distances from the HAARP MZ. • Outflow of O+ ions pushes H+ and He+ upward – artificial polar wind. 12
 The model of artificial ducts in the ionosphere • It is based on the SAMI 2 model of the ionosphere [Huba, et al. , 2000] which describes evolution of the ionospheric plasma confined by a bunch of the geomagnetic field lines. • The SAMI 2 model was modified, namely a flexible local source of the electron HF-heating was introduced in the form of the localized heating rate per electron:
 Model Validation of the numerical model of ducts by comparison with two well documented experiments: The first experiment was conducted at the EISCAT facility and diagnosed by the EISCAT Incoherent Scatter Radar, which measured the vertical profiles of the electron and ion temperature between 150 - 600 km. The second experiment was conducted at the SURA facility, and used DEMETER satellite as a diagnostic tool to measure the ion density along the overflying satellite orbit close to the magnetic zenith of the HF-heater. 14
 EISCAT EXPERIMENT EISCAT HF facility is located near Tromso, Norway (69 o. N, 19 o. E) Experiments conducted on 10/7/99 [Rietveld et al. , JGR, 2003] Heater operated at 4. 5 MHz, ERP=205 MW under quiet ionospheric conditions. Major diagnostic tool: UHF ISR. 15
 The absorption efficiencies=0. 16, 0.") Comparison with the EISCAT experiment (model has been adjusted) The absorption efficiencies=0. 16, 0. 32 and 0. 64. 16
Comparison with the EISCAT experiment (model has been adjusted) The absorption efficiencies=0. 16, 0. 32 and 0. 64. 16
 SURA EXPERIMENT SURA HF facility located near Nizny Novgorod, Russia (56 o. N, 46 o. E). Experiment conducted on 05/01/06 [Frolov et al. , Radiophys. @ Quantum Electronics, 2008] under quiet ionospheric conditions. The heater operated at 4. 3 MHz, O-mode, magnetic zenith, ERP=80 MW. Ground-based diagnostics was provided by ionosonde. 17
 and 0. 25 (red), crosses") Comparison with the SURA experiment Absorption efficiencies=0. 14 (blue) and 0. 25 (red), crosses - observations. 18
Comparison with the SURA experiment Absorption efficiencies=0. 14 (blue) and 0. 25 (red), crosses - observations. 18
 In summary, the modified model of ducts reproduces observations with high accuracy, which establishes it as a key tool for the study of the artificial ionospheric modifications. 19
 Demeter observations of the nighttime artificial ducts 02/12/10 f=2. 8 MHz, O-mode, CW, MZ 20
 Focusing of HF waves by ducts
 The strong signal was detected between 6: 30: 37 – 6: 30: 47 shown by arrows
 Theory of focusing of HF waves by ducts i. e. forming a focusing lens Expanding n and r by powers of 2 we obtain the focusing distance Lens Magnification: 23
 Conclusions • Artificial ducts due to the ionospheric heating was detected by the Demeter satellite during daytime & nighttime. • Modified SAMI 2 model provides quantitative predictions of the ducts. • HF focusing by ducts propagation was detected. A theoretical model of HF-focusing was developed.