Greenhouse Production in Industry HORT 359 Greenhouse Environment






greenhouse_production_in_industry.ppt
- Размер: 2.6 Mегабайта
- Количество слайдов: 45
Описание презентации Greenhouse Production in Industry HORT 359 Greenhouse Environment по слайдам
 Greenhouse Production in Industry HORT 359 Greenhouse Environment & Construction
 Background and History • From early times the interest of having “out of season” fresh vegetables and green plants was what drew colonists, Europeans & Roman to attempt hothouses. • About 500 BC, Romans in Pompei utilized “mica “ sheets (known today as Eising Glass) to create a lean-to type of structure for the forcing of plants with hot water heat ducts in the wall to grow grapes & cucumbers.
 Background and History • In the 1600 -1700 AD the Dutch and English used glass roof set at a 45 o angle to capture the rays of the sum. • Thomas Jefferson and George Washington had what were called “orangeries” included in their estates. Some of these had lean-to roofs and others had large vertical palladian windows facing a south exposure. • John Bartram in 1737 visited Col. Byrd of Va. and reported that Col. Byrd had a greenhouse well furnished with orange trees.
 Background and History • American orangeries had a stone wall as the back wall, with large wood burning stoves that heated the wall by way of air tunnels that permitted hot air and smoke to travel from one end to the other. • Had a lean-to glass roof which kept citrus trees ripening, fresh asparagus in March and peas in December. • The first use of hot water for heating plants was mentioned in the “New England Farmer” in 1831.
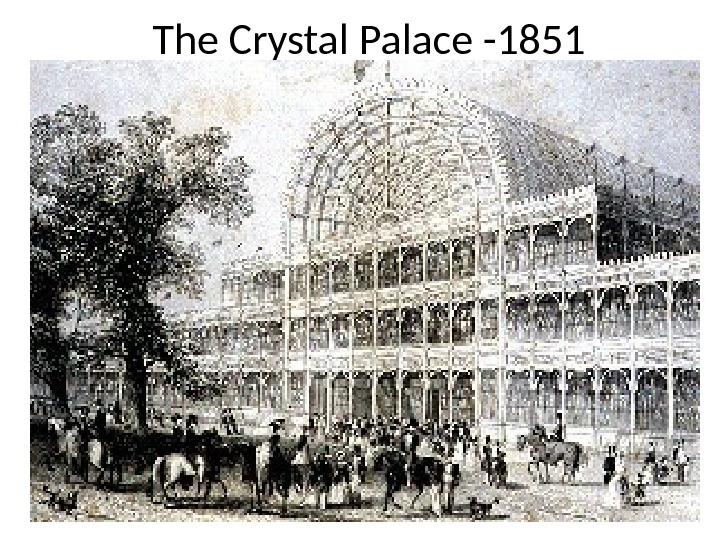
 Background and History • The British Exposition was held in 1851 in London. • John Paxton built what was called The Crystal Palace. • It covered over 17 acres, 456’ x 1848’ • It was the largest building anyone had ever seen in the Victorian Age… took 7 months to build.
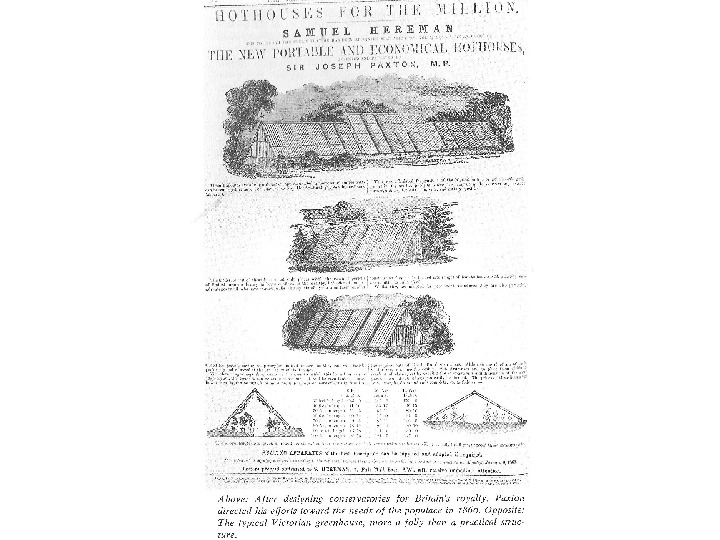
 Background and History • This Crystal Palace was constructed using wrought iron and glass and served as a model for greenhouses to come. • Unfortunately this structure was torn down when the exposition was over. • Paxton went on to design conservatories for British royalty and went on to design Victorian greenhouses
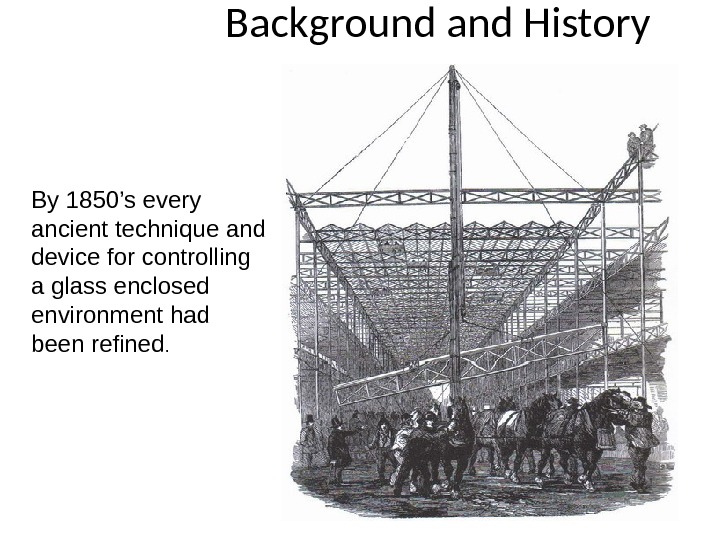
 Background and History By 1850’s every ancient technique and device for controlling a glass enclosed environment had been refined.
 The Crystal Palace —

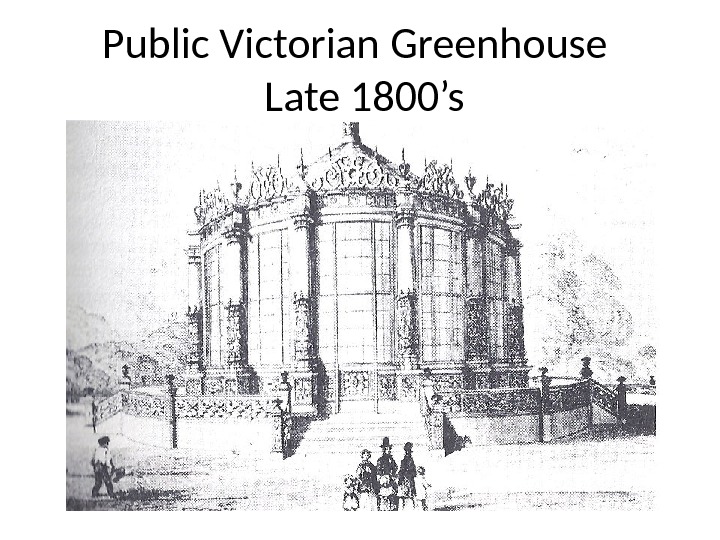
 Public Victorian Greenhouse Late 1800’s
 Background and History • Fredrick A. Lord and William A Burnham introduced the use of gas fired boilers to pipe hot water heat through and along the walls of the greenhouse to distribute the heat more evenly. • The year? 1856 • Today Lord and Burnham greenhouses are considered one of the top quality greenhouse manufacture’s
 Modern Lord & Burnham Greenhouse
 History of Greenhouse Heating Methods • In Iceland, natural underground hot springs have been utilized for centuries as a free source of heat in huge greenhouses. Still grow table crops including tomatoes & bananas. • Today we employ similar concepts with “geothermal” heat
 Greenhouse History • In Russia in 1801, Czar Alexander I, built three parallel greenhouses in St. Petersburg, each 700 ‘ long and connected at their ends. Sections for tropical plants and fruits towered 40’ high. • Heated by furnaces fed with birch wood.
 Background and History • With the advent of modern transportation – trucks, rail & airplanes the number of acres of greenhouses increase dramatically. • Flowers and fresh vegetables are now grown in many overseas places and shipped into the colder winter climates of Europe and North America.
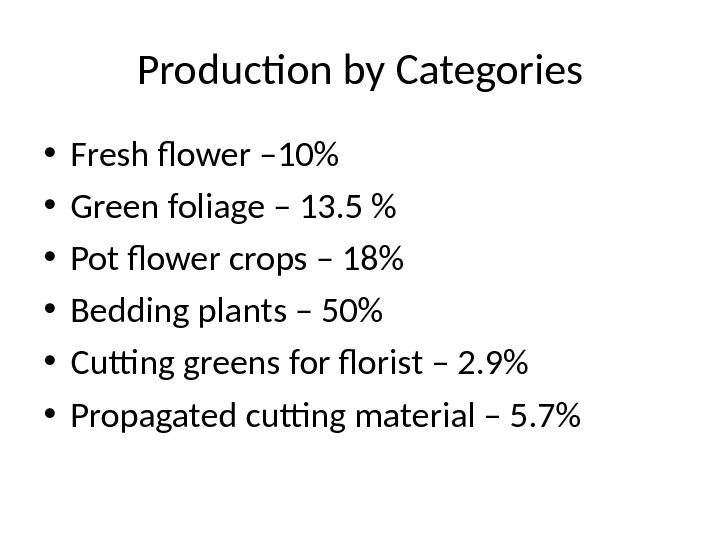
 Production by Categories • Fresh flower – 10% • Green foliage – 13. 5 % • Pot flower crops – 18% • Bedding plants – 50% • Cutting greens for florist – 2. 9% • Propagated cutting material – 5. 7%
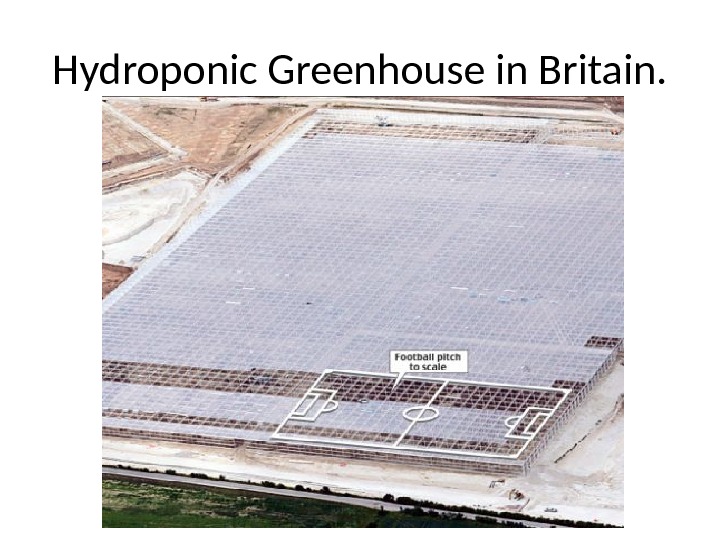
 Hydroponic Greenhouse in Britain.
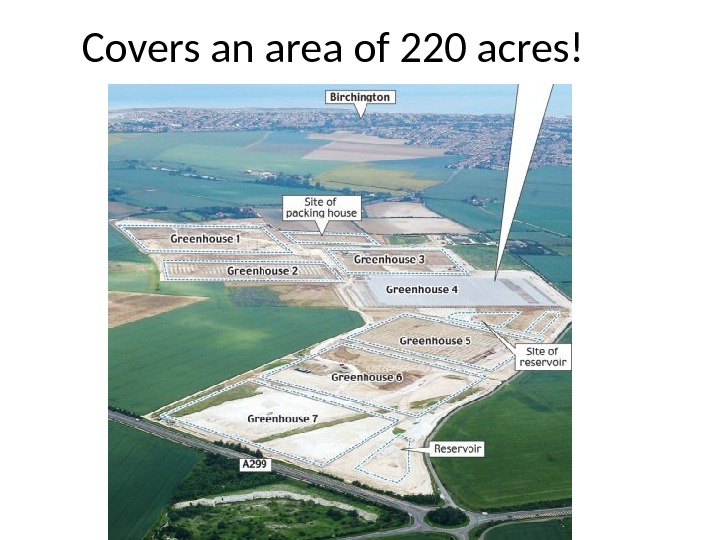
 Covers an area of 220 acres!
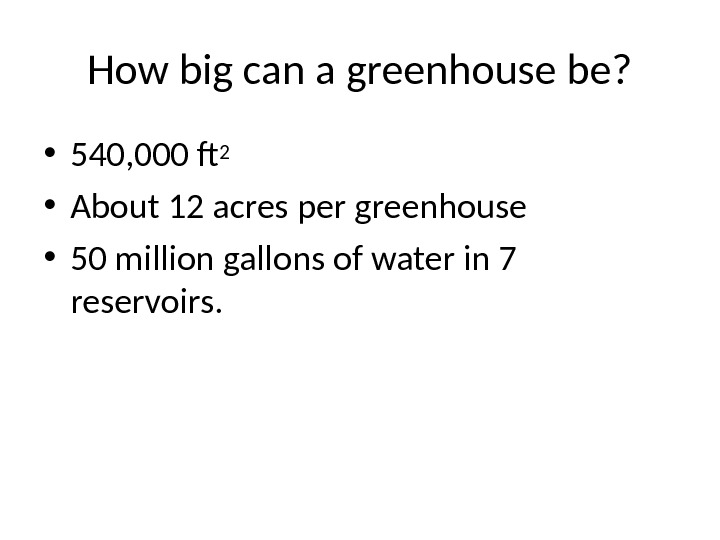
 How big can a greenhouse be? • 540, 000 f 2 • About 12 acres per greenhouse • 50 million gallons of water in 7 reservoirs.
 Anticipated Vegetable Production From the Total British Project • 2. 5 million tomatoes/week • 560, 000 peppers/week • 700, 000 cucumbers/week • It is estimated that it will increase Britain’s salad production by 15%
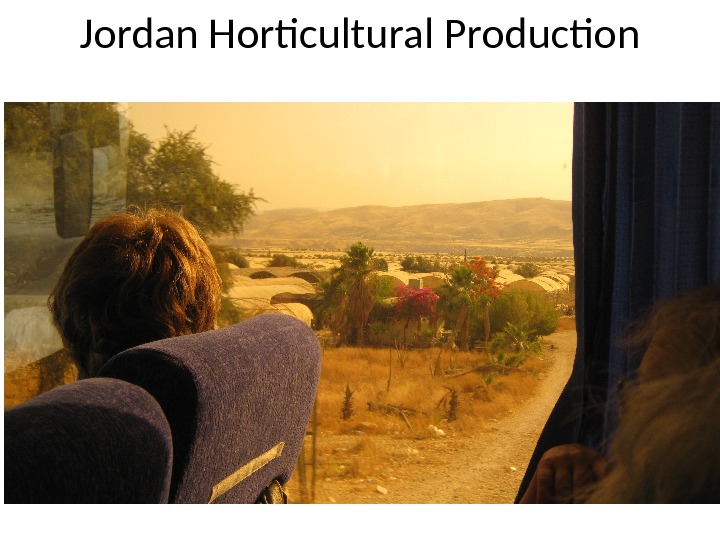
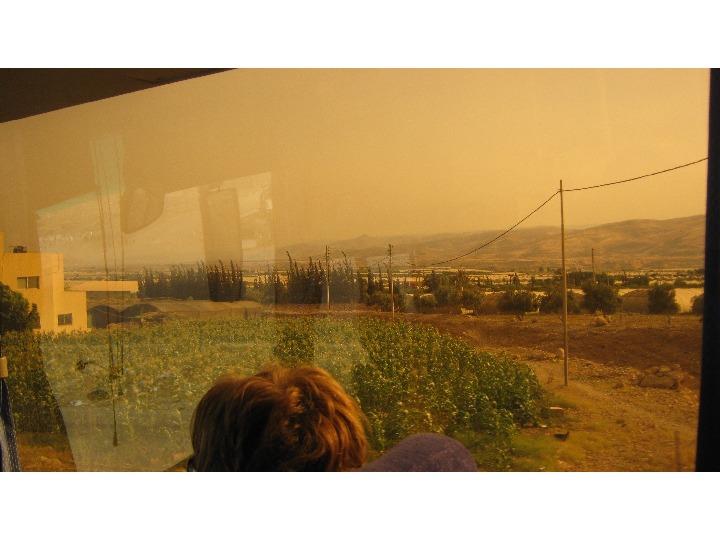
 Jordan Valley • Hundreds of acres covered with hoop plastic houses, raise predominantly vegetables shipped to surrounding Arab countries. H 20 the greatest challenge for them. • Strawberries grown along the Mediterranean under glass forced for year around production & shipped to Russia, the Netherlands, Switzerland Scandinavia… by Jordanian entrepreneurs.
 Jordan Horticultural Production

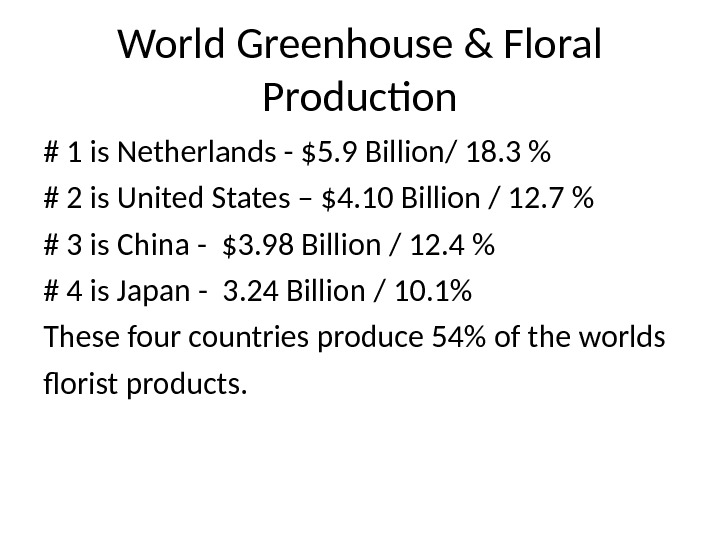
 World Greenhouse & Floral Production # 1 is Netherlands — $5. 9 Billion/ 18. 3 % # 2 is United States – $4. 10 Billion / 12. 7 % # 3 is China — $3. 98 Billion / 12. 4 % # 4 is Japan — 3. 24 Billion / 10. 1% These four countries produce 54% of the worlds florist products.
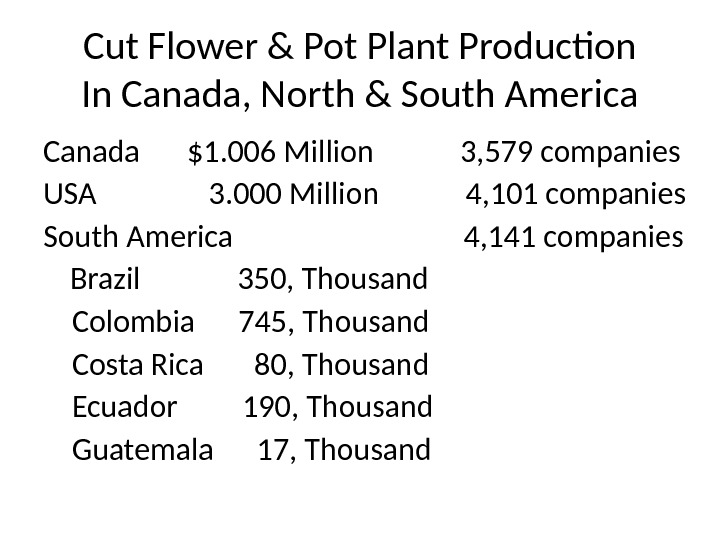
 Cut Flower & Pot Plant Production In Canada, North & South America Canada $1. 006 Million 3, 579 companies USA 3. 000 Million 4, 101 companies South America 4, 141 companies Brazil 350, Thousand Colombia 745, Thousand Costa Rica 80, Thousand Ecuador 190, Thousand Guatemala 17, Thousand
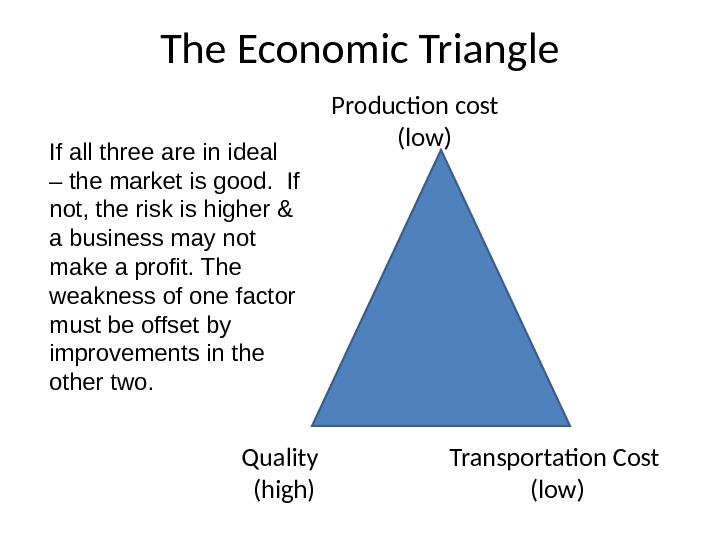
 The Economic Triangle Production cost (low) Quality Transportation Cost (high) (low) If all three are in ideal – the market is good. If not, the risk is higher & a business may not make a profit. The weakness of one factor must be offset by improvements in the other two.
 East Coast of U. S. • Earliest growers were in Massachusetts, Connecticut, New York & Long Island, Philadelphia, Pa. — these were the largest population centers in early times. First produced Carnations & Roses. • Ready market available, close by for deliveries • Most of these were started up by immigrants from Holland or Europe – new advances in Greenhouse technology lowered costs. • Next wholesale distribution channels grew so a retail industry tapped the wholesalers.
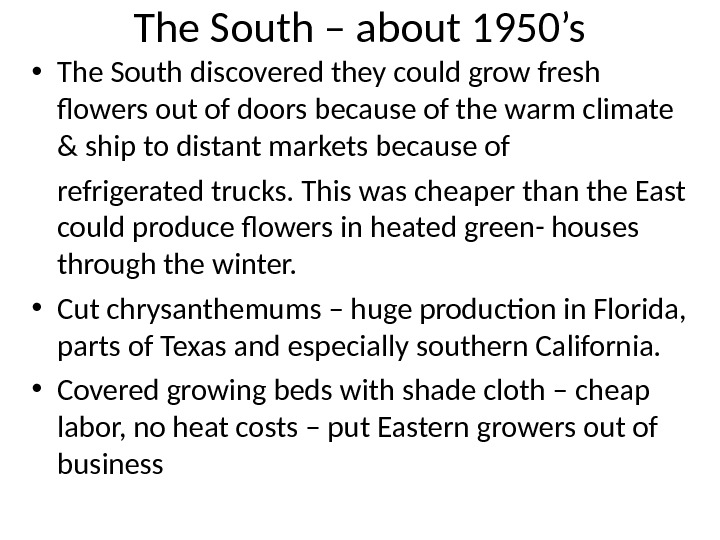
 The South – about 1950’s • The South discovered they could grow fresh flowers out of doors because of the warm climate & ship to distant markets because of refrigerated trucks. This was cheaper than the East could produce flowers in heated green- houses through the winter. • Cut chrysanthemums – huge production in Florida, parts of Texas and especially southern California. • Covered growing beds with shade cloth – cheap labor, no heat costs – put Eastern growers out of business
 Production, Transportation, Quality • Quality of Southern grown mums was not as good as those grown in the North especially with spray type mums (pom poms & daisy types) • The north converted to Standard mums & upped the quality to compete for a time.
 Colorado Greenhouse Production • Carnations are suited to cool temps. – high light Colorado has both at high altitude. • The south can’t produce Carnations without a lot of cooling costs, so Colorado found a niche that others could not create so easily. • Also grew roses for awhile but heating costs in winter couldn’t compete with California where no heating costs were required.
 California • Climate permitted growing roses and other flowers without heating costs as well as cheap labor of migrants. • California made such inroads into the market as to displace production on the East coast altogether. In the 1950’s-60’s there were a lot of air flights west but fewer travelers back east which created inexpensive floral shipments east • Refrigerated trucks also are a major shipping source today. The Grapes of Wrath
 Foreign Imports • The industry changed dramatically again around the year 2000 – became a world market. • Overseas Europe and South America began to compete heavily with our U. S. grown markets. • Today most of American fresh cut flowers come from Holland South America. Bogata, Colombia has a high altitude and long daylength of 12 hrs. a day near the equator year around. • Mild temps in the 70 o’s favor mums, roses and carnations. – now have 66% of US market in roses 76% of all cut mums and 25% carnation market.
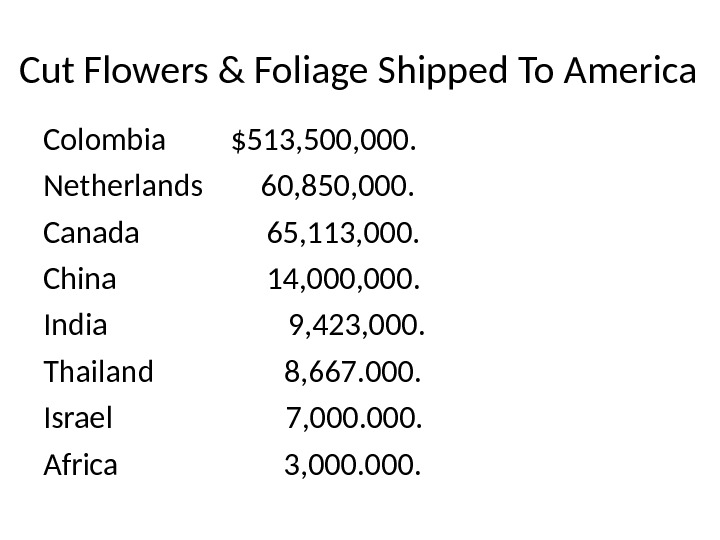
 Cut Flowers & Foliage Shipped To America Colombia $513, 500, 000. Netherlands 60, 850, 000. Canada 65, 113, 000. China 14, 000. India 9, 423, 000. Thailand 8, 667. 000. Israel 7, 000. Africa 3, 000.
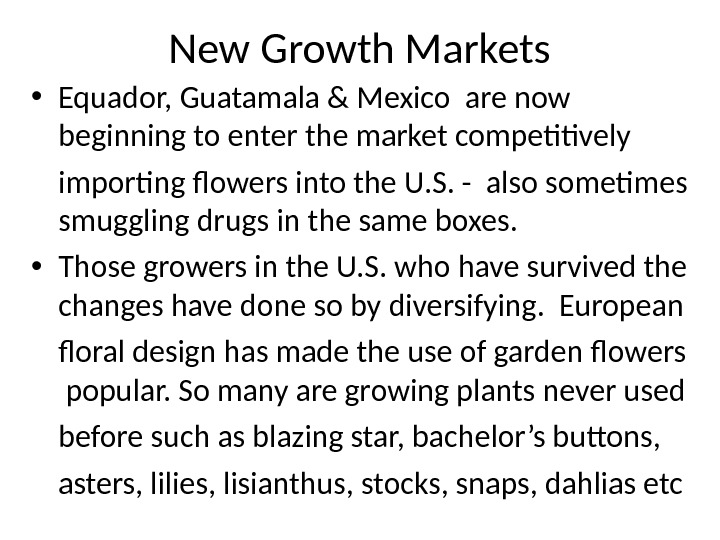
 New Growth Markets • Equador, Guatamala & Mexico are now beginning to enter the market competitively importing flowers into the U. S. — also sometimes smuggling drugs in the same boxes. • Those growers in the U. S. who have survived the changes have done so by diversifying. European floral design has made the use of garden flowers popular. So many are growing plants never used before such as blazing star, bachelor’s buttons, asters, lilies, lisianthus, stocks, snaps, dahlias etc
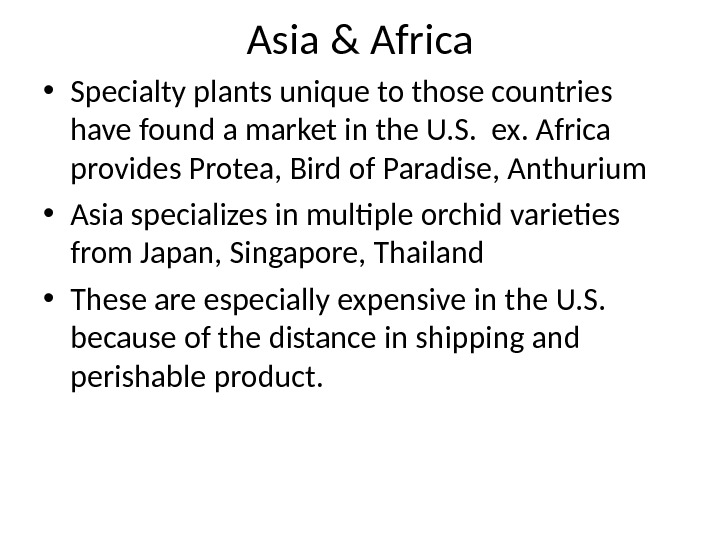
 Asia & Africa • Specialty plants unique to those countries have found a market in the U. S. ex. Africa provides Protea, Bird of Paradise, Anthurium • Asia specializes in multiple orchid varieties from Japan, Singapore, Thailand • These are especially expensive in the U. S. because of the distance in shipping and perishable product.
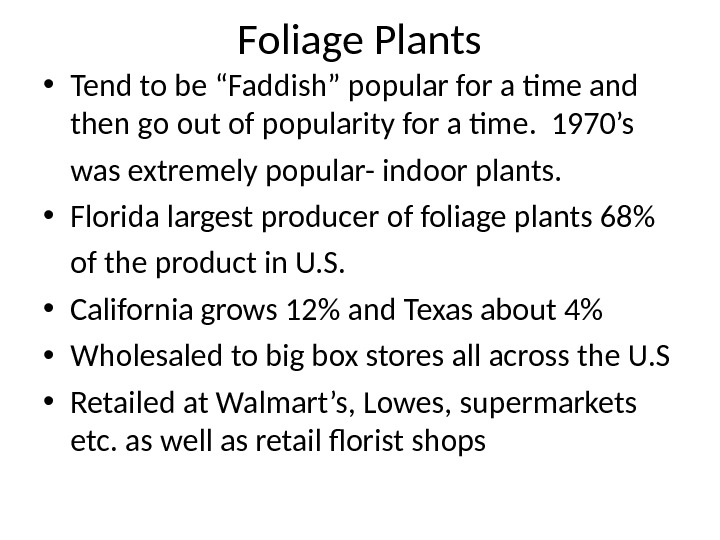
 Foliage Plants • Tend to be “Faddish” popular for a time and then go out of popularity for a time. 1970’s was extremely popular- indoor plants. • Florida largest producer of foliage plants 68% of the product in U. S. • California grows 12% and Texas about 4% • Wholesaled to big box stores all across the U. S • Retailed at Walmart’s, Lowes, supermarkets etc. as well as retail florist shops
 Flowering Pot Plants • Holiday plants such as Poinsettias, Easter lilies, Hydrangeas, spring bulbs, Azalea’s, Rieger Begonias, Kalanchoes, Africa Violets, Pouch Flower, Gloxinia’s, pot Mums, Cyclamens, Cineraria’s etc. • Holiday plant trend is upward, Most imported holiday plants into U. S. is coming out of Canada or about $7. 2 million annual sales. • 18% is being grown in the U. S.
 Bedding Plants • Bedding plants are a very large part of plant production in U. S. 50% of all flower production. • This market continues to grow because of the interest in colorful home landscapes and growing a more diverse number of annuals & perennials – ie. maturation of a society. • Wholesalers grow plug sizes, Middle man grows them to sale size and or retails them. • Today much of this production from seeding to sale size is automated.
 Vegetable Production • For the same reasons – vegetable plant production has grown tremendously in the U. S. • In tough economic times more people want to learn how to grow vegetables & want buy plant starts off the shelf. • Organic has become fashionable – so people want to grow their own for more control over their food. • Heirloom varieties are hugely popular – people have discovered that many of the old varieties had more flavor and are more exotic than hybrids
 Changes in Florist Market • The traditional Florist may soon be a thing of the past in the U. S. • Big box stores have florist shops built in & work in volume/chainstore. Independent florist shop cannot compete. • Customers can order “nearly wholesale” in quantity direct – from suppliers like Sam’s Club. cutting out the middle man for parties, weddings, etc. – shipped directly to your door. • Convenience / impulse buy shops may survive as seen in Europe, Russia etc. in metro areas.
 Future Markets • Advertising has been lacking in florist industry traditionally only spends 1% of gross sales • On Line advertising, websites, facebook etc. is where young people go today. • Diversification, finding a niche market or being ahead of a trend is the best market strategy today. • Customer convenience, personal service, a diversity of product, high quality can demand a above average price without complaint.
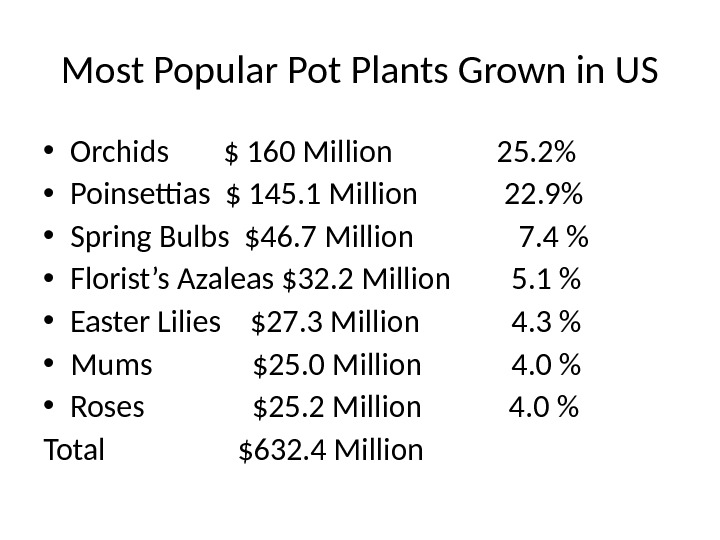
 Most Popular Pot Plants Grown in US • Orchids $ 160 Million 25. 2% • Poinsettias $ 145. 1 Million 22. 9% • Spring Bulbs $46. 7 Million 7. 4 % • Florist’s Azaleas $32. 2 Million 5. 1 % • Easter Lilies $27. 3 Million 4. 3 % • Mums $25. 0 Million 4. 0 % • Roses $25. 2 Million 4. 0 % Total $632. 4 Million
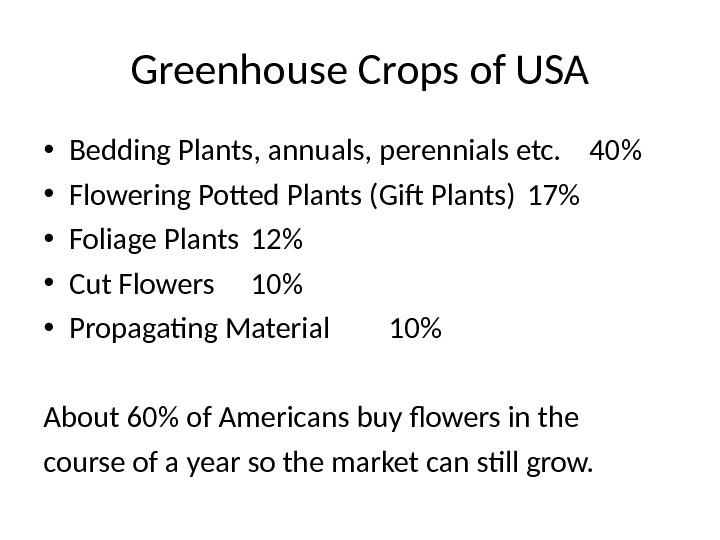
 Greenhouse Crops of USA • Bedding Plants, annuals, perennials etc. 40% • Flowering Potted Plants (Gif Plants) 17% • Foliage Plants 12% • Cut Flowers 10% • Propagating Material 10% About 60% of Americans buy flowers in the course of a year so the market can still grow.
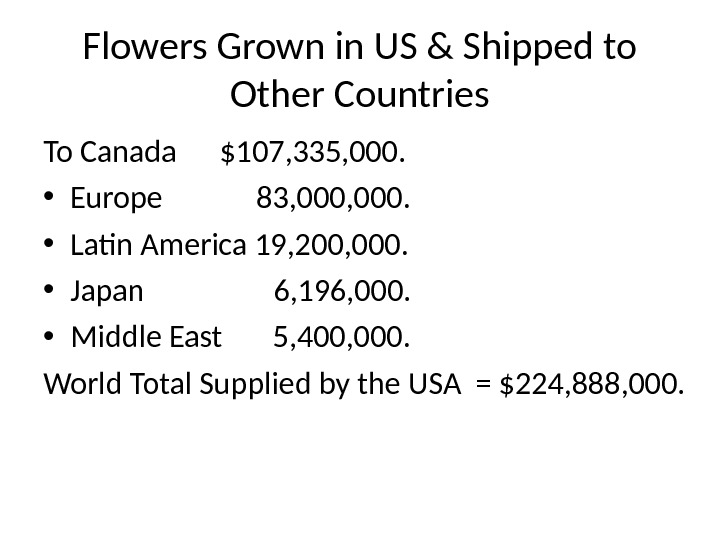
 Flowers Grown in US & Shipped to Other Countries To Canada $107, 335, 000. • Europe 83, 000. • Latin America 19, 200, 000. • Japan 6, 196, 000. • Middle East 5, 400, 000. World Total Supplied by the USA = $224, 888, 000.
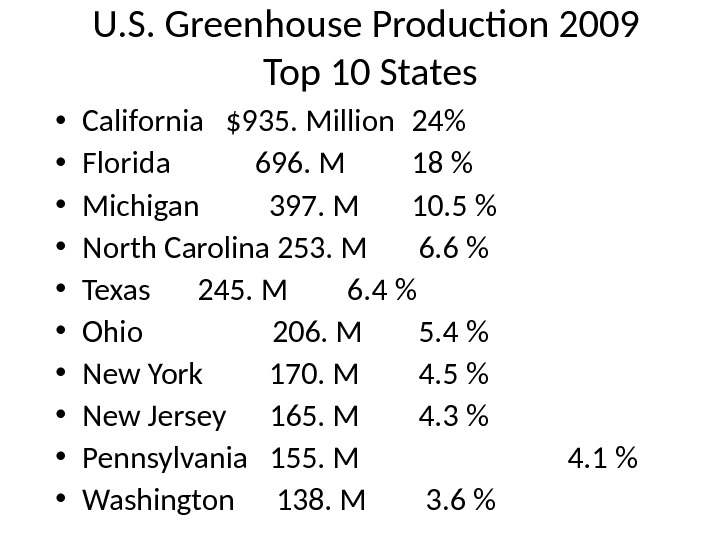
 U. S. Greenhouse Production 2009 Top 10 States • California $935. Million 24% • Florida 696. M 18 % • Michigan 397. M 10. 5 % • North Carolina 253. M 6. 6 % • Texas 245. M 6. 4 % • Ohio 206. M 5. 4 % • New York 170. M 4. 5 % • New Jersey 165. M 4. 3 % • Pennsylvania 155. M 4. 1 % • Washington 138. M 3. 6 %

