6dbdaef975b0560fdaca019f95423b4d.ppt
- Количество слайдов: 125


Green Jobs: Safety & Health Outlook for Workers and Small Employers Sanji Kanth, Safety Engineer Office of General Industry Enforcement Directorate of Enforcement Programs April 1, 2010

Panel Members Ø Don Ellenberger Environmental Hazard Training Director CPWR – The Center for Construction Research and Training Ø Michele Myers Manager of Labor, Health and Safety Policy American Wind Energy Association Ø Justin August, CIH Industrial Hygienist Covanta Energy Corporation

Session Overview Ø OSHA’s green job efforts and discuss workplace hazards associated with green jobs. Ø Information on green processes and technologies that are incorporated into the construction, energy, and waste management and recycling industries. Ø Opportunities and challenges posed by green jobs. Ø Best practices and strategies for small businesses in reducing safety and health hazards associated with green jobs.

What are Green Jobs? Ø No Widely Accepted Definition Ø Jobs Related to Preserving or Restoring Environment or Natural Resources Ø Bureau of Labor Statistics (BLS) Seeking Comments on the Green Jobs Definition http: //edocket. access. gpo. gov/2010 -5705. htm

Green Jobs Industry Categories Ø Renewable Energy Ø Ø Ø Energy Efficiency Greenhouse Gas Reduction Pollution Reduction and Cleanup Recycling and Waste Reduction Agricultural and Natural Resources Conservation Education, Compliance, Public Awareness, and Training

Renewable Energy Ø Ø Ø Ø Wind Solar Biomass/Bio. Fuel Geothermal Tidal Energy Hydrogen Fuel Cells Other Renewable Sources

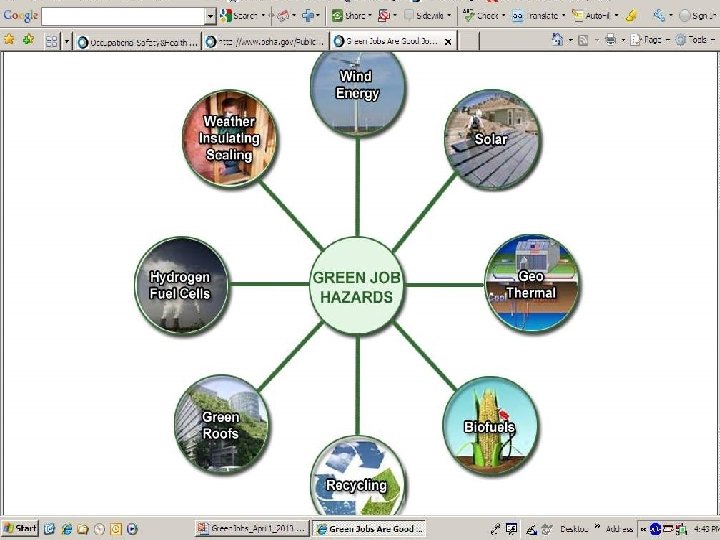
Green Jobs Hazards Ø Ø Ø Ø Ø Falls Confined Spaces Fires Lockout/Tagout Medical and First Aid Crane, Derrick and Hoist Safety Electrical Machine Guarding Respiratory Protection, and Other Typical Workplace Hazards

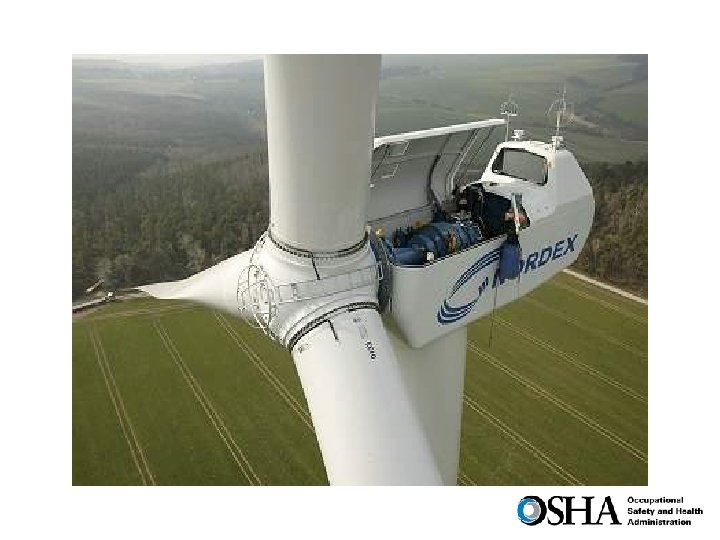
Wind Energy Hazards Ø Falls Ø Confined Spaces Ø Lockout/Tagout Ø Crane, Derrick and Hoist Safety Ø Electrical Ø Machine Guarding Ø Other Typical Workplace Hazards Picture Source: http: //simplifiedsafety. com/solutions/application/wind-turbine/

Wind Turbine Blade Manufacturing

Sanding & Grinding
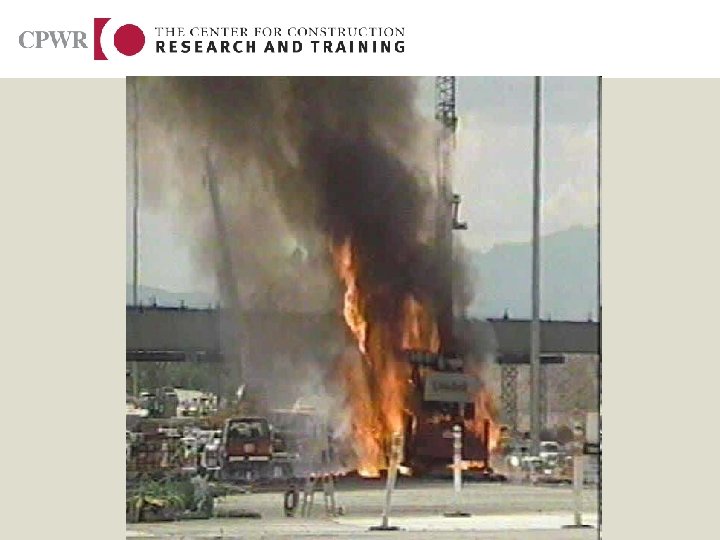
 Ø Fire Hazards Ø Medical and First Aid Source:")
Wind Energy Hazards (contd. ) Ø Fire Hazards Ø Medical and First Aid Source: http: //www. windaction. org/pictures/1054

Solar Panel Installation/Removal Hazards Ø Ø Fall Hazards Electrical Hazards Heat/Cold Stress Hazards Installing/Removing Photovoltaic Products containing Cadmium Telluride (carcinogen) Picture Source: http: //www. coshnetwork. org/sites/default/ files/OSEIA_Solar_Safety_12 -06. pdf

Solar Energy Accidents Source: http: //www. cdph. ca. gov/programs/ohb/Pages/New. aspx#solar

http: //www. coshnetwork. org/sites/default/files/OSEIA_Solar_Safety_12 -06. pdf
 Ø Chemical Hazards")
Weatherization and Insulation Hazards Ø Use of Spray Polyurethane Foam (SPF) Ø Chemical Hazards Isocyanates Ø Confined Space Hazards Ø Fall Hazards Ø Fire Hazards Ø Medical and First Aid Ø Electrical Hazards

Bio. Fuel Hazards Ø Fire and Explosion hazards Ø Chemical Reactivity hazards Ø Toxicity hazards Ø Other Hazards Picture Source: http: //www. nunukphotos. com/biofuels-photos. html

Waste Management and Recycling Ø Ø Ø Ø Ø Collection Traffic Safety Ergonomics Lead Mercury Precious/Rare Metals Machine Guarding Lockout/Tagout Cardboard Baling

Geo. Thermal Hazards Ø Ø Ø Trenching Excavations Silica Electrical Welding and cutting Fall protection Picture Source: http: //www. ecogeek. org/component/content/article/2988 -usgovernment-surpasses-google-for-geothermal-fund
 Related Hazards Ø")
Green Roof Hazards Ø Fall Protection Ø Personal Protective Equipment (PPE) Related Hazards Ø Exposure to Silica dust Ø Crane Derrick and Hoist Ø Powered Industrial Trucks Ø Electrical Ø Heat/Cold Stress Picture Source: http: //www. ecogeek. org/content/view/902 /

Hydrogen Fuel Cell Hazards Ø Fire and Explosion Hazards Ø Electrical Hazards Ø Other Typical Workplace Hazards

OSHA Green Jobs Safety Web Page • Greens Jobs Web Site • OSHAPedia

OSHA Green Jobs Safety Web Page Ø Industry specific hazards Ø OSHA standards applicable to the hazards Ø OSHA resources addressing the hazards Ø Accident Information Ø Other outside resources

Future Plans Ø Monitor Injury/Illness trends Ø Continuously Improve the Web Page on Green Jobs in providing necessary resources to employers and workers

“Green jobs are good jobs only when they are safe jobs. ” -- David Michaels, Ph. D, MPH December 16, 2009


Green Jobs: Safety & Health Outlook for Workers A View from under the Hard Hat Don Ellenberger, Environmental Hazard Training Director April 1, 2010 Frances Perkins Building Auditorium U. S. Department of Labor Washington, D. C.

n n n Insulators & Asbestos Workers Boilermakers Bricklayers Carpenters Plasterers & Cement Masons Electrical Workers Ironworkers n Elevator Constructors Painters & Allied Trades n Laborers Plumbers & Pipe Fitters n Teamsters Roofers n Operating Engineers Sheet Metal Workers
")
Number and percentage of construction establishments and employees, by establishment size, 2007 (Payroll establishments) Establishment size (number of employees) 1 to 9 10 to 19 20 to 99 100 to 499 500 or more Total Number of establishments % of all establishments Total number of employees % of all employees 660, 454 78, 957 63, 309 8, 176 556 811, 452 81. 4% 9. 7% 7. 8% 1. 0% 0. 1% 100. 00% 1, 711, 260 1, 057, 733 2, 457, 313 1, 481, 955 559, 622 7, 267, 833 23. 5% 14. 6% 33. 8% 20. 4% 7. 7% 100. 00% Source: U. S. Census Bureau: County Business Patterns, 2007
 n Building upgrades for older homes / apartments")
What is Green (in construction? ) n Building upgrades for older homes / apartments n Windows / doors / insulation
 n Wind turbine erection")
What is Green (in construction? ) n Wind turbine erection

Are Green Jobs Safer? n No statistical difference between green and non-green projects in terms of construction worker safety and health. Source: Rajendran / Journal of Construction Engineering and Management, October 2009

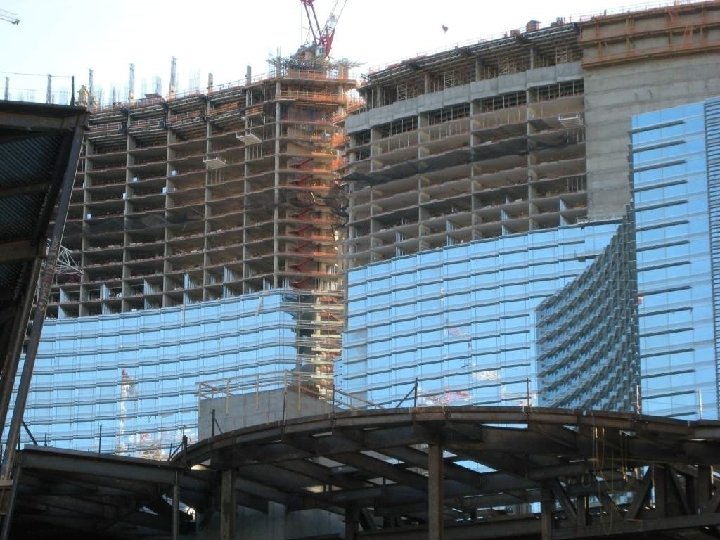
USGBC says occupants are healthier and more productive in LEED buildings But what about the builders. . . ?

The LEED Building n Designed n Reduce to: energy consumption n Reduce water consumption n Reduce CO 2 output n Improve indoor air quality n Improve resources stewardship

Harold Billingsley, Ironworker

“How many construction site deaths should there be to make a building ‘not green’ regardless of the environmental benefits? ”

How can safety be designed into Green Jobs? n n There currently is a blind spot in sustainable design practice when it comes to worker safety and health. Tremendous focus is placed on materials, energy and the environment, but designers typically give little, if any, consideration to the safety and health of the people who install the green features or build the projects. Source: Gambatese / ENR. com

NIOSH’s Top Compelling Activities n n #3 – Include OSH into green and sustainable standards as they are being updated #4 – Include OSH in procurement and construction #6 – Integrate safety and health into green elements of contractor specifications #9 – Develop, validate and disseminate a LEED-like OSHA rating system

We can quantify LEED rates jobs on: n n n Sustainable sites Water efficiency Energy and atmosphere Materials and resources Indoor environmental air quality Innovation and design So let US rate jobs on: n n n Owner commitment to safety Safety and health professionals / contracts Safety and health planning Training and education Employee involvement There is a tool in development to do this

LEED-like OSH rating system

Project Team Selection n Owner uses past safety performance when selecting a contractor General uses past safety performance when selecting subs Owner chooses designer with experience / knowledge of worker safety & health

S & H in Contracts n n n Safety & Health requirements in contracts Hazards identified in drawings Specify less hazardous materials

S & H Professionals n n Competent personnel for all high hazard tasks Owner safety representative General contractor safety representative Sub-contractor safety representative

S & H Planning n n n Included during conceptual stage of project Constructability review Designing for worker safety and health Life cycle safety design review Safety checklist for designers General and Subs site specific safety plan
 n n n Job hazard analysis Pre-task planning")
S & H Planning (cont. ) n n n Job hazard analysis Pre-task planning Look-ahead schedule Traffic plans Good housekeeping plan PPE plan

Training and Education n n Safety training for designers Safety orientation for all workers OSHA 10 for all workers Safety training for field supervisors*

A Foreman’s Choice n Commercial building HVAC / energy upgrades

Construction Safety Association of Ontario - Study

My recommendation for small employers with construction workers: n n Plan for safety Train your foremen Train workers, especially new and inexperienced workers Score yourself on how well you design your project from inception

Our recommendations to DOL / BLS & OSHA As DOL/BLS proceeds in establishing a definition of “green jobs, ” it is essential that conserving our human resources receive the same consideration as conserving our natural resources. Don Ellenberger – CPWR 301 -578 -8500 donellenberger@cpwr. com www. cpwr. com


Safety and Health Outlook: Wind Energy April 1, 2010 Michele Myers Manager, Labor, Health and Safety Policy American Wind Energy Association
 • Founded in 1974 More than 2, 500 business")
American Wind Energy Association (AWEA) • Founded in 1974 More than 2, 500 business members • Wind project developers • Transportation and construction companies • Manufacturers from bolts to turbines • More than 8, 000 parts in a turbine • www. AWEA. org provides extensive info on wind

American Wind Energy Association Trade association for the wind energy industry Over 2, 500 business members www. awea. org • Develops policies and conducts analysis to support wind industry growth • Executes wind industry’s legislative agenda • Promotes wind energy through advocacy, advertising and media relations • Convenes conferences and workshops to educate the public and bring industry members together

History of Wind Energy

An Age-Old Energy Source
 • Dutch windmill")
Early Days • Cretan windmill (1464 AD – mechanical water pumping) • Dutch windmill (1500 – mechanical water pumping, grain milling) • U. S. farm windmill (1854 – present – mechanical water pumping)
 • First large-scale unit (17 -m rotor diameter)")
Early Days • Brush Turbine (1888) • First large-scale unit (17 -m rotor diameter) • Small wind electric turbines (1890 s – Denmark, U. S. , elsewhere) • Sporadic experiments with turbines of ~100 k. W in U. K. , Italy, Germany (1920 s and 1930 s)

Early Days • Smith-Putnam Turbine • Grandpa Knob, Castleton, VT • 175 -foot rotor, 1. 25 -MW capacity • Operated from late 1941 to spring of 1945 • Economic failure – technological triumph • Foundation footings still in place

Post-1973 Oil Shock • Federal Wind R&D Program • Outgrowth of Eisenhowerera NSF program • Sponsored procurements in range of sizes • Boeing MOD-2 is icon (300 foot rotor, 3 -MW capacity) • Helped build technology and engineering base

Post-1973 Oil Shock 1978 – Second oil shock leads to: • Public Utility Regulatory Policies Act of 1978 (PURPA) • Requires utilities to buy electricity from renewable and cogeneration facilities • Energy Tax Act of 1978 • Creates 15% Energy Investment Tax Credit (EITC) • Added to existing 10% ITC • Limited Partnership Structure -> Wind Farms

Early Wind Farm Era • First Wind Farm – Crotched Mountain, NH, December 1980 (equipment failures, wind speed overestimated) • California Wind Farms – Altamont, Tehachapi, San Gorgonio passes, December 1981 • Wind begins explosive growth, ended abruptly with sunset of EITC in December 1985

Wind Turbines: Power for a House or City

Basic Supply Chain Raw Materials Suppliers Component Suppliers Major Component Suppliers Turbine Manufacturers create a ripple effect down the supply chain, creating even more jobs indirectly than at their facilities.

Fundamentals of Wind Power Turbine subsystems include: • A rotor, or blades, which convert the wind's energy into rotational shaft energy • A nacelle (enclosure) containing a drive train, usually including a gearbox and a generator • A tower, to support the rotor and drive train; and electronic equipment such as controls, electrical cables, ground support equipment, and interconnection equipment. Rotor Nacelle Tower

Inside a Nacelle

How Big is a 2 -MW Wind Turbine? This picture shows a Vestas 80 -meter diameter, 2 -MW wind turbine superimposed on a Boeing 747 jumbo jet 80 m. 59. 6 m.

Turbine Components There are over 8, 000 components in a turbine, including: Towers Ladders Lifts Rotor: Hub Nose Cone Blades • Composites • Blade Core Pitch Mechanisms Drives Brakes Rotary Union 2 Nacelle: Foundation: Nacelle Cover Nacelle Base Heat exchanger Controllers Generator Power Electronics Lubricants Filtration Insulation Gearbox Pump Drivetrain Ceramics Shaft Rebar Concrete Casings Other: Transformers Bolts/Fasteners Wire Paints and Coatings Lighting Protection Steel Working/Machining Communication Devices Control and Condition Monitoring Equipment Electrical Interface and Electrical Connection Batteries Bearings Brakes
 • Rotor")
Wind Power Technology • Hub Height: 60 -100 meters (197 -328 feet) • Rotor Diameter: 70100 meters (230 -328 feet) • Total Weight of Turbine: 230 - 340 tons

Small Wind Systems • Range from 0. 3 to 100 k. W • Installed in on- and off-grid applications • Require 4 m/s (9 mph) average wind sites

Large Wind Systems • Range in size from 660 k. W to 3. 6 MW • Provide wholesale bulk power • Require average wind speeds of 6 m/s (13 mph) • One megawatt of wind generates about as much electricity as 225 to 300 households use

U. S. Wind Resource Map Copyright © 2008 3 TIER, Inc. All Rights Reserved. For permission to reproduce or distribute: info@3 tiergroup. com

Jobs - Wind Energy

20% Wind Energy by 2030 • U. S. Department of Energy: “The U. S. possesses sufficient and affordable wind resources to obtain at least 20% of its electricity from wind by the year 2030. ”

Job Projections Under 20% Report • Over 500, 000 total jobs would be supported by the wind industry • In 2008, wind industry added 35, 000 new jobs Source: U. S. DOE, 20% Wind Energy by 2030

Wind Project Development 46 states would have wind development by 2030 under the 20% Vision Source: U. S. DOE, 20% Wind Energy by 2030

Domestically Manufactured Components There has been a dramatic shift towards domestic manufacturing for wind turbine components 2008 2005 ~25% domestic components ~2, 500 MW installed ~1, 500 turbines installed 2008 ~50% domestic components ~8, 500 MW installed ~5, 300 turbines installed

Current Manufacturing Capacity • There are well over 120 manufacturing facilities for turbines and large components currently online in the U. S. • U. S. manufacturers are producing all the turbine’s components. • In 2005, about 30% of turbine & major components were made in the U. S. , but in 2008 domestically manufactured components in turbines accounted for about 50% by value.

Turbine Manufacturers with a U. S. Presence • • • Acciona Clipper De. Wind Gamesa GE Energy Siemens Suzlon Vestas Fuhrlander (Announced) Global Wind Systems (Announced) Nordex (Announced) Nordic (Announced)

U. S. Manufacturing Locations • Over 40 U. S. states host more than 160 windrelated manufacturing facilities • Wind manufacturing is spread across the U. S. with major turbine manufacturers operating in varied regions • With the growth in the industry, many states have recently entered into the supply chain. 4
:")
Primary States for Manufacturing States with five or more major facilities (online or announced): • California • Colorado • Iowa • Illinois • Michigan • Minnesota • Ohio • Pennsylvania • South Carolina • Texas
 Blades Clipper Systems")
Turbine Manufacturer Locations Nordic Fuhrlander Siemens Suzlon Acciona, Global Wind (announced) Blades Clipper Systems only (announced) Gamesa GE Energy, Continental (announced) GE Energy Vestas De. Wind Nordex, EWT, Mitsubishi (all announced)

New U. S. Manufacturing Capacity Between 1 Q 2007 and 4 Q 2008 (24 months), there was significant growth in the industry’s manufacturing capacity. • 19 new facilities online • 31 announced facilities • 21 announced facility expansions A total of 71 facilities have come on-line, been announced, or have expanded. 3

Market Update

2009 Highlights • Nearly 10, 000 MW installed in 2009 • 39% annual growth • Total installations now above 35 GW • Shattered all installation records thanks to the Recovery Act • Turbine manufacturing is down compared to last year’s levels • Need long-term policy certainty and market pull in order to grow manufacturing sector

U. S. is World Leader in Wind Power

U. S. Wind Industry: 2009 Second year in a row adding over 40% of US capacity Wind MW Installed Total Installation in 4 Q 2009: 4, 041 MW Total Installation in 2009: 9, 922 MW Total U. S. Installation through 4 Q 2009: 35, 159 MW Source: American Wind Energy Association

Wind Power Installations by State

Top Ten States in 2009 Source: American Wind Energy Association

Top 10 Largest Wind Farms
 Source: American Wind Energy Association")
State by State Installations (MW) Source: American Wind Energy Association

Market Players • Turbines Installed in 2009: Acciona WP, Clipper, De. Wind, Fuhrlander, Gamesa, GE Energy, Mitsubishi, Nordex, REpower, Siemens, Suzlon & Vestas • The project developer list continues to diversify and change with new developers increasing their activity in 2009 and other developers decreasing market activity. • Utility ownership of wind projects trending at similar rates of 2008, more community-owned projects

Other Half of the Market: Manufacturing • The U. S. continues to add new manufacturing facilities, but growth is down by a third: • 38 online, announced or expanded manufacturing facilities in 2009, compared to 58 facilities in 2009. • As new turbine orders continue to come in slowly, some manufacturing production is running at significantly decreased levels compared to 2008 due to decreased demand some excess supply. • Establishment of a long-term, stable market is still the key to unleashing investment in manufacturing capabilities in the U. S. • Countries are competing through policy for the wind industry, wind manufacturing and jobs!

U. S. Wind Manufacturing Source: American Wind Energy Association; Updated Through 4 Q 2009 Major facilities online prior to 2008 All new online in 2008 - 2009 Announced facilities

2008 Turbine Statistics Turbine installed the most in the U. S. in 2008 was the 1. 5 -MW turbine. Average turbine capacity is 1. 67 MW Turbine Ranges Turbine Components

Occupational Safety and Health = Core Value ● Improve Worker Safety and Health ● Support of Continuous Education and Training of Employers and Employees in the Wind Industry ● Work Cooperatively with Regulating Agencies to Ensure the Safety and Health for All Workers

AWEA Safety and Health Committee ● AWEA Safety and Health Committee • Created 3 years ago • Over 450 members participating • 9 subcommittees and task forces • 20 -50 participants on each subcommittee • Monthly conference calls • Address the most pressing issues within the industry

AWEA Safety and Health Committee ● ● ● ● ● Steering Committee Construction Safety Subcommittee Manufacturing Safety Subcommittee O&M Safety Subcommittee Training and Education Subcommittee Offshore Safety Subcommittee Safety Survey Subcommittee Confined Space Task Force LOTO Task Force

Safety and Health Initiatives ● Education and Understanding the Intricacies of Development and the Sustainability of Wind Generation Plants

Safety and Health Initiatives ● Empowering Workers to be Engaged and Take Ownership in Worker Safety and Health Programs

Safety and Health Initiatives ● Collect and Monitor Injury, Illness, and Fatality Data • Leading Indicators • Injuries, Illness, and Fatalities • What are the Causes • Where are the Accidents ● Identify the High Hazard Areas ● Develop Solutions to Eliminate or Significantly Reduce Hazards

Identify High Risk Hazards • Falls • Emergency Rescue • Confined Space • Environmental Conditions

Training Initiatives Create and Develop Appropriate Safety and Health Training Programs and Educational Materials for All Sectors of the Wind Industry • OSHA 10 Hour • OSHA 30 Hour • Supervisor • Emergency Rescue • Confined Space

Thank you! More information : Michele Myers Manager, Labor, Health and Safety Policy www. awea. org | 202 -383 -2500 | mmyers@awea. org www. awea. org/events


Waste Management and Recycling & Associated Workplace Hazards Justin August, CIH Covanta Energy Corporation
 operator in the world •")
Leading Producer of Energy-from-Waste • Largest Energy-from-Waste (Ef. W) operator in the world • Global presence; local relationships • North America, Asia & Europe • 4, 000 employees • 45 Ef. W and 8 biomass to electric facilities Lee County Ef. W, Florida • Almost 10% of U. S. non-hydro renewable electricity • Over 6% of U. S post recycled waste disposal • 400, 000 tons of metal recycled each year 111

Renewable Energy • U. S. EPA states that Energy-from-Waste “produces electricity with less environmental impact than almost any other source” • 25 States and the federal government defined Ef. W as renewable • A new 2, 000 -3, 000 ton/day facility • 73 to 110 MW electricity

Converting Waste Into Clean Renewable Power Helps Solve Three of the Nation’s Biggest Challenges • Climate Change One ton of trash reduces one ton of CO 2 eq • Energy Security Local renewable energy available 24/7 • Creates Jobs Typical facility creates 1, 000 construction jobs (3+ years) Energy-from-Waste is a specially designed energy generation facility that uses household waste as fuel and helps solve some of society’s big challenges Municipal Solid Waste (MSW): 1 ton Power: 500 -750 k. Wh Metal: 50 lbs Ash: 10% of original volume

Energy-from-Waste reduces waste volumes by 90%

Economic Investment Green Jobs • 1, 600 ton per day facility • $450 million construction cost ~ 3 years of activity • • 300 -500 direct construction jobs per year ~$31 million annual operating budget benefits local economy • 50 full time to operate facility – High paid jobs averaging more than $60 K • State Income Tax and Host Community benefits • Goods and services purchased locally 115

Covanta - Industry Leader in VPP & EPA • EPA – Environmental Performance Track • 25 EPT Sites • VPP - Top 7 of all Companies • 39 VPP Star Sites • VPP - Number of SGE/STM Participants • Top 4

Niagara, NY Onondaga, NY Hennepin, MN Kent, MI Detroit, MI Marion, OR Harrisburg, PA Delaware, PA Lancaster, PA Plymouth, PA York, PA Abington TS, PA Jonesboro, ME Haverhill, MA West Enfield, ME SEMASS, MA Springfield, MA Pittsfield, MA CFS-North Mid-Con, CT SECONN, CT Bristol, CT Wallingford, CT Hempstead, NY Huntington, NY Mac. Arthur, NY Babylon, NY Hudson Valley, NY BMP, CA MLP, CA POPI, CA Stanislaus, CA Delano, CA Mendota, CA Long Beach, CA Indianapolis, IN Essex, NJ Union, NJ WERC, NJ Montgomery, MD Montgomery TS, MD Alexandria, VA Fairfax, VA Honolulu, HI Tulsa, OK VPP Sites (39) Non-VPP Target Sites (13) Huntsville, AL CFS-Southeastern, FL Pasco, FL Lake, FL Lee, FL Hillsborough, FL Covanta Facility OSHA VPP Status by OSHA Region January 2010

Covanta Safety Management Systems Corporate Technical Standards & Safety Steering Committee Work. Care - Occupational Health Physicians for Injury Treatment and Exams Regional Audits: Snapshots, Corporate Audit Program Providing Support to Implement Corporate HS Policies Facility Local Occupational Health Clinic / Mobile Exam Clinic Near miss reports, Job Observations (JOB’s), Job Safety Analyses, Pre-job task briefings

The Covanta Safety Management and Communication Pyramid Daily Near miss reports, JOBs, Job Safety Analyses (JSAs/JHAs), Pre-job task briefings, accident reviews w/Region & Site Weekly Tailgates, Staff calls with VP HS Monthly Safety training, Field calls with Regional personnel, training material planning calls Quarterly Safety steering committee meetings, technical standards meetings, field employee meetings, Snapshots Semi-annually Performance reviews, safety metric compensation Annually Company-wide safety meeting, Trade presentations, OSHA meetings

Safety and Health Program Management Corporate Safety and Health Intranet Site

Mobile Equipment Safety • Safety Upgrades • Seatbelt Use

Focus on Leading Indicators • • Internal “Snapshot” audits Tracking/Trending “Near-Miss” events Job Observations Sharing of Best Practices

Modern Energy-from-Waste

6dbdaef975b0560fdaca019f95423b4d.ppt