

548c3b649773280e56d67e2ad38b04e4.ppt
- Количество слайдов: 22
 Green Economy Corridor for Kalimantan ? Pavan Sukhdev Mc. Kluskey Fellow 2011, Yale University Founder-CEO, GIST Advisory
 Agriculture : Challenges & Opportunities • Approximately 2. 6 billion • 10 percent increase in farm people rely on agricultural production systems for their livelihood. (FAO, 2009) yields -> 7 % reduction in poverty in Africa, more than 5 % in Asia • 525 million small farms • Green farming practices have world wide, 404 million less than two hectares of land (Nagayets, 2005), Small farms cultivate 60 % of arable land (Herren et al. 2010) increased yields, especially on small farms, between 79 % (Pretty et al, 2006) and 180 %. An increase in overall GDP coming from agricultural labor productivity is on average 2. 5 times more effective in raising the incomes of the poorest quintile in developing countries than an equivalent increase in GDP coming from non-agricultural labor productivity. UNEP – GREEN ECONOMY INITIATIVE
") Recommended Investment Priorities • R&D and Agribusinesses • Plant and animal health management (PAHM) • Strengthening the supply chains for green products and farm inputs • Improving soil (esp. soil organic matter) and water management and diversifying crops and livestock • Farm mechanization and post-harvest storage UNEP – GREEN ECONOMY INITIATIVE
Recommended Investment Priorities • R&D and Agribusinesses • Plant and animal health management (PAHM) • Strengthening the supply chains for green products and farm inputs • Improving soil (esp. soil organic matter) and water management and diversifying crops and livestock • Farm mechanization and post-harvest storage UNEP – GREEN ECONOMY INITIATIVE
 • An FAO programme focused at the household") Example : Low-Cost Storage (Metal Silos) • An FAO programme focused at the household and community level for more efficient grain storage • Farmers who invested in silos earned nearly 3 times more (US$ 38/100 kg of maize) by selling their crop 4 months after the time of harvest (US$ 13/100 kg). • Production costs for metal silos ranged from US$ 20 (120 kg small- capacity unit) to US$ 70 -100 (1800 kg large-capacity unit) • Most farmers realized a full return on their investment within the use. • Example of misplaced priorities : Even though post-harvest losses could be reduced relatively quickly, less than 5% of worldwide agricultural research and funding currently targets this problem UNEP – GREEN ECONOMY INITIATIVE first year of
Example : Low-Cost Storage (Metal Silos) • An FAO programme focused at the household and community level for more efficient grain storage • Farmers who invested in silos earned nearly 3 times more (US$ 38/100 kg of maize) by selling their crop 4 months after the time of harvest (US$ 13/100 kg). • Production costs for metal silos ranged from US$ 20 (120 kg small- capacity unit) to US$ 70 -100 (1800 kg large-capacity unit) • Most farmers realized a full return on their investment within the use. • Example of misplaced priorities : Even though post-harvest losses could be reduced relatively quickly, less than 5% of worldwide agricultural research and funding currently targets this problem UNEP – GREEN ECONOMY INITIATIVE first year of
 Q: Can we draw any lessons from Amazonas’ economic development? Amazonas is Brazil’s largest state by area, largest rainforest area, lowest deforestation rate Q : How and why did Amazonas achieve its present GDP mix ( Industry 66%, Services 30%. Agriculture 4% of GDP) ? Q: Has its 78% “Cities” population a negative or a positive impact on forests ? Q: What led to the growth of jobs in Manaus ?
 Demography of Brazil
 Agriculture, Silviculture and Forest Exploration Livestock") Sector-Wise Components of GVA Amazonas State Data (2008) Agriculture, Silviculture and Forest Exploration Livestock and Fishing Quarrying Industry Manufacturing Industry Civil Construction Production and Distribution of Electricity and Gas, Water, Sewage and Urban Sanitation Maintenance and Repair Services, and Trade Lodging and Feeding Services Transportation, Storage and Mail Information Services Financial Mediation, Insurance, Complementary Social Security and Related Services Rendered to Families and Association Groups Services Rendered to Companies Real Estate and Renting Activities Public Administration, Health and Education and Social Security Private Health-Care and Education Domestic Services Total % of Total Gross Value Added 4. 0% 1. 4% 2. 7% 30. 7% 5. 7% 2. 2% 11. 5% 2. 1% 5. 8% 1. 9% 2. 1% 1. 2% 2. 7% 5. 6% 17. 8% 1. 8% 0. 7% 100. 0%
Sector-Wise Components of GVA Amazonas State Data (2008) Agriculture, Silviculture and Forest Exploration Livestock and Fishing Quarrying Industry Manufacturing Industry Civil Construction Production and Distribution of Electricity and Gas, Water, Sewage and Urban Sanitation Maintenance and Repair Services, and Trade Lodging and Feeding Services Transportation, Storage and Mail Information Services Financial Mediation, Insurance, Complementary Social Security and Related Services Rendered to Families and Association Groups Services Rendered to Companies Real Estate and Renting Activities Public Administration, Health and Education and Social Security Private Health-Care and Education Domestic Services Total % of Total Gross Value Added 4. 0% 1. 4% 2. 7% 30. 7% 5. 7% 2. 2% 11. 5% 2. 1% 5. 8% 1. 9% 2. 1% 1. 2% 2. 7% 5. 6% 17. 8% 1. 8% 0. 7% 100. 0%
 Manaus - Economic Activity • History : rubber industry, then 'free port' • No taxes on imports or exports – Manaus free trade zone. Industrial Pole of Manaus (PIM, in Portuguese) • PIM has decreased the role of timber, agriculture and livestock - creating a sustainable development model - harmonizes economy growth, job creation and forest conservation. • Manaus’s industries : brewing, shipbuilding, soap manufacturing, chemicals, electronics equipment, and petroleum refining (the oil by barge down the Amazon from Peru). • Principal exports : electrical equipment, petroleum, chemicals, Brazil nuts and MFP’s, and tourism
 Manaus : Sector-Wise GDP MANAUS 2008 2007 2006 22303. 26 20894 18902 57251 55016 52179 29791 73196. 035 67320 Industry 13955116 13487052 13732867 11307489 20449276. 87 15485248 Services 15613986 14105087 12222192 10683775 6448345. 648 5553243 Total GVA Taxes on net subsidy products at current prices GDP at current prices 29626353 27647155 26007238 22021055 26970818. 56 21105811 8490142 6756517 5909018 5193158 2984205. 302 2444151 38116495 34403671 31916257 27214213 29677838. 41 23294474 0. 19% 0. 20% 0. 14% 0. 27% 0. 32% Industry 47. 10% 48. 78% 52. 80% 51. 35% 75. 82% 73. 37% Services 52. 70% 51. 02% 47. 00% 48. 52% 23. 91% 26. 31% GDP per capita at current prices (reais) 2005 2004 2003 18635. 36 Gross Value Added at Current Prices (thousand reais) Agriculture as % of Total GVA Agriculture Source: IBGE
 Manaus – Population Trend
 Developing Amazonas : Successes. . & Failures • Manaus Free Zone since 1967, is a free trade zone of the city that is an area of intense industrial activity - computers, motorcycles, jet skis, and electronics. • • Nokia, Toshiba, Samsung, LG, and Sony have established operations here Manaus a leader in IT goods manufactured - reaching 22% in 2005… Steady growth in skills and employment in & around Manaus … Manaus ranked among top cities to do business in Lat. Am • The Transamazonica (Trans-Amazon Highway) was initiated in 1970, with the aim of transecting the forest from East to West and opening up Amazonas to development. • It is an unfinished 5, 000 km long roadway, with only 175 km of tarmac. • Large stretches of the road are abandoned, either re-claimed by the forest or occupied by illegal landowners. • Laws were established to provide fiscal incentives for economic activity in but success was dampened due to infrastructural burdens and corruption.
 West Central Indonesia Kalimantan South Kalimantan East") % of Gross Regional Domestic Product (2008) West Central Indonesia Kalimantan South Kalimantan East Kalimantan Agriculture, forestry and fishing 14. 46 26. 51 30. 4 22. 56 4. 97 Mining 10. 92 1. 43 7. 07 21. 84 45. 84 Manufacturing 27. 89 18. 33 8. 23 10. 36 34. 25 Trade, hotel and restaurant Transportation and communication 13. 97 23. 44 19. 66 15. 03 5. 74 6. 31 6. 86 10. 09 9. 22 2. 97 Other services 9. 73 9. 56 12. 37 9. 3 2. 09 electricity, gas and water 0. 82 0. 55 0. 69 0. 57 0. 23 construction Finance, real estate and business services 8. 48 8. 64 5. 93 6. 29 2. 13 7. 43 4. 68 5. 55 4. 82 1. 79 Other components of GDP Source: Statistics Indonesia Notes: 1. Agriculture, forestry and fishing includes logging 2. mining includes petroleum and natural gas extraction 3. manufacturing includes refining 4. tourism is not a separate item, but is reflected in different categories, primarily 1. trade, hotel and restaurants, 2. transport and communication (through activities of travel agents), and 3. Other
% of Gross Regional Domestic Product (2008) West Central Indonesia Kalimantan South Kalimantan East Kalimantan Agriculture, forestry and fishing 14. 46 26. 51 30. 4 22. 56 4. 97 Mining 10. 92 1. 43 7. 07 21. 84 45. 84 Manufacturing 27. 89 18. 33 8. 23 10. 36 34. 25 Trade, hotel and restaurant Transportation and communication 13. 97 23. 44 19. 66 15. 03 5. 74 6. 31 6. 86 10. 09 9. 22 2. 97 Other services 9. 73 9. 56 12. 37 9. 3 2. 09 electricity, gas and water 0. 82 0. 55 0. 69 0. 57 0. 23 construction Finance, real estate and business services 8. 48 8. 64 5. 93 6. 29 2. 13 7. 43 4. 68 5. 55 4. 82 1. 79 Other components of GDP Source: Statistics Indonesia Notes: 1. Agriculture, forestry and fishing includes logging 2. mining includes petroleum and natural gas extraction 3. manufacturing includes refining 4. tourism is not a separate item, but is reflected in different categories, primarily 1. trade, hotel and restaurants, 2. transport and communication (through activities of travel agents), and 3. Other
 % IN CITIES West Kalimantan 4, 393,") Urban Population - Kalimantan REGION CENSUS (2010) % IN CITIES West Kalimantan 4, 393, 239 25. 1 Central Kalimantan 2, 202, 599 27. 5 South Kalimantan 3, 626, 119 36. 3 East Kalimantan 3, 550, 586 57. 6
Urban Population - Kalimantan REGION CENSUS (2010) % IN CITIES West Kalimantan 4, 393, 239 25. 1 Central Kalimantan 2, 202, 599 27. 5 South Kalimantan 3, 626, 119 36. 3 East Kalimantan 3, 550, 586 57. 6
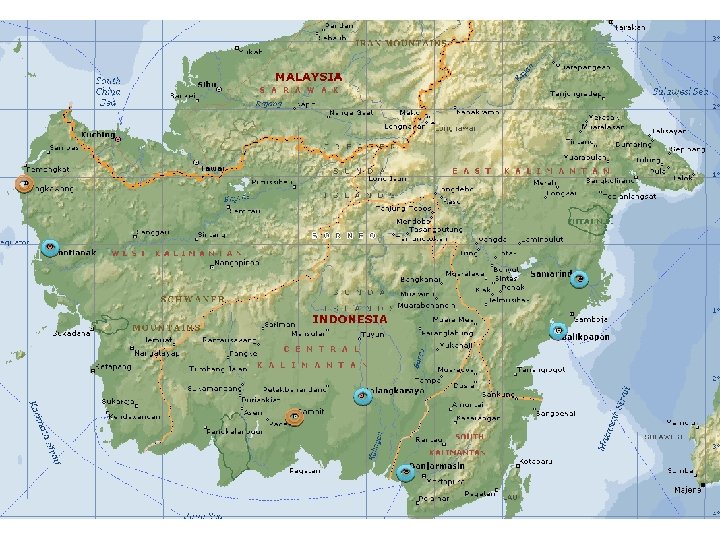
 Urban Population Growth in main cities - Kalimantan CITY PROVINCE Palangkaraya Central Kalimantan Balikpapan East Kalimantan CENSUS (1990) CENSUS (2000) 99, 693 334, 851 148, 197 396, 909 CALC/ EST (2011) ANN. % GROWTH 221, 122 3. 7 464, 499 1. 44 Samarinda East Kalimantan 334, 851 346, 959 349, 238 0. 06 Pontianak West Kalimantan 387, 441 432, 732 475, 272 0. 86 Banjarmasin South Kalimantan 443, 104 527, 724 619, 570 1. 47
 Key Industries in Kalimantan’s main cities CITY PROVINCE MAJOR INDUSTRIES Household industries: wood carving, plaiting, weaving, and beadwork Palangkaraya Central Kalimantan Balikpapan Site of a major oil refinery, the region is also known for its timber, mining, and petroleum export products Samarinda East Kalimantan Centre for extensive timber and logging industries West Kalimantan Renowned for its food and regional produce. Main industries are shipbuilding and the production of rubber, palm oil, sugar, pepper, rice and tobacco. South Kalimantan processing industries: plywood, rattan and rubber manufacturing East Kalimantan Pontianak Banjarmasin
 CENSUS") Urban Population Growth in Tier-II cities in Kalimantan CITY PROVINCE Sampit CENSUS (1990) CENSUS (2000) Central Kalimantan Tarakan Singkawang Martapura East Kalimantan West Kalimantan South Kalimantan CALCULATION ANNUAL (2011) GROWTH 76, 821 75, 508 89, 161 1, 04, 282 1. 43 79, 260 94, 009 1, 10, 331 1. 47 1, 40, 508
Urban Population Growth in Tier-II cities in Kalimantan CITY PROVINCE Sampit CENSUS (1990) CENSUS (2000) Central Kalimantan Tarakan Singkawang Martapura East Kalimantan West Kalimantan South Kalimantan CALCULATION ANNUAL (2011) GROWTH 76, 821 75, 508 89, 161 1, 04, 282 1. 43 79, 260 94, 009 1, 10, 331 1. 47 1, 40, 508
 Key Industries in Tier – II Cities CITY Sampit Tarakan Singkawang Martapura PROVINCE MAJOR INDUSTRIES Central Kalimantan Timber processing (high concentration of sawmills) and shipping (largest timber port in Indonesia). Also some mining and plantations East Kalimantan Major port and trading centre for fisheries, forest products and domestic goods. Formerly, a major centre for oil exploration but the sector now contributes only 6% of local economy. West Kalimantan Formerly gold mining town, contributed oneseventh of the world’s total gold supply. Main industries now are ceramics and tourism South Kalimantan Centre for the diamond cutting industry, seaport primarily for domestic trade
 “Green Economy” opportunities need to be investigated… Q : Which of these ‘green’ sector models can work in Kalimantan ? And which can be scaled ? REDD+ on old Rice fallows ? Sustainable small-scale farming model ? Sustainable Palm Oil ? Silvipasture development? Waterways system development? “Culture Village” model of eco-tourism ? Tourism innovation ? (indigenous houseboats, floating hotels, markets, etc) • SSI & Cottage Industries for domestic & export mkts ? • Sustainably managed forests ? • Low-impact, controlled, mining ? • •
 “Green Economy” opportunities need to be investigated… Q : Which cities can become growth hubs in Kalimantan ? Q : How should progress be measured ? Q: Is ‘GDP’ a good enough indicator at Province level? Q: Is profit margin a good enough indicator at a Sectoral level ?
 Q: How can we avoid this ? Private Profits, Public Losses US$/ha 10, 000 $12, 392 ha $9632 ha After adding public benefits from mangroves 5, 000 $1220 ha $584 ha 0 private profits Shrimp Farm $584 ha private profits less profits subsidies Net of public costs of restoration after 5 yrs Mangroves Source: Barbier 2007 & TEEB – The Economics of E -ve $11, 172 ha
 Thank You ! Pavan Sukhdev Mc. Kluskey Fellow 2011, Yale University Founder-CEO, GIST Advisory