325729e302399a0b1ae2793490841a0e.ppt
- Количество слайдов: 72


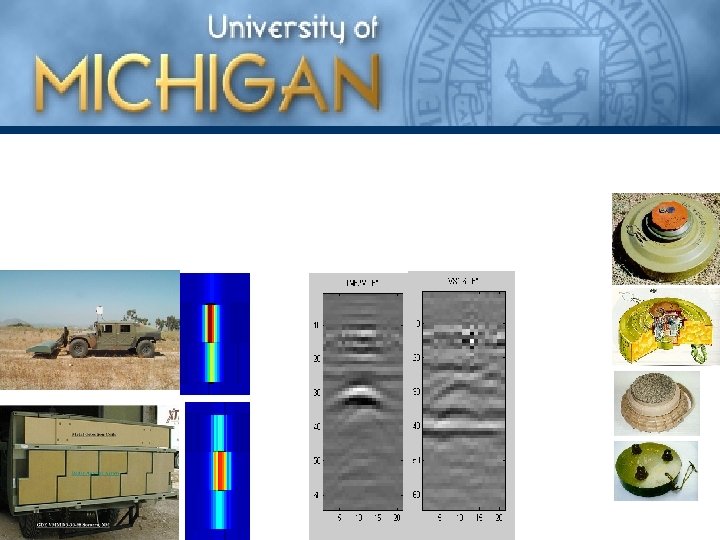


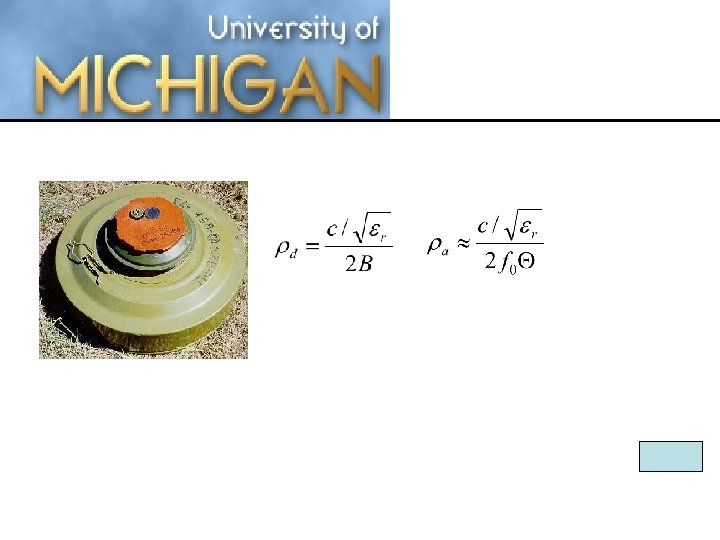
GPR Facts EMI Facts Bandwidth: Operating: 75 Hz 500 MHz - 2 GHz Frequency Sampling: Along Track: 5 cm (2”) Along Track: 5 cm Cross Track: 15 cm (6”) Cross Track: 17. 5 cm Swath: 3. 0 m Swath: 2. 8 m
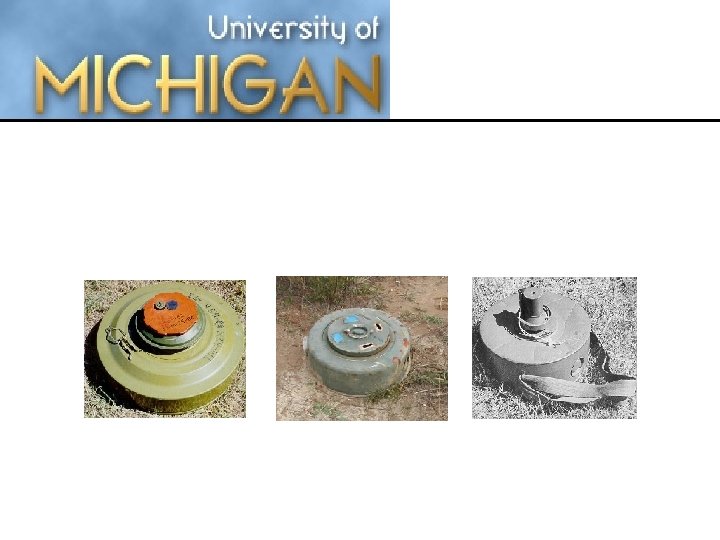
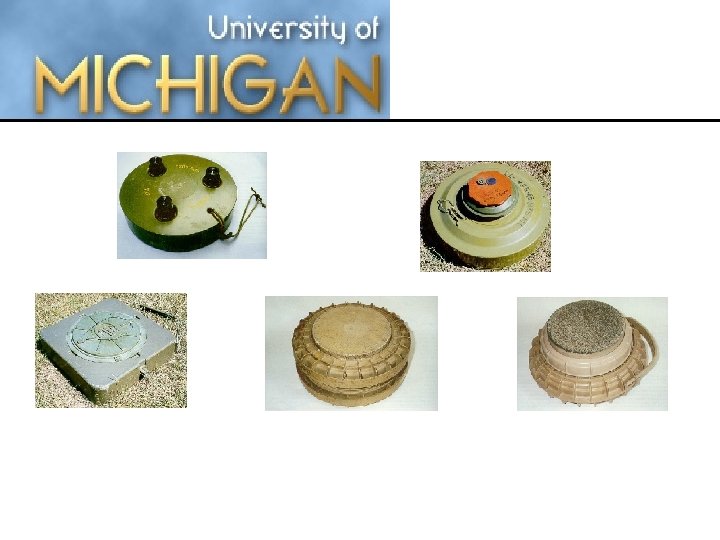

GOAL: To determine presence vs. absence of land mines vs. other metal objects USING: Both GPR and EMI data (multi-modal detection algorithm)


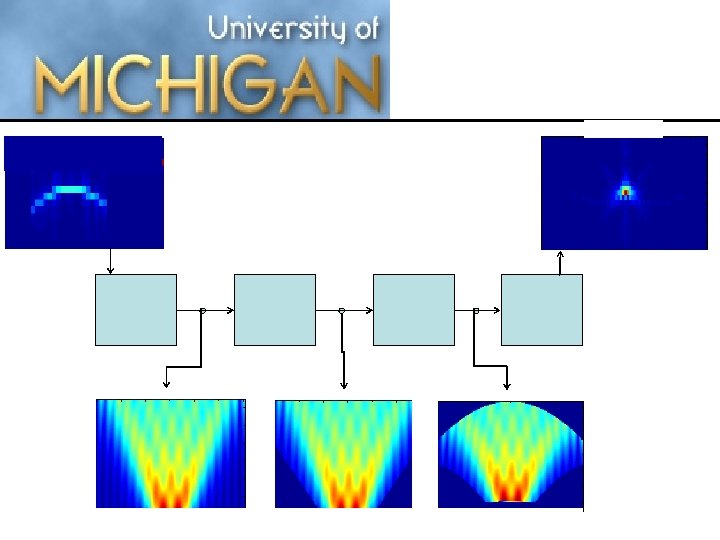
Fourier Transform Sampled Frequencies Depth Profile
")
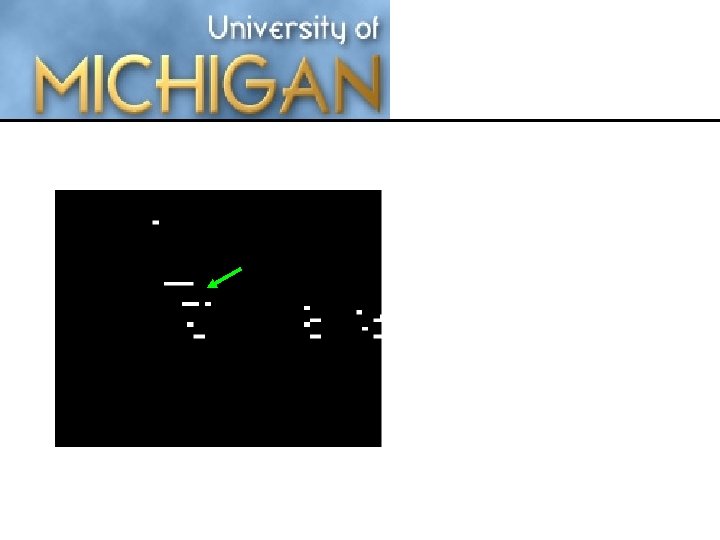
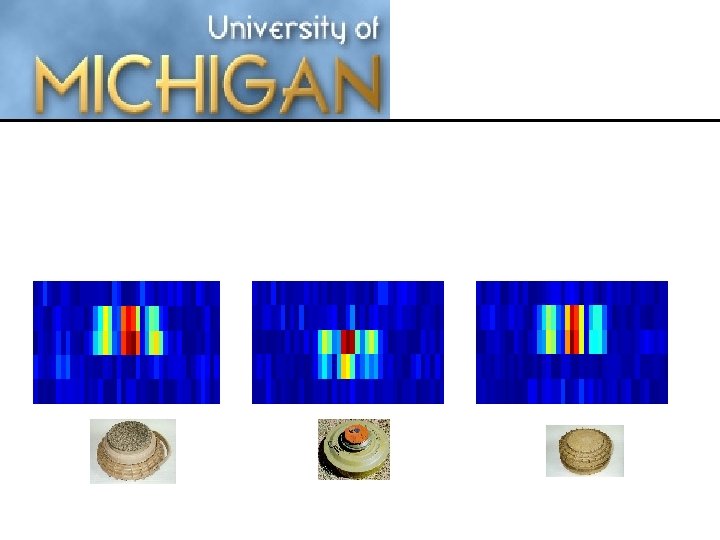
Simulated Data (“x-t” domain)

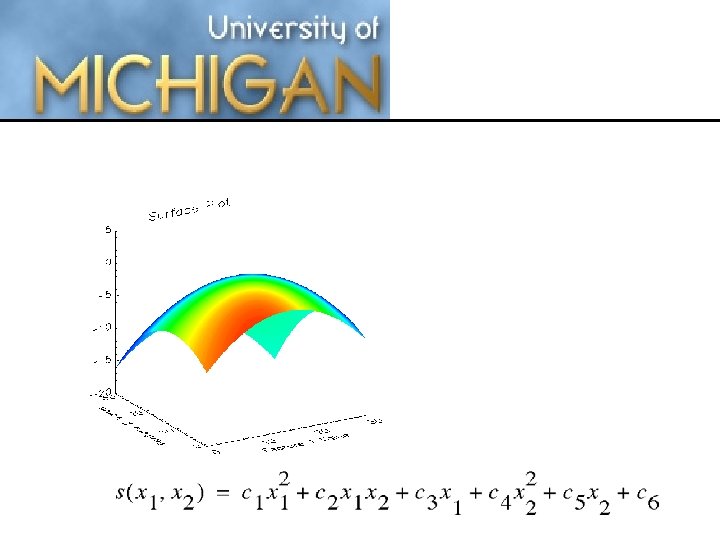
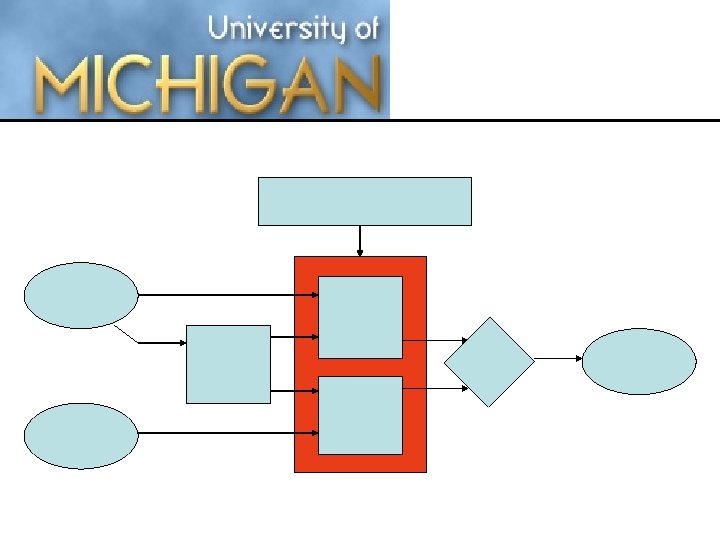
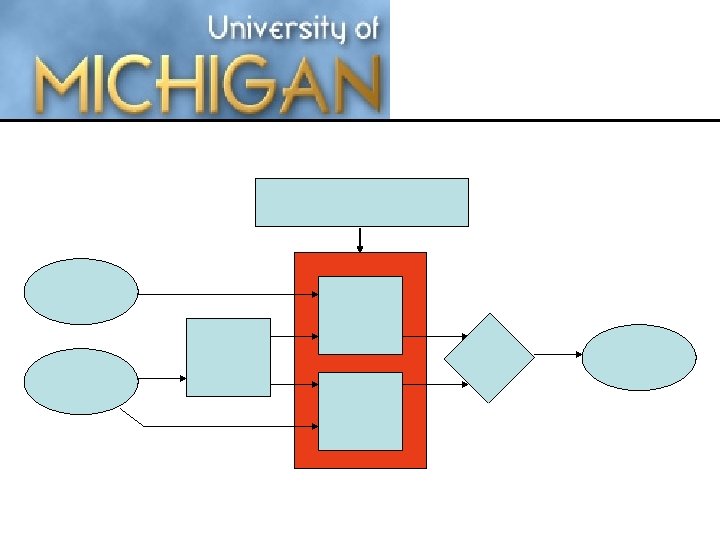
Screener Stage Discriminant Stage Features: Aspects of the detected objects are characterized in a vector of feature values. Discriminant: Combines object features into a test statistic.

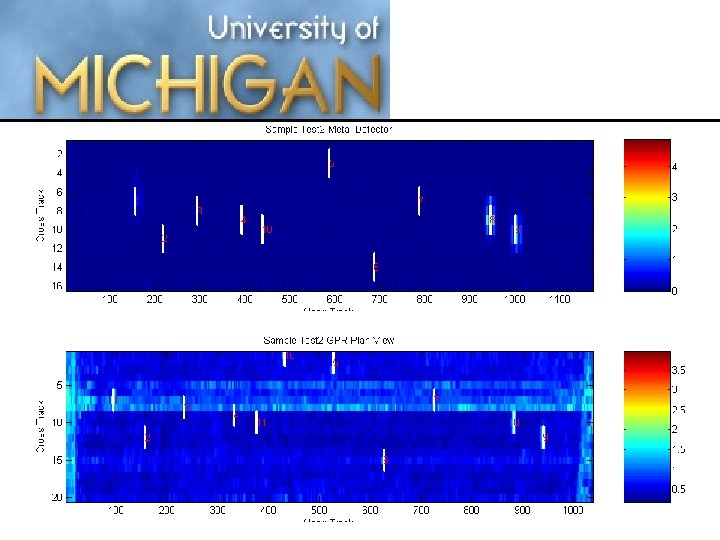
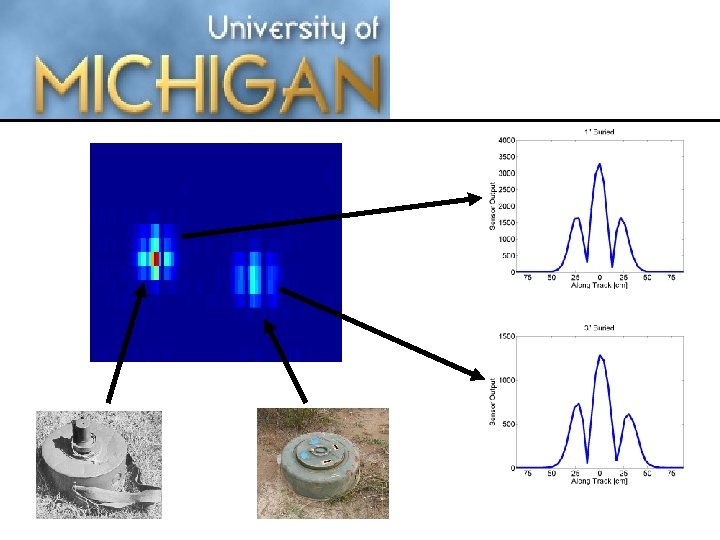
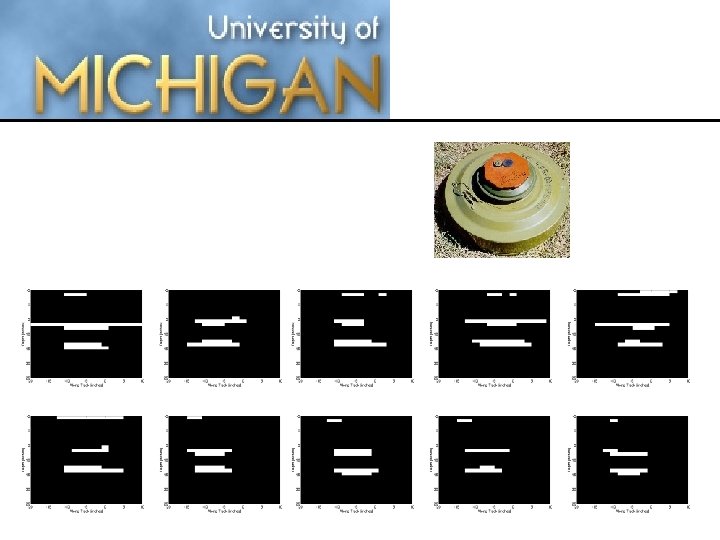
EMI Data


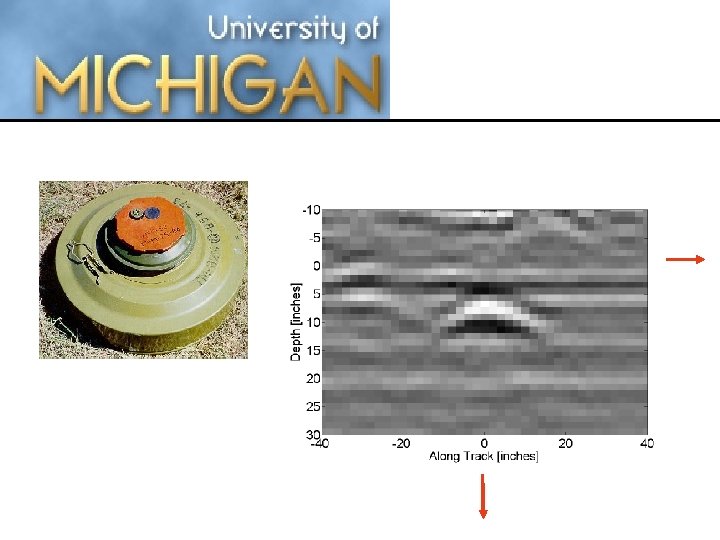
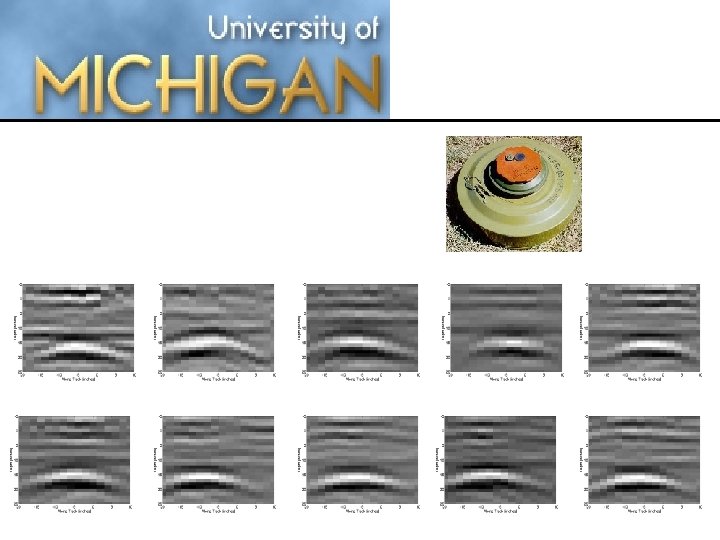
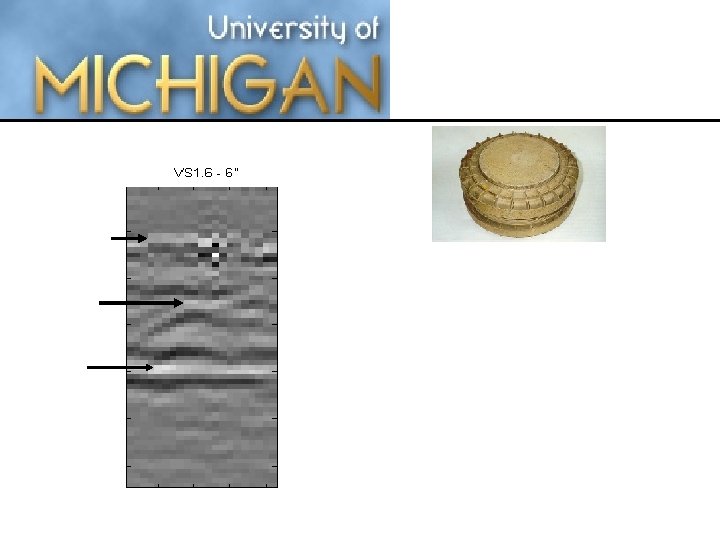
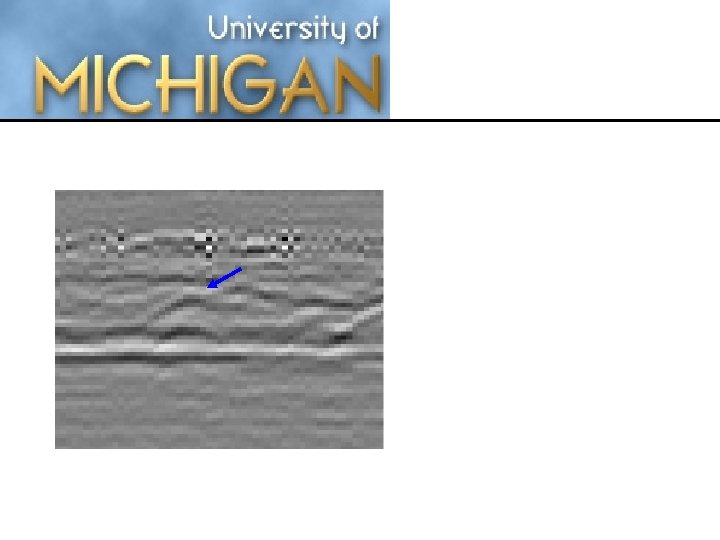
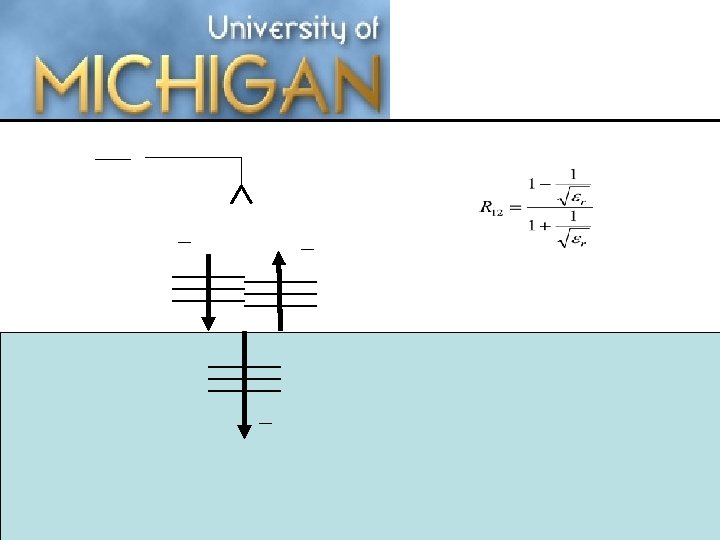
Unimaged Signature before imaging is dominated by the standard hyperbola. Depth can be determined if data is properly calibrated. Size requires imaging to estimate. “Convexity” of signatures is determined by the speed of propagation in the medium.

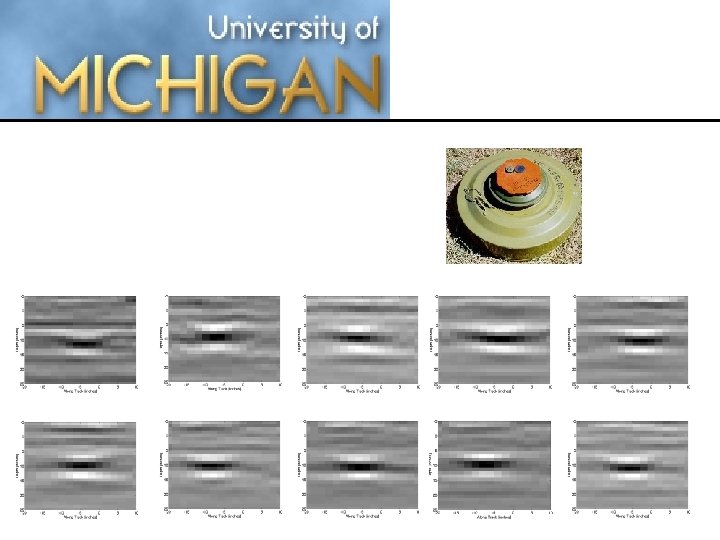
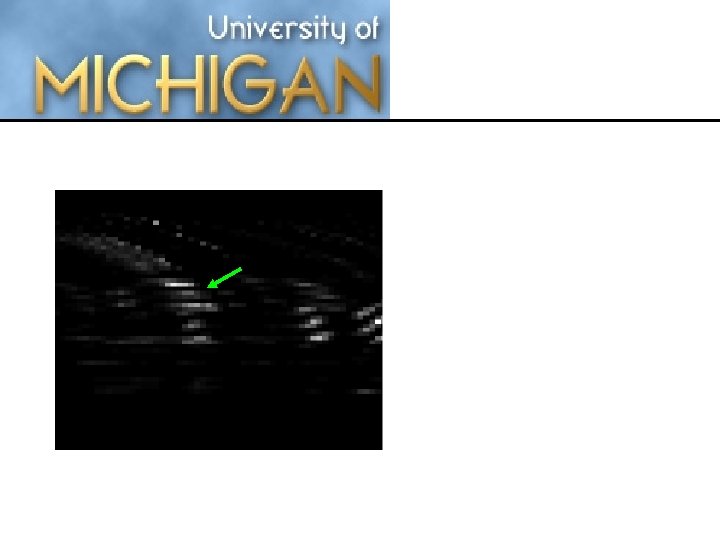
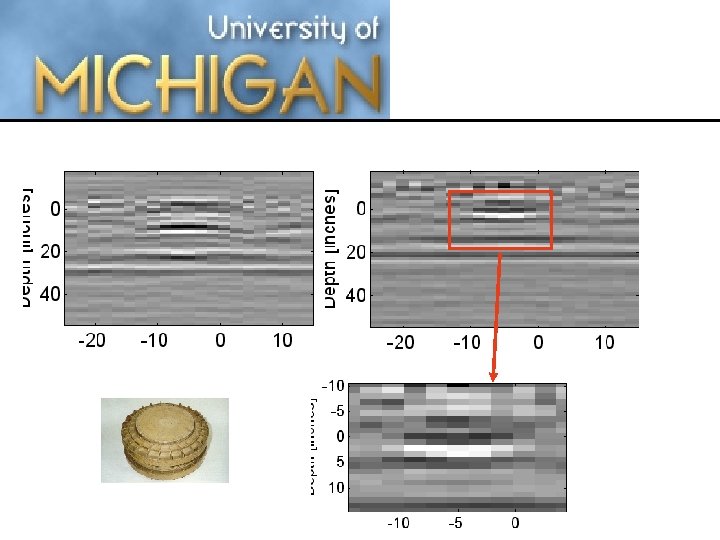
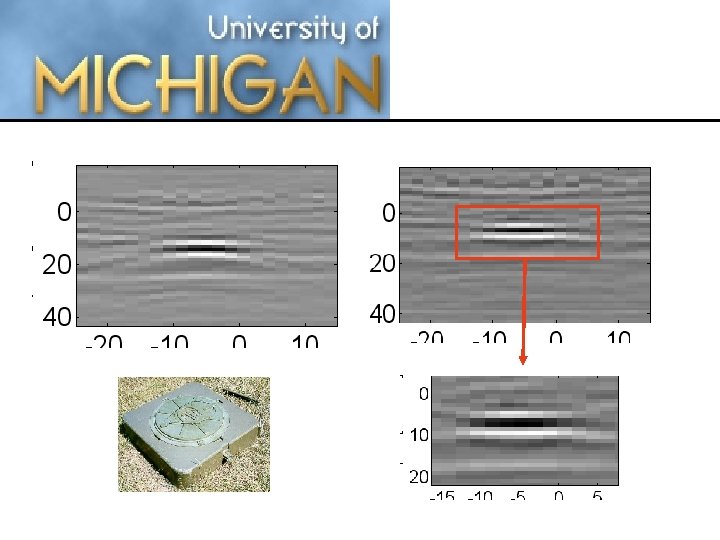
Imaged signature shows reflections from the top and bottom of the landmine. Length of the object can now be estimated from the length of the top and bottom reflections. Height of the object can be estimated from the distance between the two reflections. Depth has been calibrated during the imaging process.

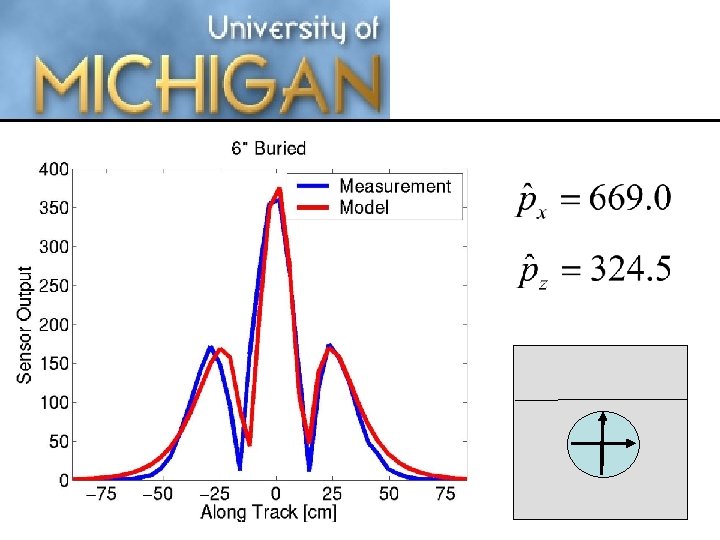
Image Estimated Depth and Size Depth: Length: Height: 5. 7” 11. 3” 6. 8” Ground Truth Depth: Length: Height: 6” 13” 6” (Dry Clay) About 3 res. cells across target in depth.

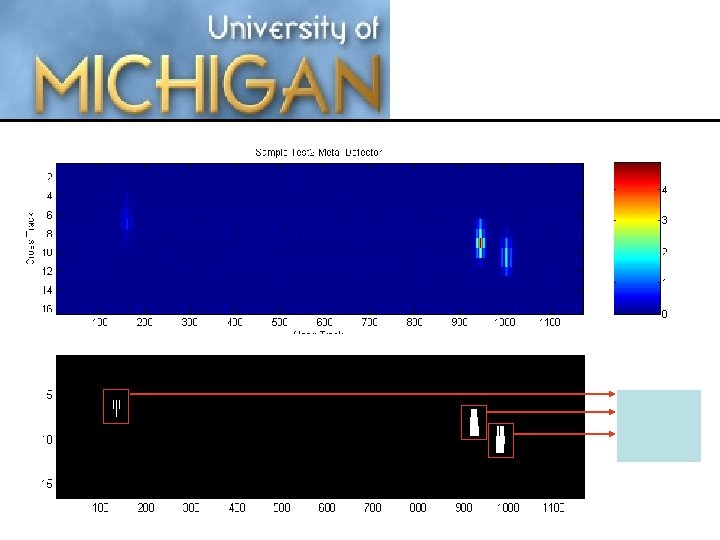
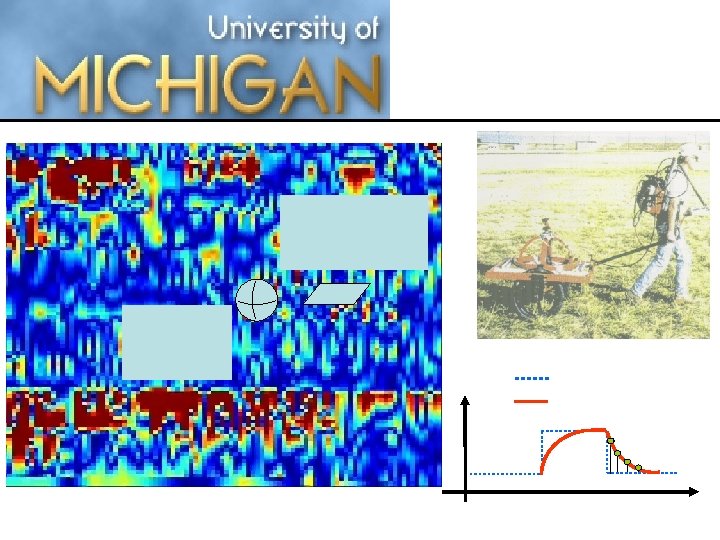
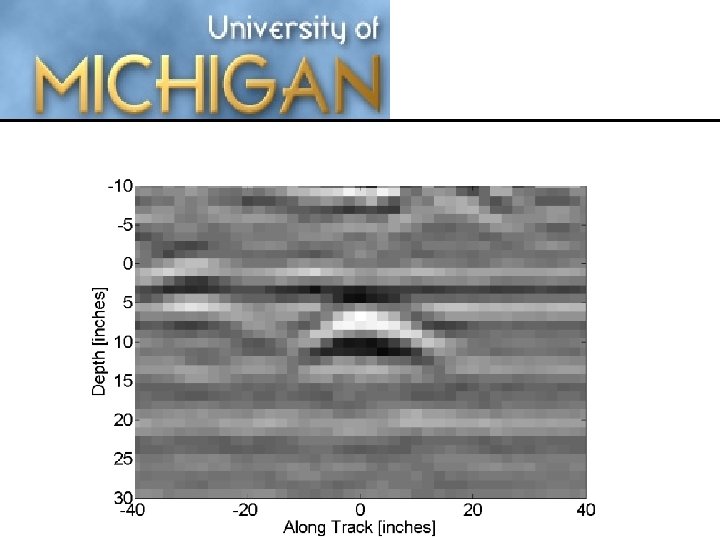
Objects Reported Four objects are identified by setting a threshold and clustering connected pixels. Objects 1 and 2 are clearly above the ground and can be eliminated. Objects 3 and 4 are the top and bottom reflections.

Objects Reported Length is estimated by averaging the lengths of the two reflections. (Est. Length: 11. 3”) Height is the distance between the two reflections. (Est. Height: 6. 8”) Depth is the distance from the ground surface (0”) to the top reflection. (Est. Depth: 5. 7”)

1 2 3 4 12 11. 3 18 6. 8 6. 7 5. 6 5 6 7 8 9 10 14 11. 3 10. 7 9. 3 11. 3 10. 7 6. 8 5. 7 6. 8 6. 7 6. 7


Depth Height Length


1/y

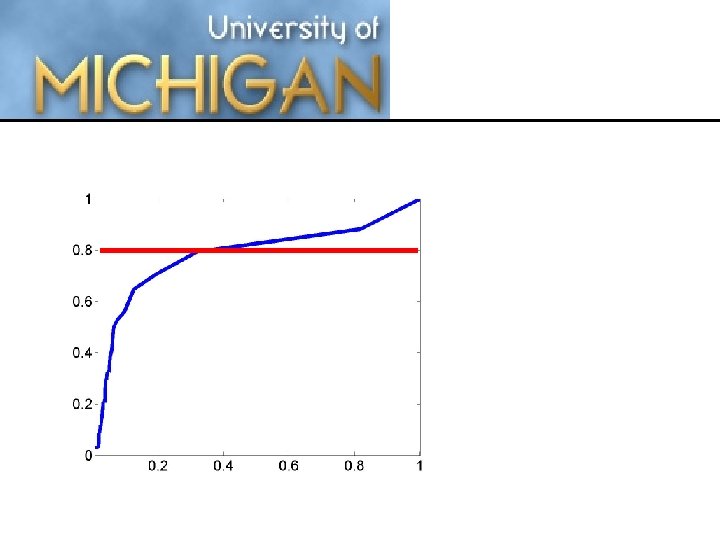
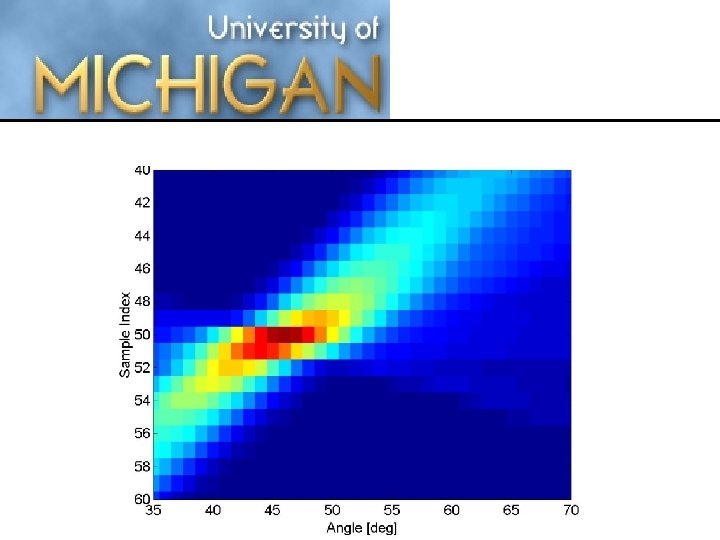
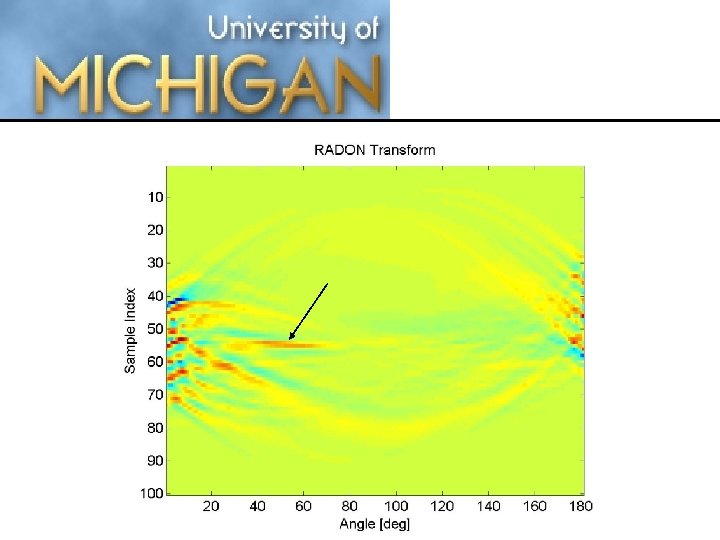
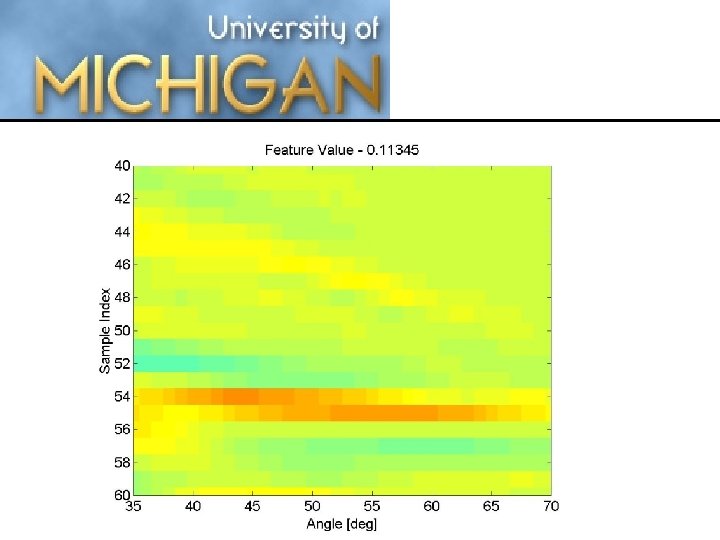
The RADON transform creates “projections” by summing along lines. Projections are oriented for 0° to 180°. Radon Transform of the Radon Transform illustration “flattened” hyperbola has shows a projection for 120°a strong maximum at 45° from a circle. corresponding to the “energy” contained in the hyperbola.

Depth? Height Length


325729e302399a0b1ae2793490841a0e.ppt