6f1c1f3d856dc33ab69976844cd01930.ppt
- Количество слайдов: 119


Global Airlines Industry - Raymond and Leo British Airways - Billy Delta Airlines - Trevor Singapore Airlines - Herman

Presentation Agenda • Airline Industry Overview • State of the Industry • Traffic and Economics • Regional Summaries • Analysis of British Airways Delta Airlines Singapore Airlines

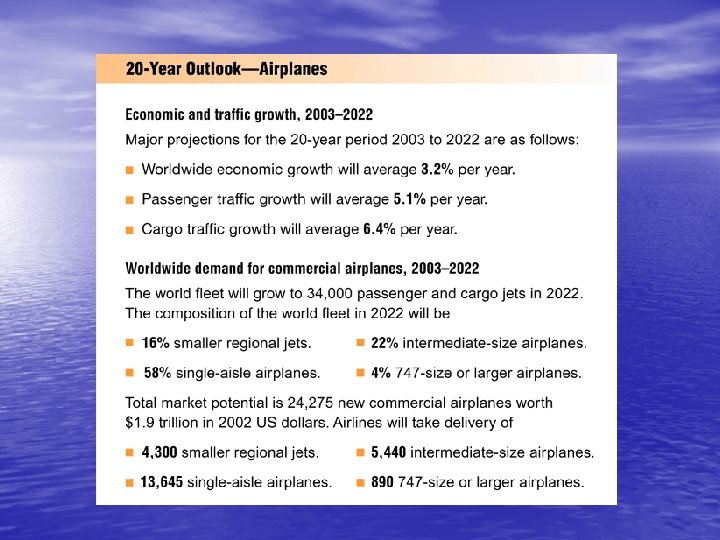
Airline Industry Overview • Economy grows, travel grows • Current short-term cycle is severe RPKs negative growth SARS virus • Long-term forecast remains healthy Economies will grow 3. 2% annually Air travel will be 5. 1% • Industry deregulation stimulates air travel New routes and more frequencies • Economic and traffic growth rates vary by region

State of Industry Air Traffic Cycles Long-term Trend

Air Travel Cycles • Annual negative world traffic growth – In 1991 and in 2001 -2002

Air Travel Cycles Cont’… • Long-term trends remain healthy • Drivers for long-term air travel growth Economic growth Globalization of trade Airline network service improvements Declining fares Deregulation and liberalization

Air Travel Cycles Cont’… • In short term, air travel is more volatile Consumer confidence Business profits Depressed income High-technology stock market “bubble” September 11 Outbreak of SARS

Long-term Trend
")
Long-term Trend Cont’… • Keys: Forecast shows 5% fewer world RPKs (Revenue per kilos) at the end of 20 years than without this unusual short-term cycle Yet, air travel growth will continue the pace at 5. 1% annually

Traffic and Economics

Economic and Traffic Forecast • World GDP is forecast to grow by 3. 2% over the next 20 years • Mature economies, GDP growth will average between 2~3% • Emerging economies, GDP growth may average over 4%

Forecast Cont’…

Regional Summaries

European Airline Industry

Companies • Company in focus: British Airways – Others: • Air France • KLM • Lufthansa • Virgin Atlantic

Source: Air Transport Association

Industry Highlights – 2002/03 • Passengers – 13. 8 millions reduction • Breakeven Load Factor – 69. 4%; compared to a 69. 2% load factor • Profit – USD$0. 87 billions loss

Factors influencing the industry • SARS phenomenon • Iraqi War • Post 9/11 recovery phrase • External Shocks – Currency Appreciation – Security & Insurance

Source: Association of European Airlines

Competition • External – The US Airlines in the North Atlantic market • Internal – Substantially increased of no-frills competition in Europe • Ryanair, Easyjet, Go, bmibaby, Virgin Exp, etc • Consolidation & Alliances – Star, Oneworld, KLM/Northwest, Sky. Team

Regulatory Environment • Deregulation is a global trend – First stage of liberalization in European Airlines • European governments wants: – Low fares ØConsequence – Increased demand • Increased demand for infrastructure growth

Trends • Slow recovery • Mature economies with low growth rates • Continuation of liberalization • Growing international networks • Rise of “No-Frills” carriers

Source: Association of European Airlines

N. American Airline Industry

Companies • Company in focus: Delta Airlines – Others: • United Airlines • American Airlines • Southwest Airlines • Northwest Airlines

Industry Highlights – 2002/03 • Passengers – 17. 4 millions reduction • Breakeven Load Factor – Increased from 76. 7% to 81. 4%; compared to 72. 1% load factor • Profits (Loss) – USD$12. 1 billions loss

Factors influencing the industry • Post 9/11 recovery/syndrome – Customer avoidance of air travel • Government tax & Security policies • Insurance • Escalating fuel prices • Economic downturn • Iraq War and SARS phenomenon

Source: Air Transport Association

Competition • 85% of the passengers have more than 2 or more carriers • Growth of hub-and-spoke – Increased competition in small markets • Alliances • Star • Sky. Team • One. World

Regulatory Environment • Deregulations – Mature liberalization • Post 9/11 Financial Effect – Increase financial burden for airlines – Additional insurance costs • Increased tax burden

Source: Air Transport Association

Source: Air Transport Association

Trends • Slowly recovering • Mature economies with low growth rates • Low fares • Cost-cutting strategies • Efficient airline networks

Asian Airline Industry

Northeast Asia • Annual GDP growth is forecast at 2. 1% • This low rate is driven by Japan • Korea will grow at a faster rate than Japan • Air travel will grow above world average Globalization and liberalization Fully deregulation Air travel growth at 6. 2%

Northeast Asia Cont’… • Fragmentation will continue – North America will remain popular – Europe continues to grow

Southeast Asia • A mixture of countries at varying stages of economic growth • GDP is forecast to grow at 4. 7% annually over the next 20 years • The region is diverse Economic and cultural interchange

Southeast Asia Cont’… • Southeast Asia has strong cultural ties with both Europe and North America VRF (visiting friends and relatives) • Region with its natural resources and cultural attractions is forecast to develop as a leisure destination for Asia

Southwest Asia • GDP outlook is forecast to grow at 5. 5% • Subject to: Privatization Globalization Infrastructure Tourism development • Overall traffic growth of the region will average 7. 0%

Southwest Asia Cont’… • Traffic within Southwest • Asia will average 8. 7%, one of the world’s highest Encompasses several air travel markets Middle class travels for business Pilgrimage Tourists and VFR

China • GDP forecast of 5. 9% per year is the highest in the world • China is the fastest growing region Air travel expands at 7. 6% • World Trade Organization Globalization is a major driver

China Cont’… • Airline industry is modernizing Airline consolidation Infrastructure investment Network and fleet rationalization Participation in major alliances

Airlines Analysis
")
Stock Price: £ 224 £ 1=1. 68 US Dollar (Nov 7, 2003)

British Airways Background • British Airways is a public limited company • BA, is the leading airline in Europe • One of the biggest in the world • It manages almost 330 planes, 550 destinations in 133 • • countries BA has holdings in other airlines, such as the Australian, Quantas, and the Spanish Iberia. Major destinations are Europe, America, Africa, Australia, South Pacific and Middle East

British Airways • Strategies – Low-cost strategy • £ 650 m in cost saving by March 2003 • Reduced manpower by 4446 people – Corporate Mission • Low fare in UK domestic market • Greater use of e-technology for customers, staff and agents – Focus on business class passengers

British Airways • Main Competitors – Europe Market • Lufthansa and Air France are dominating the market – North America Market • United Airlines & Delta are dominating the market

British Airways • Alliance – Oneworld alliance • 8 airline members: – British Airways, Aer Lignus, American Airlines, Cathay Pacific, Finnair, lberia, Lan. Chile and Qantas.

SWOT Analysis • Strengths – – – Strong brand name Good reputation Reduce net debt • Weaknesses – – – Reduce boeing aircrafts Routes reduced Reduce service and flights Increase insurance cost Increase security cost Downturn in passenger demand – cutting flights to the US and the Middle East

SWOT Analysis • Opportunities – ‘Open skies’ between US and UK – Predict growth in Europe market • Threats – – – Economic weakness SARS Middle East developments – Price competition with other airlines in Europe

Financial Ratio

Financial Data • Total Revenue=$12, 147 i by 7. 8% • Total Expense=$7616 i by 10. 21 • Net Income=$72 h by 2. 39 • Net asset=$3, 592 h by 3% • Earnings per share=6. 7 • Operating margin=3. 8% h by 5. 1 pts • Net debt/total capital ratio=60. 7% i by 5. 3 pts

Operating Data • RPK= £ 100, 112 h by 5. 8% • ASK= £ 139, 132 i by 0. 9% • Passenger Load Factor=71. 9 h by 1. 5% • RTK= £ 14, 213 i by 2. 9% • ATK= £ 21, 328 i by 6. 7% • Overall Load Factor=66. 6 h by 4% • Passengers Carried(000)=38, 019 i by 5% • Tonnes of Cargo Carried(000)=764 h by 1. 2%

Stock Valuation 1 Year Price Chat 1 year price range: £ 85. 00 - £ 215. 75 Today’s stock price: £ 224

Stock Valuation

Balance Sheet • • • Total Asset=12900 Current Asset=2725 Total Liabilities=10626 Current Liabilities=2904 Total Shareholder Equity=2274

Income Statement

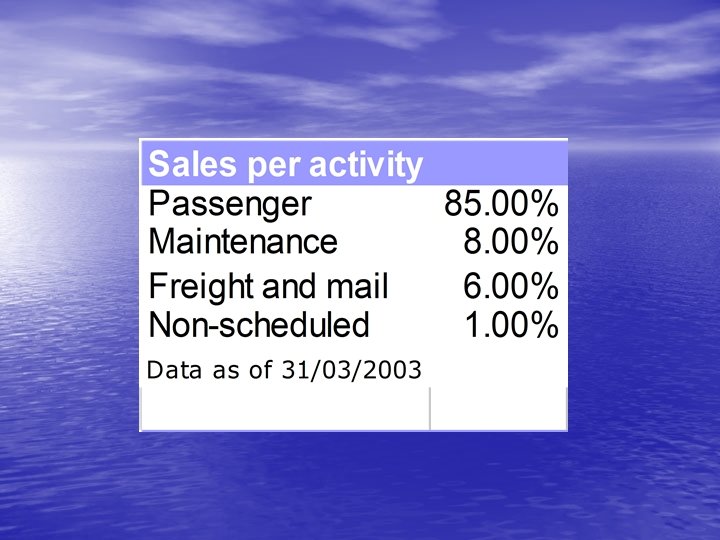
Revenue Composition

Cost Structure

Profits Over 5 Years

Earnings Per Share Over 5 Years

Cash Flow Statement • Cash and Cash Equivalents ( Net cash inflow for capital expenditure and financial investment + Net cash inflow/(outflow) for acquisitions and disposals = Cash used in financing)
: 7. 5 Avg Life")
British Airways • Fleet Valuation – – Avg Fleet age(yrs): 7. 5 Avg Life (yrs): 25 Depreciation Method: Straight-Line Avg Salvage Value: 0

Net MVA vs Mkt Cap Est fleet value = 21 US B Current assets =2. 725 B Total debt =5. 149 B Net MVA =18. 57 US B vs Mkt cap=2. 425 B Therefore, the assets are……undervalued

Recommendation Good News • Improved net income • Increased cash inflow • Reduced net debt • Decreased operating costs Recommendation: S-T: buy Bad News • Decreased in revenue • Downturn in passenger demand • Assets undervalued L-T: hold

Delta Airlines U. S. Carrier Nov. 5 / 03 Stock Price: $12. 89

Background Information • Founded – 1924 • Headquarters: Atlanta, Georgia • CEO: Leo F. Mullin • Employees: 70, 000+ • Daily Flights + Partners: 6, 130 • Destinations: 453 cities in 82 countries

Strategies • Build adequate liquidity • Significant reduction in costs • Become more competitive in the “low-fare” sector – Song, a highly competitive, wholly owned subsidiary

Competitors / Alliances Competitors • American Airlines • United Airlines • International Airline companies (minimal) Alliances • Atlantic Southeast Airlines • Comair, Inc. • Other Delta connection carriers • Skyteam Alliances • Codeshare partners

SWOT Strengths • Well positioned hub networks • Partners & Alliances • Good Employee Relations • Technological Innovation Weaknesses • Lower fairs due to high competition • Less demand due to 911 • Higher Expense

Map of Hub Network

SWOT Analysis Opportunities • Boston airport terminal project • More international flights and coverage Threats • Low-fare airline companies • Demand for air travel does not increase

Balance Sheet - Assets Period Ending Dec 31, 2002 Dec 31, 2001 Cash & Cash Equivalents $1, 969 $2, 210 Total Current Assets $3, 902 $3, 567 Property & Equipment $16, 524 $16, 097 Other Assets $4, 294 $3, 941 $24, 720 $23, 605 Total Assets

Balance Sheet - Liabilities Period Ending Dec 31, 2002 Dec 31, 2001 Total Current Liabilities $6, 455 $6, 403 Non-current Liabilities $16, 530 $12, 349 Total Liabilities $22, 985 $18, 752 Common Stock $271 $1, 639 $2, 930 ($1, 562) $25 $893 $3, 769 Retained Earnings Accumulated income (loss) Total Equity

Fleet / Net MV Assets Aircraft Type Owned Capital Lease Operating Lease Total Average Age B-727 -200 18 - 3 21 23. 5 B-737 -200 - 42 10 52 17. 8 B-737 -300 - - 26 26 16. 1 B-737 -800 71 - - 71 2. 2 B-757 -200 77 3 41 121 11. 3 B-767 -200 15 - - 15 19. 6 B-767 -300 4 - 24 28 12. 9 B-767 -300 ER 51 - 8 59 6. 9 B-767 -400 21 - - 21 1. 8 B-777 -200 8 - - 8 2. 9 MD-11 8 - 7 15 8. 9 MD-88 63 - 57 120 12. 5 MD-90 16 - - 16 7. 1 EMB-120 29 - - 29 11. 8 ATR-72 4 - 15 19 8. 5 CRJ-100/200 73 - 122 195 3. 7 CRJ-700 15 - - 15 0. 3 Total 473 45 313 831 9. 0
 Less: Total LT")
NMV Asset Evaluation Total Market Value of Owned Fleet (in millions) Less: Total LT Debt Add: Current Assets Total NMV of Assets (Not including investments) $14186 9576 3902 $8512 Delta’s market capitalization is sitting at 1. 65 billion, which is less than total NMV of assets which sits at 8. 5 billion. This shows that Delta’s equity is undervalued.

Income Statement - Revenue Period Ending Dec 31, 2002 Dec 31, 2001 $12, 321 $12, 964 Cargo $458 $506 Other $526 $409 $13, 305 $13, 879 Passenger Total Operating Income
")
Revenue Allocation (2002)

Income Statement - Expense Period Ending Dec 31, 2002 Dec 31, 2001 Salaries $6, 165 $6, 124 Aircraft Fuel $1, 683 $1, 817 Depreciation $1, 148 $1, 283 Contracted Services $1, 003 $1, 016 Other Expenses $3, 306 $3, 639 $13, 305 $13, 879 Total Operating Expense
")
Expense Allocation (2002)

Earnings Trend Operating Income Net Income

EPS Trend

Cash Flow Statement Net Cash from Operations Less: Net Cash from Investments Add: Net Cash from Financing Net Cash Inflow / Outflow $285 (1109) 583 $1977 Major Changes • Operations – Flight equipment less spending (2321) (922) • Investing – Boston Airport Terminal (485) 58 • Financing – Short Term Obligations 701 (1144)

Ratios Year 2002 Delta American United P/E Ratio N/A N/A P/BV Ratio 2. 37 N/A 0. 798 0. 712 0. 783 ROA (TTM) -3. 28% -5. 49% -16. 26% ROE (TTM) -66. 72% -351. 26% N/A Profit Margin (TTM) -6. 12% -9. 60% -27. 85% Operating Margin (TTM) -8. 75% -7. 56% -21. 02% Valuation Ratios Internal Liquidity Current Ratio (MRQ) Management Effectiveness Profitability Ratios
 102, 029 101, 717 Available")
Operating Data Year 2002 2001 Revenue Passenger Miles (mill) 102, 029 101, 717 Available Seat Miles (mill) 141, 719 147, 837 Passenger Load Factor 72. 0% 68. 8% Breakeven Passenger Load Factor 79. 0% 77. 3% Cargo Ton Miles (mill) 1, 405 1, 583 Fuel Gallons Consumed (mill) 2, 514 2, 649 Number of Aircraft in Fleet 831 814 Average Age of Aircraft (years) 9. 0 9. 1 75, 100 76, 300 Employees
 Last Trade 12. 89 Day’s Range 12.")
Stock Valuation Delta Air Lines (NYST: DAL) Last Trade 12. 89 Day’s Range 12. 68 – 13. 04 Trade Time Nov 5 / 03 52 wk Range 6. 56 – 16. 05 Change -0. 06 (0. 46%) Prev Close 12. 95 Open 12. 95 Bid N/A Ask N/A 1 y Target Est 19. 40 Volume 2, 421, 300 Avg Vol (3 m) 2, 505, 181 Market Cap 1. 59 B P/E (TTM) N/A EPS (TTM) -6. 741 Div & Yield N/A (N/A)

Stock Price Chart

Recommendation Hold – Moderate Buy • Undervalued according to NMV assets • High market share • No dividends & negative earnings • Very volatile industry

Today’s stock price: S$12. 50 Exchange rate: S$1 to US$0. 57

Background • Found in Oct. 1972 – Separated from Malaysian Airways • Started from 10 aircrafts flying 22 cities • Right now, spans over 90 cities globally with about 95 aircrafts • Singapore government owned 57% of shares

Background con’t • Ranking in 2002 – World 4 th largest airline in RPK – World 2 nd largest airline in freight carried

Alliances • Equity partner – acquired 49% shares of Virgin Atlantic Airways in March 2000 • Star Alliances – Joined in April 2000, become 11 th members with such as Air Canada, United Airline, Lufthansa, Thai Airline, ANA Airways.

Competitors • Cathay Pacific • Japan Airlines • Malaysian Airlines
 –")
SWOT Analysis • Strengths: – Low debt (debt to equity traditionally <0. 1) – Encourage employees’ motivation • Profit-sharing program – Young aircraft , average of 5 years old – Excellent in-flight services • e. g. : free drinks, complimentary headsets…

SWOT Analysis con’t • Weakness: – Relied on long haul flight – Located in SARS outbreak area

SWOT Analysis con’t • Opportunities: – Work with partners – Demand increase – Competitors’ struggle

SWOT Analysis con’t • Threats: – Global economic weakness – SARS comeback again – Fuel cost increase – terrorism

Strategies • Cost cutting – No-pay leave – Wage cuts – Reduction in staff – Less flying allowance paid – Postpone profit-sharing bonus • Assets selling – sold 5 Pratt and Whitney engines finance corp.

Strategies con’t • New route developing – Bangalore – Shenzhen – L. A. • Re-Fleeting plans – Combination of Air-Bus and Boeing • Price cutting, promotion, flights adding

Balance sheet

Earning per share

Operating profit

Cost structure

Income statement

Income statement con’t

Cash flow statement

Operating data

Operating data con’t

Operating data con’t

Ratios

Stock valuation • Ticker: SIAL. SI • Trade in Singapore Stock Exchange • Shares issued (as at 30 SEP 03): 1. 22 B

Stock valuation con’t

5 -year price chart

1 -year price chart

Recommendation • Moderate Buy – Good management – Recover so fast – Low debt – Volatile stock, but upward trend
6f1c1f3d856dc33ab69976844cd01930.ppt