

Geoinformation systems.pptx
- Количество слайдов: 17
 Geographic Information Systems
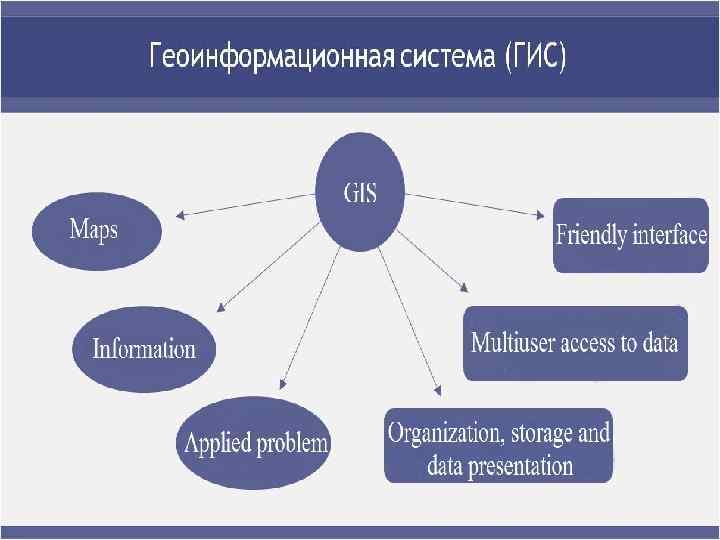
 • A system of information and analysis with the elements") GIS (Geographic Information System) • A system of information and analysis with the elements of geographical science. • A system that uses maps and images to analyze and sort the information.
GIS (Geographic Information System) • A system of information and analysis with the elements of geographical science. • A system that uses maps and images to analyze and sort the information.
 What can we create with a help of GIS? • Topological maps • Historical maps • Hydrological modelling • Cartographic modelling • GPS in cars • Geostatistics Etc.
 • Clock") Which tools can we use to create GIS? • Sextant (gives latitude) • Clock (gives longitude) • Compass • Tables • Maps New technologies: • GPS and laser rangefinder • Depicted hardware (field-map technology) http: //www. flickr. com/photos/library_of_congress/2179864672/
Which tools can we use to create GIS? • Sextant (gives latitude) • Clock (gives longitude) • Compass • Tables • Maps New technologies: • GPS and laser rangefinder • Depicted hardware (field-map technology) http: //www. flickr. com/photos/library_of_congress/2179864672/
 Where do people use GIS? • • • GPS in car for navigation Google maps Any map (electronic or paper) Class projects Geocaching Detection of geolocation in modern applications Genealogy – trace the routes of your ancestors Crime by location in a city Weather and climate Demographics and human interest Districts and neighborhoods
 Some examples… • Weather prediction
 • Migration map
 • Some interesting statistics
 William Rankin • GIS can be used to visualize complex or abstract correlations between any type of information with a geographic component. • “Deciding to learn GIS to make a single map would be kind of like saying you want to learn Excel to make one graph”William Rankin, history professor
 Red Highlight for the cholera cases Make the circle size Add Blue for the water sources
 GIS for interactive urban design • http: //www. youtube. com/watch? v=xb. VNbw. N 5 b. I k&feature=player_embedded
 Larsen ‘C’ Ice Shelf • Shows how the glacier has been shrinking
 All map projections have distortion
 Latitudes are straight
 Latitude lines are curve
 Thank you for attention!