

a580537e116a3121354bfc136d0a9f7b.ppt
- Количество слайдов: 71
 SGO 1910 & SGO 4930 Vår 2004 Foreleser: Karen O’Brien (karen.") Geografiske informasjonssystemer (GIS) SGO 1910 & SGO 4930 Vår 2004 Foreleser: Karen O’Brien (karen. obrien@cicero. uio. no) Seminarleder: Gunnar Berglund (gunnarbe@student. sv. uio. no)
Geografiske informasjonssystemer (GIS) SGO 1910 & SGO 4930 Vår 2004 Foreleser: Karen O’Brien (karen. obrien@cicero. uio. no) Seminarleder: Gunnar Berglund (gunnarbe@student. sv. uio. no)
 Announcements • Office hours next Tuesday: 9. 30 -11. 30 • Midterm Quiz 1 next week (13. 15 – 14. 00) • Lecture follows (14. 15 – 15. 00) • GIS Labs start next week. (Make sure you are signed up for one, and have a Ui. O computer account!) • Questions about home pages?
 Quick review: § Geographic information contains either an explicit geographic reference (such as latitude and longitude coordinates), or an implicit reference such as an address, road name, or postal code. § Geographic references allow you to locate features for analysis. © John Wiley & Sons Ltd
 Types of georeferences: • Addresses • Postal codes • Placenames • Linear referencing • Cadasters • Longitude and latitude
 Geographic Coordinates § Geographic coordinates are the earth's latitude and § § longitude system, ranging from 90 degrees south to 90 degrees north in latitude and 180 degrees west to 180 degrees east in longitude. A line with a constant latitude running east to west is called a parallel. A line with constant longitude running from the north pole to the south pole is called a meridian. The zero-longitude meridian is called the prime meridian and passes through Greenwich, England. A grid of parallels and meridians shown as lines on a map is called a graticule.
 Cartography and GIS § Understanding the way maps are encoded to be used in GIS requires knowledge of cartography. § Cartography is the science that deals with the construction, use, and principles behind maps.
 Distortions § Any projection must distort the Earth in some § way Two types of projections are important in GIS – Conformal property: Shapes of small features are preserved: anywhere on the projection the distortion is the same in all directions – Equal area property: Shapes are distorted, but features have the correct area – Both types of projections will generally distort distances
 “no flat map can be both equivalent and conformal. ”
 The “Unprojected” Projection • Assign latitude to the y axis and longitude to the x axis – A type of cylindrical projection – Is neither conformal nor equal area – As latitude increases, lines of longitude are much closer together on the Earth, but are the same distance apart on the projection – Also known as the Plate Carrée or Cylindrical Equidistant Projection
 Projection § A type of cylindrical projection § Implemented") The Universal Transverse Mercator (UTM) Projection § A type of cylindrical projection § Implemented as an internationally standard coordinate system – Initially devised as a military standard § Uses a system of 60 zones – Maximum distortion is 0. 04% § Transverse Mercator because the cylinder is wrapped around the Poles, not the Equator § Note: UTM zone numbers designate individual 6° wide longitudinal strips extending from 80° South latitude to 84° North latitude.
The Universal Transverse Mercator (UTM) Projection § A type of cylindrical projection § Implemented as an internationally standard coordinate system – Initially devised as a military standard § Uses a system of 60 zones – Maximum distortion is 0. 04% § Transverse Mercator because the cylinder is wrapped around the Poles, not the Equator § Note: UTM zone numbers designate individual 6° wide longitudinal strips extending from 80° South latitude to 84° North latitude.
 Zones are each six degrees of longitude, numbered as shown at the top, from W to E
 • Circumference of the earth is 40, 075. 16 kilometers • There are 60 UTM zones each 6 o wide. The distance covered by each zone at the equator is 1, 000 km. Zones overlap! • Each central meridian is assigned a false easting of 500, 000 m, so that all eastings have positive numbers.
 GIS Capability • A GIS package should be able to move between – map projections, – coordinate systems, – datums, and – ellipsoids.
 The Nature of Geographic Data (Or how phenomena vary across space, and the general nature of geographic variation) (Key concepts from Longley et al Chapter 5)
 Principal objective of GIS analysis: • Understanding how operational and strategic decisions are structured over space.
 • Space and time define the geographic context of our past actions, and set geographic limits of new decisions (condition what we know, what we perceive to be our options, and how we choose among them) • Consider the role of globalization in defining new patterns of behavior
 Fundamental problem in GIS: • Identifying what to leave in and what to take out of digital representations. • The scale or level of detail at which we seek to represent reality often determines whether spatial and temporal phenomena appear regular or irregular. • The spatial heterogeneity of data also influences this regularity or irregularity.
 Tobler’s First Law of Geography • Everything is related to everything else, but near things are more related than distant things.
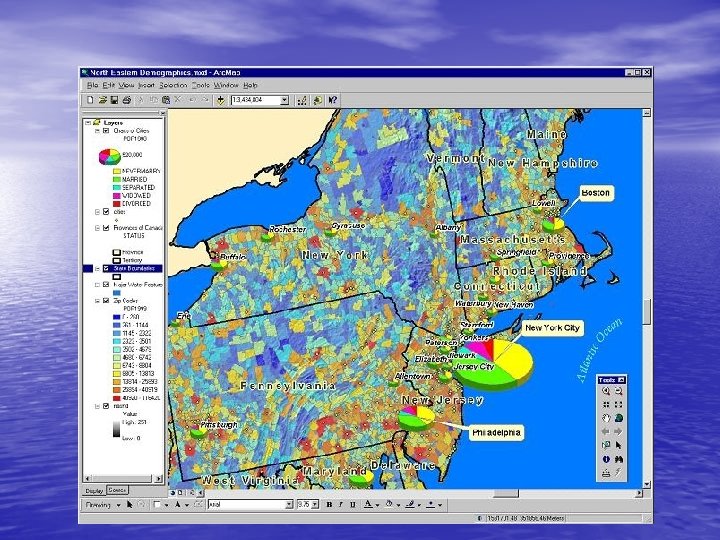
 Spatial Autocorrelation • The degree to which near and more distant things are interrelated. Measures of spatial autocorrelation attempt to deal simultaneously with similarities in the location of spatial objects and their attributes. (not to be confused with temporal autocorrelation) Example: GDP data
 Spatial autocorrelation: • Can help to generalize from sample observations to build spatial representations • Can frustrate many conventional methods and techniques that tell us about the relatedness of events.
 The scale and spatial structure of a particular application suggest ways in which we should sample geographic reality, and the ways in which we should interpolate between sample observations in order to build our representation.
 Types of Attributes • Nominal, e. g. land cover class • Ordinal, e. g. a ranking • Interval, e. g. Celsius temperature – Differences make sense • Ratio, e. g. weight – Ratios make sense • Cyclic, e. g. wind direction
 Cyclic Attributes • Do not behave as other attributes – What is the average of two compass bearings, e. g. 350 and 10? • Occur commonly in GIS – – – Wind direction Slope aspect Flow direction • Special methods are needed to handle and analyze
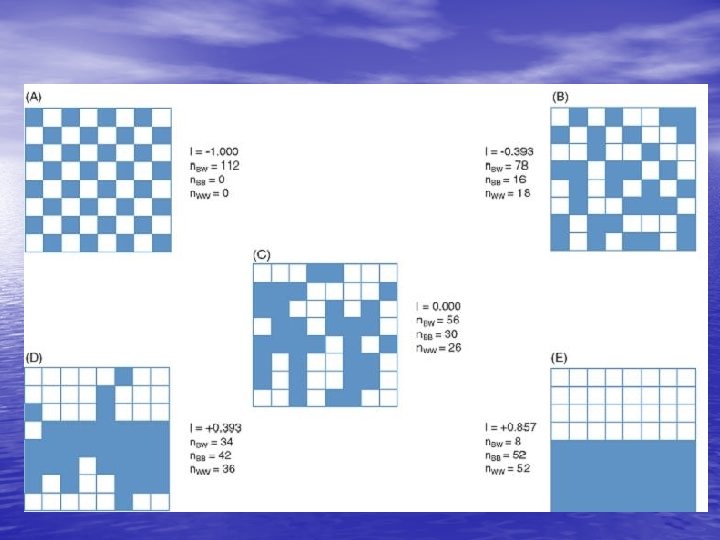
") Types of spatial autocorrelation • Positive (features similar in location are similar in attribute) • Negative (features similar in location are very different) • Zero (attributes are independent of location)
Types of spatial autocorrelation • Positive (features similar in location are similar in attribute) • Negative (features similar in location are very different) • Zero (attributes are independent of location)
 • The issue of sampling interval is of direct importance in the measurement of spatial autocorrelation, because spatial events and occurances can conform to spatial structure (e. g. Central Place Theorem). • Note: it is also important in the measurement of temporal autocorrelation

 • Probability") Spatial Sampling • Sample frames (“the universe of eligible elements of interest”) • Probability of selection • All geographic representations are samples • Geographic data are only as good as the sampling scheme used to create them
Spatial Sampling • Sample frames (“the universe of eligible elements of interest”) • Probability of selection • All geographic representations are samples • Geographic data are only as good as the sampling scheme used to create them
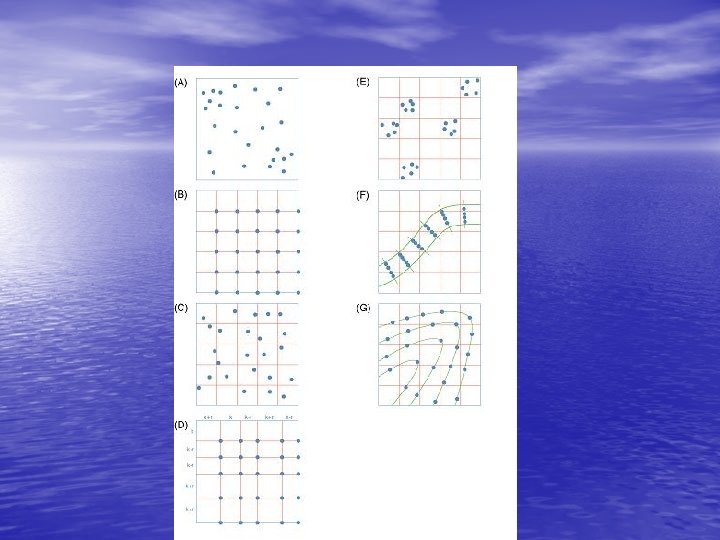
 –") Sample Designs • Types of samples – Random samples (based on probability theory) – Stratified samples (insure evenness of coverage) – Clustered samples (a microcosm of surrounding conditions) • Weighting of observations (if spatial structure is known)
Sample Designs • Types of samples – Random samples (based on probability theory) – Stratified samples (insure evenness of coverage) – Clustered samples (a microcosm of surrounding conditions) • Weighting of observations (if spatial structure is known)
 Spatial Interpolation • Judgment is required to fill in the gaps between the observations that make up a representation. • To do this requires an understanding of the effect of increasing distance between sample observations
 Spatial Interpolation • Specifying the likely distance decay – linear: wij = -b dij – negative power: wij = dij-b – negative exponential: wij = e-bdij • Isotropic (uniform in every direction) and regular – relevance to all geographic phenomena?
 Key point: • An understanding of the spatial structure of geographic phenomena helps us to choose a good sampling strategy, to use the best or most appropriate means of interpolating between sampled points, and to build the best spatial representation for a particular purpose.
 Note: • You are not expected to know the details in sections 5. 6, 5. 7 and 5. 8. • But do read boxes 5. 4 and 5. 5!
 Spatial Autocorrelation Measures • Spatial autocorrelation measures: – Geary and Moran; nature of observations • Establishing dependence in space: regression analysis – – Y = f (X 1, X 2 , X 3 , . . . , XK) + ε Yi = f (Xi 1, Xi 2 , Xi 3 , . . . , Xi. K) + εi Yi = b 0 + b 1 Xi 1 + b 2 Xi 2 + b 3 Xi 3 +. . . b. K Xi. K + εi
 Discontinuous Variation • Fractal geometry – Self-similarity – Scale dependent measurement – Regression analysis of scale relations
 Consolidation • Induction and deduction • Representations build on our understanding of spatial and temporal structures • Spatial is special, and geographic data have a unique nature

 Data Acquisition: Getting the Map into the Computer
 GIS maps are digital • Real maps: traditional paper maps that can be touched • Virtual maps: an arrangement of information inside the computer; the GIS can be used to generate the map however and whenever necessary.
 GIS Data Conversion • Traditionally the most time-consuming and expensive part of a GIS project • Involves a one-time cost • Digital maps can be reused and shared. • Requires maintenance (eg. updating)
 GIS data can be • Purchased. • Found from existing sources in digital form. • Captured from analog maps by GEOCODING.
 Finding Existing Map Data • Map libraries • Reference books • State and local agencies • Federal agencies • Commercial data suppliers
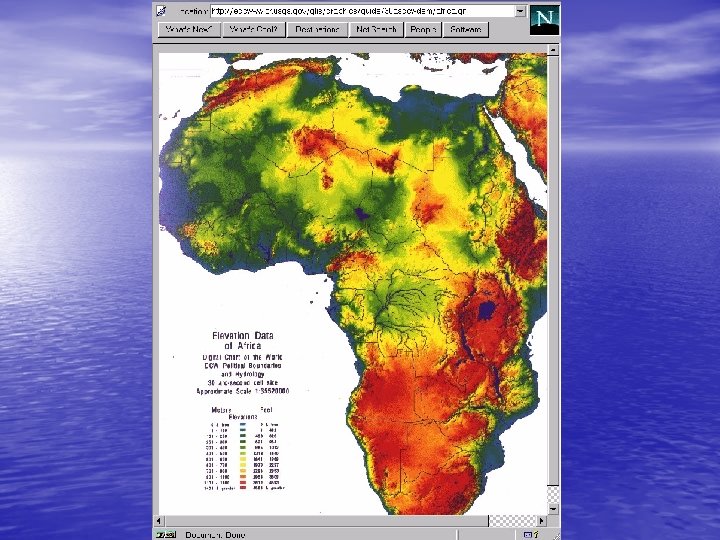
 Existing Map Data • Existing map data can be found through a map library, via network searches, or on media such as CD-ROM and disk. • Many major data providers make their data available via the Internet.
 Statenskartverk http: //ngis. statkart. no/katalog/java/katalog. asp • Rasterdata • Temakart • Vektordata • Primærdata • Prosjekter
 Data Collection • One of most expensive GIS activities • Many diverse sources • Two broad types of collection – Data capture (direct collection) – Data transfer • Two broad capture methods – Primary (direct measurement) – Secondary (indirect derivation)
 Data Collection Techniques Raster Primary Vector GPS measurements Digital aerial photographs Secondary Digital remote sensing images Survey measurements Scanned maps Topographic surveys DEMs from maps Toponymy data sets from atlases
 GEOCODING • Geocoding is the conversion of spatial information into digital form. • Geocoding involves capturing the map, and sometimes also capturing the attributes.
 Primary Data Capture • Capture specifically for GIS use • Raster – remote sensing – e. g. SPOT and IKONOS satellites and aerial photography – Passive and active sensors • Resolution is key consideration – – – Spatial Spectral Temporal
 Secondary Geographic Data Capture • Data collected for other purposes can be converted for use in GIS • Raster conversion – Scanning of maps, aerial photographs, documents, etc – Important scanning parameters are spatial and spectral (bit depth) resolution
 Vector Primary Data Capture • Surveying – Locations of objects determines by angle and distance measurements from known locations – Uses expensive field equipment and crews – Most accurate method for large scale, small areas • GPS – Collection of satellites used to fix locations on Earth’s surface – Differential GPS used to improve accuracy
 Vector Secondary Data Capture • Collection of vector objects from maps, • photographs, plans, etc. Digitizing – Manual (table) – Heads-up and vectorization • Photogrammetry – the science and technology of • making measurements from photographs, etc. COGO – Coordinate Geometry
 Managing Data Capture Projects • Key principles – Clear plan, adequate resources, appropriate funding, and sufficient time • Fundamental tradeoff between – Quality, speed and price • Two strategies – Incremental – ‘Blitzkrieg’ (all at once) • Alternative resource options – In house – Specialist external agency
 Summary • Data collection is very expensive, time • • consuming, tedious and error prone Good procedures required for large scale collection projects Main techniques – Primary • Raster – e. g. remote sensing • Vector – e. g. field survey – Secondary • Raster – e. g. scanning • Vector – e. g. table digitizing
 Digitizing • Captures map data by tracing lines from a map by hand • Uses a cursor and an electronicallysensitive tablet • Result is a string of points with (x, y) values
 Digitizer
 The Digitizing Tablet map Pulse is picked up by nearest grid wires under tablet surface. Result is sent to computer after conversion to x and y units. Digitizer cursor transmits a pulse from an electomagnetic coil under the view lens.
 Digitizing • Stable base map • Fix to tablet • Digitize control • Determine coordinate transformation • Trace features • Proof plot • Edit • Clean and build
 Selecting points to digitize
 Scanner
 Scanning • Places a map on a glass plate, and passes a light beam over it • Measures the reflected light intensity • Result is a grid of pixels • Image size and resolution are important • Features can “drop out”
 Scanning example
 Field data collection
 Pen Portable PC and GPS
 Data Transfer • Buy v build is an important question • Many widely distributed sources of GI • Key catalogs include – US NSDI Clearinghouse network – Geography Network • Access technologies – Translation – Direct read
 Attribute data • Logically can be thought of as in a flat file • Table with rows and columns • Attributes by records • Entries called values.
 Database Management Systems • Data definition module sets constraints on the attribute • • values Data entry module to enter and correct values Data management system for storage and retrieval Data definitions can be listed as a data dictionary Database manager checks values with this dictionary, enforcing data validation.
 The Role of Error • Map and attribute data errors are the data producer's responsibility, but the GIS user must understand error. • Accuracy and precision of map and attribute data in a GIS affect all other operations, especially when maps are compared across scales.