

f0fcad6612ab4ee14a7451baf10c55e3.ppt
- Количество слайдов: 74
 Gene expression analyses Dr Nikola Tanić
 RNA Extraction • Obtaining high quality RNA is the 1 st and most important step • Isolate RNA from other cellular components in the sample • Remove inhibitory substances • Inactivate endogenous RNases in specimen
 Precautions for working with RNA • RNA is not a stable molecule! – It is easily degraded by RNase enzymes. • Use sterile, disposable plastic ware (tubes, filter tips) marked “For RNA Use Only”. • Always wear gloves and work in a hood whenever possible/practical. • Treat liquids with DEPC, except Trisbased buffers.
 Basic Steps in Isolating RNA • Denature/digest proteins • Separate proteins, DNA, and contaminants from RNA • Precipitate RNA if necessary • Resuspend RNA in final buffer
 RNA Isolation Methods Cesium Chloride Gradient • Used mainly to get clean RNA for Northern blots • Homogenize cells in guanidinium isothiocyanate and b-mercaptoethanol solution. • Add to Cs. Cl gradient and centrifuge for 12– 20 hours; RNA will be at the bottom of tube. • Re-dissolve in TE/SDS buffer. • Precipitate RNA with salt and ethanol, then rehydrate. • Advantage: high quality • Disadvantages: extremely time-consuming, hazardous materials disposal issues
 RNA Isolation Methods Guanidinium-based Organic Isolation • Phenol/guanidinium solution disrupts cells, solubilizes cell components, but maintains integrity of RNA. • Add chloroform, mix, and centrifuge. • Proteins/DNA remain at interface. • RNA is removed with aqueous top layer. • RNA is precipitated with alcohol and rehydrated. • Advantage: faster than Cs. Cl method • Disadvantages: fume hood required, hazardous waste disposal issues
 RNA Isolation Methods Nonorganic Salt Precipitation • Cell membranes are lysed and proteins are denatured by detergent (such as SDS) in the presence of EDTA or other RNase inhibitors. • Proteins/DNA are precipitated with a high concentration salt solution. • RNA is precipitated with alcohol and rehydrated. • Advantages: – Fast and easy, nontoxic – Produces high quality RNA
 § Qiagen® silica column § Ambion® magnetic bead § Trizol® – monophasic organic solution
 AAAAA RT TTTTT RT AAAAA TTTTT AAAAA RT TTTTT Oligo d. T primer is bound to m. RNA Reverse transcriptase (RT) copies first c. DNA strand Reverse transcriptase digests and displaces m. RNA and copies second strand of c. DNA Double strand c. DNA Conversion of m. RNA to c. DNA by Reverse Transcription
 50º A. Double strand DNA 96º B. Denature 50º C. Anneal primers Taq D. Polymerase binds 72º Taq
 72º Taq Taq E. Copy strands Taq 1 96º First round of c. DNA synthesis (4 strands) 2 3 4 F. Denature
 Methods for detecting differential expression • • Comparisons of 2 samples Differential screening Subtractive hybridization Differential display Representational difference analysis (RDA; Wigler’s method) • Serial analysis of gene expression (SAGE) • Microarrays
 Microarray Background • Microarrays enable simultaneous measurement of the expression levels of thousands of genes in a sample • Microarray: – Glass slide with a matrix of thousands of spots printed on to it – Each spot contains probes which bind to a specific gene
 Demonstration http: //www. bio. davidson. edu/courses/genomics/chip. html
 Sample 1 Gene 1 1. 04 2. 08 Gene 2 3. 2 10. 5 Gene 3 3. 34 1. 05 Gene 4 • Sample 2 1. 85 0. 09 Microarray data is translated into an n x p table (p – number of genes, n – number of samples)
 Gene expression • c. DNA microarray • High-throughput analysis but • Cross-hybridization with related sequences - limited specificity • Low intensity signals are difficult to interpret - limited sensitivity • Low reproducibility • Needs validation with an alternate method
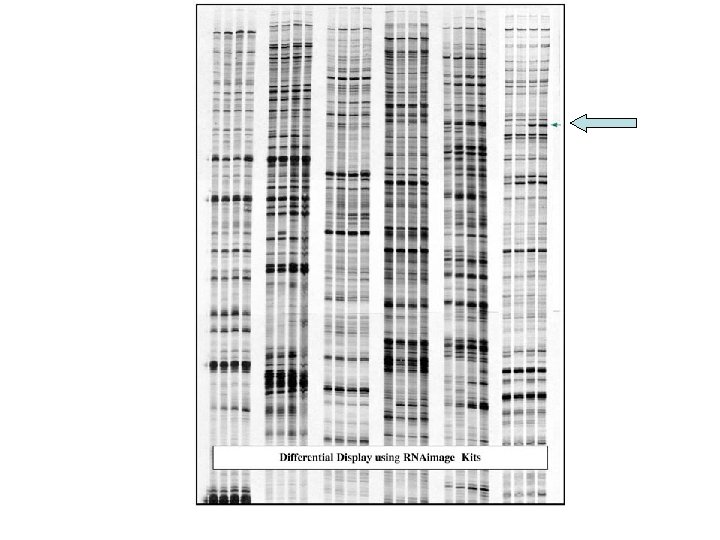
 Differential Display schematic representation Differential performance RNA isolation and RT PCR anchorprimer + arbitrary primer Denatured Polyacrylamide gel, 6 % Dry the gel A B DNAse treatment and RT with oligo d. T primer Differential display PCR with oligomer Side-by-side urea gel Pick the differentially displayed c. DNA bands and PCR amplification Cloning and Sequencing TA cloning or unidirectional cloning by adding RE sites
 Schematic representation of m. RNA Differential Display m. RNA population I. Reverse transcription II. PCR amplification Random 13 mer III. Denaturing polyacrylamide gel PCR products with 3’ end sequnce Differentially expressed gene
 Optimal arbitrary primers • Random primer • Use a limited number of short arbitrary primers in combination with the anchored oligo-d. T primers to systematically amplify and visualize most of the m. RNA • each primer will recognize 50 -100 m. RNA species (6 -8 mer, yet fail often, too short) • 9 to 13 mer is optimal
 Difference
") Gene expression – northern blotting – ribonuclease protection assay – RT-PCR (end point analysis) • • most sensitive can discriminate closely related m. RNAs technically simple but difficult to get truly quantitative results using conventional PCR • Real Time RT-PCR
Gene expression – northern blotting – ribonuclease protection assay – RT-PCR (end point analysis) • • most sensitive can discriminate closely related m. RNAs technically simple but difficult to get truly quantitative results using conventional PCR • Real Time RT-PCR
 Northern blot
 Ribonuclease Protection Assay
 Real Time PCR Principles & Chemistry Applications
 denaturation 95°C annealing 60°C 1 2 4 8 n cycles extension") Traditional PCR (semiquantitative) denaturation 95°C annealing 60°C 1 2 4 8 n cycles extension 72°C 2 n Gel electroforesis Specificity determined by 2 primers
Traditional PCR (semiquantitative) denaturation 95°C annealing 60°C 1 2 4 8 n cycles extension 72°C 2 n Gel electroforesis Specificity determined by 2 primers
 Polymerase Chain Reaction PCR Product Plateau phase Linear phase End point analysis on agarose gels Exponential phase Cycles
 Plateau phase Variable PCR Plateau (taq efficiency decreases, reagents get limiting,") Traditional PCR (semiquantitative) Plateau phase Variable PCR Plateau (taq efficiency decreases, reagents get limiting, decreased denaturation efficiency, …) Amplification Plot of 96 Sample Replicates Precise Ct Plateau phase
Traditional PCR (semiquantitative) Plateau phase Variable PCR Plateau (taq efficiency decreases, reagents get limiting, decreased denaturation efficiency, …) Amplification Plot of 96 Sample Replicates Precise Ct Plateau phase
 What is Real Time PCR? • Modification of conventional PCR where product accumulation is measured in real time, after each PCR cycle • This technique allows access to quantity and quality of DNA and RNA • Technique is fast, reproducible and accurate
 Principles of quantitative PCR -Monitors the progress of the PCR as it occurs (in “real time”) by reading fluorescence intensities after each cycle. Intensities are proportional to the number of amplicons generated -Samples are characterized by the point in time during cycling, when amplification is first detected (more starting material sooner an increase in fluorescence) -For allelic discrimination, endpoint assays are used Temperature protocol: also > 30 cycles 30” 95°C 30” 60°C 30” 72°C/60°C
 Exponential growth phase = linear part in logarithmic graphic 1 2 4 8 2 n cycles n
 CHEMISTRY • SYBR green • Taqman probes • Molecular Beacons • Scorpion primers
 How do we label PCR products? Taq. Man® probe based SYBR® Green dye based
 SYBR green I • intercalating dye, binds double strand DNA – More") CHEMISTRY 1) SYBR green I • intercalating dye, binds double strand DNA – More sensitive than Et. Br • Specificity determined by 2 primers • No probe required (lower costs) • Also detection of aspecific products melting curve after PCR reaction • Only singleplex • No allelic discrimination possible
CHEMISTRY 1) SYBR green I • intercalating dye, binds double strand DNA – More sensitive than Et. Br • Specificity determined by 2 primers • No probe required (lower costs) • Also detection of aspecific products melting curve after PCR reaction • Only singleplex • No allelic discrimination possible
 SYBR Green I chemistry Double stranded DNA Binding Dye Emits fluorescence only when binded to ds DNA
 SYBR® Green I Chemistry Polymerisation 5' Forward Primer 3' 5' 5' 3' Reverse Primer 5' Polymerisation completed 5' 3' 5'
 SYBR Green I dye assay chemistry - Screening, low cost chemistry - Lack of specificity requires dissociation curve analysis - can easily be “upgraded” to Taq. Man probe based assay
 Dissociation Curve Derivative Data View Target amplicon Tm = temperature when 50% dissociated
 Dissociation Curve Example: Presence of Primer Dimers Primer dimers or aspecific product Product
 Taqman probe • Two primers + a fluorogenic probe determine specificity •") CHEMISTRY 2) Taqman probe • Two primers + a fluorogenic probe determine specificity • No detection of aspecific products – No melting curve needed (faster) • Can be used for allelic discrimination • Multiplex • Synthesis of different probes required for different sequences
CHEMISTRY 2) Taqman probe • Two primers + a fluorogenic probe determine specificity • No detection of aspecific products – No melting curve needed (faster) • Can be used for allelic discrimination • Multiplex • Synthesis of different probes required for different sequences
 (Rhodamine) Energy transfer 5’ 3’ Fam Vic Tet") Taq. Man® Probe Reporter Quencher (Fluoresceine) (Rhodamine) Energy transfer 5’ 3’ Fam Vic Tet Phosphate group Laser excitation
Taq. Man® Probe Reporter Quencher (Fluoresceine) (Rhodamine) Energy transfer 5’ 3’ Fam Vic Tet Phosphate group Laser excitation
 (Rhodamine) Cleaved probe 5’ 3’ Fam Vic Tet") Taq. Man® probe Reporter Quencher (Fluoresceine) (Rhodamine) Cleaved probe 5’ 3’ Fam Vic Tet Fosfatna grupa Laser excitatioin
Taq. Man® probe Reporter Quencher (Fluoresceine) (Rhodamine) Cleaved probe 5’ 3’ Fam Vic Tet Fosfatna grupa Laser excitatioin
 Taqman probe Mechanism: fluorescence resonance energy transfer (FRET) Annealing and polymerization Strand") CHEMISTRY 2) Taqman probe Mechanism: fluorescence resonance energy transfer (FRET) Annealing and polymerization Strand displacement Cleavage (5’ nuclease activity of taq DNA polymerase) Increase of reporter signal proportional to amount of amplicon produced Cleavage Removes probe from target strand
CHEMISTRY 2) Taqman probe Mechanism: fluorescence resonance energy transfer (FRET) Annealing and polymerization Strand displacement Cleavage (5’ nuclease activity of taq DNA polymerase) Increase of reporter signal proportional to amount of amplicon produced Cleavage Removes probe from target strand
 Taqman probe Multiplex reactions possible • Reporters: FAM, TET, VIC, JOE •") CHEMISTRY 2) Taqman probe Multiplex reactions possible • Reporters: FAM, TET, VIC, JOE • Quenchers: TAMRA, MGB normalizes for non-PCR-related fluorescence fluctuations • Passive reference: ROX occurring well-to-well (concentration or volume differences) Emission Profiles of Various Fluorophores: Rox Fam Vic/ Joe Tamra Spectral compensation necessary
CHEMISTRY 2) Taqman probe Multiplex reactions possible • Reporters: FAM, TET, VIC, JOE • Quenchers: TAMRA, MGB normalizes for non-PCR-related fluorescence fluctuations • Passive reference: ROX occurring well-to-well (concentration or volume differences) Emission Profiles of Various Fluorophores: Rox Fam Vic/ Joe Tamra Spectral compensation necessary
 DEFINITIONS • • Baseline Threshold Rn Ct Baseline = Basal level of fluorescence defined during the initial cycles of PCR (background fluorescence). Threshold = Fixed fluorescence level set above the baseline (statistical cutoff based upon background fluorescence). Rn = normalized Reporter signal, level of fluorescence detected during PCR. Calculated by dividing probe reporter dye signal by passive reference signal (ROX). Ct = threshold Cycle, PCR cycle at which an increase in reporter fluorescence above a baseline signal is first detected (cycle when fluorescence crosses the threshold).
 determining Ct (threshold cycle) of each") DEFINITIONS • Setting baseline and threshold (exponential growth) determining Ct (threshold cycle) of each sample – Ct is the cycle number at which the fluorescence passes the threshold EXAMPLE GRAPHIC threshold baseline Ct Ct
DEFINITIONS • Setting baseline and threshold (exponential growth) determining Ct (threshold cycle) of each sample – Ct is the cycle number at which the fluorescence passes the threshold EXAMPLE GRAPHIC threshold baseline Ct Ct
 Advantages of using Real-Time PCR • COLLECTS DATA IN THE EXPONENTIAL GROWTH PHASE • REAL TIME: permanent record of amplification • INCREASED DYNAMIC RANGE of detection • LESS RNA NEEDED Requirement of 1000 -fold less RNA than conventional assays • FAST: No-post PCR processing • SENSIBLE: Detection is capable down to a 2 -fold change
 Advantages of real time detection • Ct is the most accurate and precise way to determine starting copy number • During exponential phase of PCR, there is no effect of limiting reagnets • Ct values are reproducible in reactions with same starting copy numbers • Use of Ct values expands the dynamic range of quantitation (at leaset 5 orders of magnitude)
 APPLICATIONS • Real time detection: – – Quantitation of gene expression Quantitation of RNA, DNA, c. DNA Viral quantitation … • Endpoint detection: – – Allelic discrimination (SNP genotyping) Plus/minus studies Pathogen detection …
 APPLICATIONS • Real time detection: – – Quantitation of gene expression Quantitation of RNA, DNA, c. DNA Viral quantitation … • Endpoint detection: – – Allelic discrimination (SNP genotyping) Plus/minus studies Pathogen detection …
: virus copy number, … 1. Calculation") Quantification – Absolute quantification (result in copy number): virus copy number, … 1. Calculation by standard curve – Relative quantification (result is given as relative to the reference sample): gene expression, … 2. Calculation by standard curve 3. Use of comparative Ct method
Quantification – Absolute quantification (result in copy number): virus copy number, … 1. Calculation by standard curve – Relative quantification (result is given as relative to the reference sample): gene expression, … 2. Calculation by standard curve 3. Use of comparative Ct method
 Absolute Quantitation: Standard Curve
 Standard curve Quantify sample by spectrofotometry, make dilution curve
 Standard curve Ct Ct= 29. 7 Log Qty = 3. 28 Log Qty
 Relative Quantitation: Standard Curve
 Endogenous control • The EC normalizes for – RNA input measurement errors – RT efficiency variations • There is no universal EC !!!! • The perfect endogenous control does not exist !!!!!! • ”House-keeping genes” EC’s
 Endogenous control • What is important ? • Constant expression level in all the biological samples that are used in the study! • The same kinetic of PCR reaction as target gene
 Relative quantitation: example • Cells: – Basal conditions – Treatment IL 6 3 h – Treatment OSM 3 h • Define expression of gene of interest (SOCS 3) upon treatment, relative to expression at basal conditions
 Relative Quantitation: ΔΔCt method
 ΔΔCt method Principle: Samples that differ by a factor of 2 in the original concentration would be theoretically expected to be 1 cycle apart. Samples that differ by a factor of 10 (as in our dilution series) would be ~3. 3 cycles apart. Example 1: Ct(A)= 30 Ct(B)= 31 RQ = 21 = 2 Relative Quantity = 2 CT (sample) - CT (basal) Example 2: RQ = 23. 3 Ct(A)= 30 Ct(B)= 33, 3 = 10
") BUT: ratio = calibrator 8 targ 4 ref fold change in target gene (sample) fold change in reference gene (sample) sample 12 targ 2 ref fold change in target gene (calibrator) fold change in reference gene (calibrator) CT(sample) = CT (Target) - CT (Reference) CT(calibrator) = CT (Target) - CT (Reference) CT = CT (Sample) - CT (Calibrator) -ΔΔCt Relative Quantity = 2
BUT: ratio = calibrator 8 targ 4 ref fold change in target gene (sample) fold change in reference gene (sample) sample 12 targ 2 ref fold change in target gene (calibrator) fold change in reference gene (calibrator) CT(sample) = CT (Target) - CT (Reference) CT(calibrator) = CT (Target) - CT (Reference) CT = CT (Sample) - CT (Calibrator) -ΔΔCt Relative Quantity = 2
 = CT (Target) - CT (Reference) CT(sample) Ct(ctrl") ΔΔCt method: Example 1: 1: CT(sample) = CT (Target) - CT (Reference) CT(sample) Ct(ctrl SOCS 3)= 27 -20 = 7 Ct(tr SOCS 3)= 24 -20 = 4 CT = CT (Sample) - CT (Calibrator) Ct = 4 – 7 = -3 Ct RQ = 23 = 8 Note: Also Ct(tr SOCS 3) – Ct(ctrl SOCS 3) = 27 -24= 3 because starting conc was equal (equal 18 S) SOCS 3 expression in treated sample is 8 times higher than in control sample. ctrl 18 S tr SOCS 3 ctrl SOCS 3 tr 18 S ctrl SOCS 3 tr SOCS 3
ΔΔCt method: Example 1: 1: CT(sample) = CT (Target) - CT (Reference) CT(sample) Ct(ctrl SOCS 3)= 27 -20 = 7 Ct(tr SOCS 3)= 24 -20 = 4 CT = CT (Sample) - CT (Calibrator) Ct = 4 – 7 = -3 Ct RQ = 23 = 8 Note: Also Ct(tr SOCS 3) – Ct(ctrl SOCS 3) = 27 -24= 3 because starting conc was equal (equal 18 S) SOCS 3 expression in treated sample is 8 times higher than in control sample. ctrl 18 S tr SOCS 3 ctrl SOCS 3 tr 18 S ctrl SOCS 3 tr SOCS 3
 = CT (Target) - CT (Reference) CT(sample) CT") ΔΔCt method: Example 2: 2: CT(sample) = CT (Target) - CT (Reference) CT(sample) CT = CT (Sample) - CT (Calibrator) ctrl 18 S tr SOCS 3 ctrl SOCS 3 Ct(ctrl SOCS 3)= 28 -16 = 12 Ct(tr SOCS 3)= 25 -13 = 12 Ct = 12 – 12 = 0 Ct RQ = 20 = 1 no difference in SOCS 3 expression in treated and control sample! tr 18 S ctrl SOCS 3 tr SOCS 3
ΔΔCt method: Example 2: 2: CT(sample) = CT (Target) - CT (Reference) CT(sample) CT = CT (Sample) - CT (Calibrator) ctrl 18 S tr SOCS 3 ctrl SOCS 3 Ct(ctrl SOCS 3)= 28 -16 = 12 Ct(tr SOCS 3)= 25 -13 = 12 Ct = 12 – 12 = 0 Ct RQ = 20 = 1 no difference in SOCS 3 expression in treated and control sample! tr 18 S ctrl SOCS 3 tr SOCS 3
 Relative expression of gap 43
 Relative expression of gap 43
 ΔΔCt method • no need for dilution series less material needed, faster BUT: amplification efficiency of target and endogenous control must be comparable
 Validation of efficiency Target 35 Target - equal efficiency or equal slopes for target and endogenous control - Acceptible slope = 3. 2 - 3. 8 (Efficiency 83 – 105 %) 30 y = - 4. 586 x + 24. 889 Effic = 67 % Endogenous control 20 y = - 3. 3683 x + 36. 009 Effic = 98 % t C Value 25 15 y = - 3. 3276 x + 27. 712 Effic = 100 % 10 0 2 4 Log [Input m. RNA] 6 8 10
 ΔΔCt method Does the target have a similar amplification efficiency to the endogenous control? NO Standard Curves YES Ct method
 APPLICATIONS • Real time detection: – – Quantitation of gene expression Quantitation of RNA, DNA, c. DNA Viral quantitation … • Endpoint detection: – – Allelic discrimination (SNP genotyping) Plus/minus studies Pathogen detection …
 Allelic") ALLELIC DISCRIMINATION End point detection End Point Real Time Assays +/Alelic Discrimination (SNPs) Allelic Discrimination (SNPs) Absolute Quantitation Relative Quantitation
ALLELIC DISCRIMINATION End point detection End Point Real Time Assays +/Alelic Discrimination (SNPs) Allelic Discrimination (SNPs) Absolute Quantitation Relative Quantitation
 ALLELIC DISCRIMINATION Principle: 2 primers, 2 probes FAM™-labelled probe is specific for Allele 1 VIC™-labelled probe is specific for Allele 2 Allele 1 FAM Tamra™ VIC Tamra Mismatch Perfect match Allele 2 FAM Mismatch Tamra VIC Tamra Perfect match
 ALLELIC DISCRIMINATION Mechanism • relies on competition between the two probes • Tm of the mismatched probe < Tm of perfectly matched probe Allele 1 VIC™ Tamra™ Incorrect Probe Tm = 55ºC Allele 1 FAM™ Tamra Correct Probe Tm = 65ºC Annealing/extension temperature of 60°C allows binding and cleavage of correct probe and destabilisation of incorrect probe
 ALLELIC DISCRIMINATION Typical output FAM VIC Allele 1 VIC Allele 2 FAM homozygote for allele 1 homozygote for allele 2 Allele 1&2 FAM VIC heterozygote
 ALLELIC DISCRIMINATION Typical output