GDP and GNP in South Korea Done by: Abdrakhman Aida Bolatova Bakhyt

GDP is value of production/ value of income produced within a domestic economy. GNP is value of income earned by residents of domestic economy. GNP = GDP + NFP Net factor payments is income earned from overseas sources by domestic residents less income earned from domestic sources by overseas residents.

The current account is, conceptually, the amount of income earned overseas less the amount of income earned by foreigners from the domestic economies: CA = NX + NFP. Current Account = Balance on Goods (Goods Exports-Goods Imports) + Balance on Services (Services Exports. Services Imports) + Net Investment Income (Investment Income Earned Overseas – Investment Income Paid to Foreigners) +Net Transfers (Donations from Overseas)


Population South Korea: 48, 422, 644 land area South km 2 Korea: 98, 190

Purchasing South Korea: GDP power parity GDP of 2010 925 billion US$ growth rate of 2009 South Korea: 4. 6%

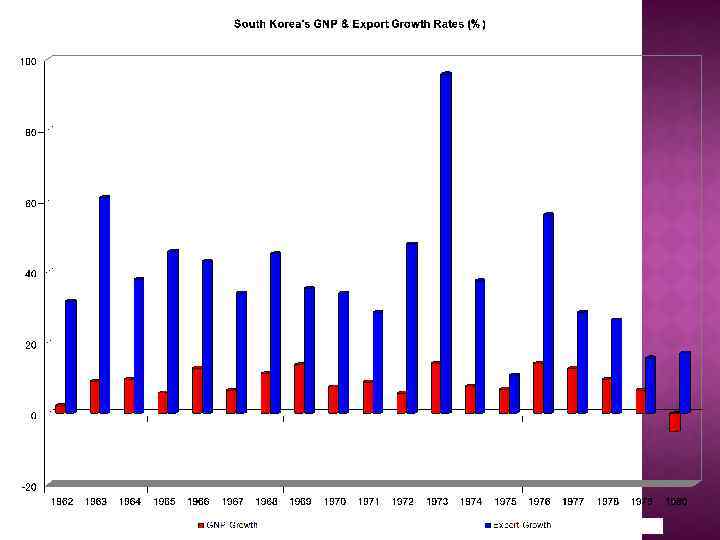
Military strongman rule from 1960 s to 1970 s South Korea Park Chung Hee (1962 -79)

Experience with Japan’s wartime economic management in Northeast China Economic Planning Board Ministry of Trade and Industry Ministry of Finance import substitution => export orientation normalization with Japan Vietnam War

Government owned and controlled all 5 commercial banks including the central bank (Bank of Korea) all 6 special banks 2 of the 3 non-bank financial institutions

Foreign Capital Inducement Law control private sector’s access to foreign capital business activities were directed by the state

Low interest rate to induce firms to grow favored large firms compliant with state policies and plans excessive inflation favored large debtors inflation demand for capital discouraged domestic savings reliance on foreign debts vulnerable to external shocks


157 million US$ 1979 20. 5 billion US$ government preferred foreign borrowing over foreign direct investment 1962 maintain domestic ownership of industries in 2000 s private sector borrowed heavily 2008 56. 9 billion US$ 2010 154. 4 billion US$

Components of GDP, 2010: The Expenditure Approach BILLIONS OF DOLLARS Total gross domestic product Personal consumption expenditures (C) Durable goods Nondurable goods Services Gross private domestic investment (l) Nonresidential Residential Change in business inventories Government consumption and gross investment (G) Federal State and local Net exports (EX – IM) Exports (EX) Imports (IM) 9, 299. 2 6, 268. 7 761. 3 1, 845. 5 3, 661. 9 1, 650. 1 1, 203. 1 403. 8 43. 3 1, 634. 4 568. 6 1, 065. 8 - 254. 0 990. 2 1, 244. 2 PERCENTAGE OF GDP 100. 0 67. 4 8. 2 19. 8 39. 4 17. 7 12. 9 4. 3 0. 5 17. 6 6. 1 11. 5 - 2. 7 10. 6 13. 4

Society is better off when crime decreases, but a decrease in crime is not reflected in GDP. An increase in leisure is an increase in social welfare, not counted in GDP. Nonmarket and domestic activities are not counted even though they amount to real production.

GDP accounting rules do not adjust for production that pollutes the environment. GDP has nothing to say about the distribution of output. Redistributive income policies have no direct impact on GDP is neutral to the kinds of goods an economy produces.

Per Capita GNP for Selected Countries, 1998 COUNTRY U. S. DOLLARS 40, 080 34, 330 33, 260 32, 380 29, 340 26, 850 25, 620 25, 380 24, 940 24, 760 24, 110 21, 400 20, 300 20, 250 20, 020 18, 340 15, 940 14, 080 11, 650 Portugal Argentina South Korea Czech Republic Brazil Mexico Turkey South Africa Colombia Jordan Romania Philippines China Indonesia Pakistan India Rwanda Nepal Ethiopia 10, 690 8, 970 7, 970 5, 040 4, 570 3, 970 3, 160 2, 880 2, 600 1, 520 1, 390 1, 050 750 680 430 210 100 Switzerland Norway Denmark Japan United States Austria Germany Sweden Belgium France Netherlands Finland United Kingdom Australia Italy Canada Ireland Israel Spain Greece Source: The World Bank Atlas, 2010.