8a3c5ce62849013a56401ffa2458cbcd.ppt
- Количество слайдов: 23


Future Directions for Assessing Vapor Intrusion by Todd Mc. Alary, Geo. Syntec Consultants, Inc. AEHS VI Workshop October 19, 2004 Geo. Syntec

Outline Improved Protocols – What’s Coming n Qsoil n Perimeter crack model vs 0. 05>Qsoil/Qbldg>0. 0001 n Barometric Pumping n Implications for Data Variability n n Alternative Sampling Options More discrete in time and space n More integrated n Geo. Syntec

Improved Protocols n API - Collecting and Interpreting Soil Gas Samples from the Vadose Zone: A Practical Strategy for Assessing the Subsurface Vapor-to-Indoor-Air Migration Pathway at Petroleum Hydrocarbon Sites – Final Draft, July 2004 n Health Canada – Soil Vapour Intrusion Guidance for Health Canada Screening Level Risk Assessment (SLRA) – Final Draft, October 2004 n EPRI - Best Practices Manual For Evaluating Subsurface Vapor Intrusion to Indoor Air – Preliminary Draft, Sept 2004 n ITRC – Workshop next week to develop an outline n Others? Geo. Syntec

Areas for Advancement Conceptual Models n More tools in the toolbox n Standardization n QA/QC checks n Interpretive Tools n Geo. Syntec

Qsoil: Perimeter Crack Model 0. 8 L/min > Qsoil > 0. 05 L/min Geo. Syntec
 (perhaps 0.")
Qsoil: Current Recommendation 0. 05 > Qsoil/Qbuilding > 0. 0001 (Johnson, 2002) (perhaps 0. 01 to 0. 0001 is more common) For a typical residence: V ~ 600 m 3, AER ~0. 5 hr-1 Qbuilding ~ 300 m 3/hr or 5, 000 L/min 250 L/min > Qsoil > 0. 5 L/min (perhaps 50 to 0. 5) Generally higher than perimeter crack model OSWER Guidance uses 5 L/min, strictly empirical Geo. Syntec

Barometric Pumping Increasing B. P. Decreasing B. P. Ground Surface Ideal Gas Law: P 1 V 1 = P 2 V 2 Gas is compressible, so changes in B. P. either compress soil gas or allow it to expand. No net flow in the long-term, but short term. . . Geo. Syntec

Transient Effect of Barometric Pumping n Qsoil-BP = transient soil gas flow rate induced by B. P. change n A = area of the footprint of the building n a = air-filled porosity n xbp = depth of barometric pressure propagation n ΔP = barometric pressure change over time period “tbp” n Po = mean air pressure 0. 02 > ΔP/Potbp > 0. 002 (Parker, 2002) Geo. Syntec

Qsoil: Perimeter Crack Model vs Delta BP Magnitude agrees well with empirical estimate of 5 L/min But in the short-term, Qsoil can be -5 to 5 L/min! Geo. Syntec

Barometric Pressure Changes Arrows represent approximately 24 hours, during which BP may change a lot (>200 Pa in this example) , or hardly at all Compare this to 4 Pa stack effect! (d. P can be up to 5, 000 Pa) Geo. Syntec

Temporal Variability Geo. Syntec

Implications for Data Variability How much of this is due to short-term barometric pressure fluctuations? Geo. Syntec

Alternative Sampling Options n Option 1: More Integrated Data Time-Integrated: sample over several barometric cycles (e. g. 7 days) to smooth temporal variability n Volume-Integrated: to smooth spatial variability n n Option 2: More Discrete Data over time Real-time monitoring n Vertical Profiling n Monitor BP and delta P to establish correlation n Geo. Syntec

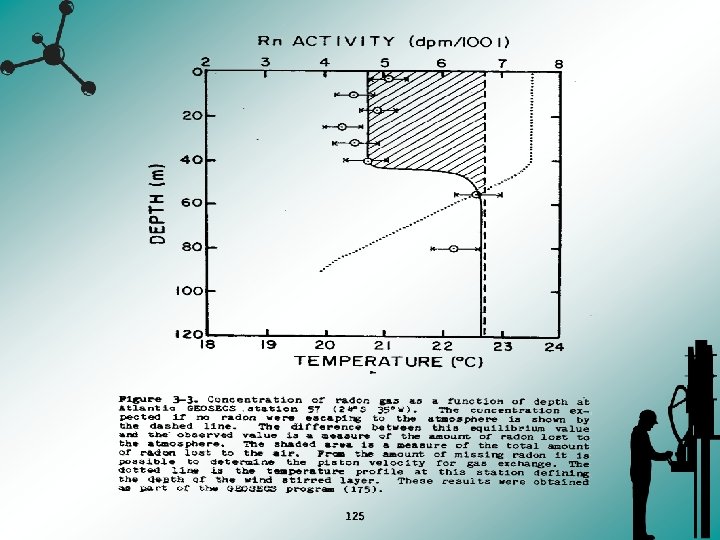
Time-Integrated Samples n Summa Canisters n n n ATD Tubes n n n Smaller critical orifice Solenoid valve “timer” Lower Flow Rate over Longer Time VOST Samplers – borrow stack testing tools? PUF: TO-13 designed for 300 m 3 samples n n 10 m by 10 m house, 10 m vadose zone, 30% air-porosity… Or Qsoil for 24 hours… Radon analogy: passive electret samplers Geo. Syntec
 Geo. Syntec")
Volume Integrated Samples Representative Purge Volume (Di. Giulio, 2004) Geo. Syntec

High Purge Volume Sampling Geo. Syntec

High Purge Volume Sampling Q = 15 scfm PID readings ~ 1, 000 ppmv over 1, 700, 000 L (3 days) indicates concentrations are spatially uniform Total mass removed ~ 10 kg (10 -6 risk needs only 0. 001 kg!) Combine with pneumatic testing, assess gas K Geo. Syntec

Is Bigger Always Better? Geo. Syntec

Huntington Beach Soil Gas

Summary & Conclusions n New and Improved Protocols are coming – data quality n Qsoil from BP changes is probably not negligible n. What is the contribution to data variability? n$$ to find out? n Risk assessment requires long-term average exposures n Time- or volume-integrated samples may help n Vertical profiling needed for assessing biodegradation Geo. Syntec
8a3c5ce62849013a56401ffa2458cbcd.ppt