

9e430dbdba2950f307f85a4f4791a314.ppt
- Количество слайдов: 53
 From Sequence to Function to Network: Analysis Issues in Bioinformatics Hasan H. Otu hotu@bidmc. harvard. edu BIDMC Genomics Center Harvard Medical School
 Bioinformatics is a management and analysis information system for life sciences. Data Storage and Management Protein Structure Prediction • Protein/RNA tertiary structure • Docking • Drug Design Data Analysis Molecular Sequence Analysis • Homology Search • Phylogeny Construction • Whole Genome Sequencing • Gene Finding Functional Genomics and Proteomics • Microarrays • Biomarker Discovery Communication Interpretation of Results Systems Biology • Pathways • Network based wholistic approach
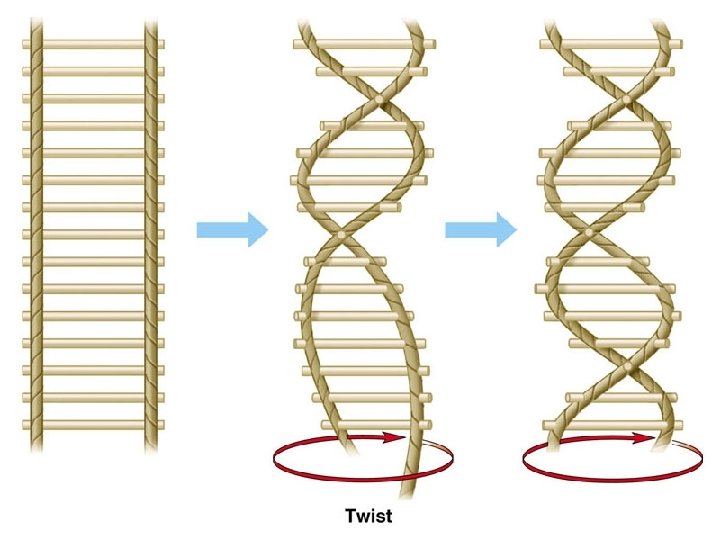
 A and G: Purines T and C: Pyrimidines
 Central Dogma of Molecular Biology
 Prokaryotes Eukaryotes Exon Intron DNA Cap RNA transcript with cap and tail Exon Intron Exon Transcription Addition of cap and tail Introns removed Tail Exons spliced together m. RNA Coding sequence NUCLEUS CYTOPLASM
 Amino Acid Translation Table • There are 64 possibilities • Only 20 Amino Acids in Nature • One start, three stop codons Translation Protein = AA Chain
 Sequence Comparison • Finding similarity between sequences is important for many biological questions For example: • Find similar proteins – Allows to predict function & structure • Locate similar subsequences in DNA – Allows to identify (e. g) regulatory elements • Locate DNA sequences that might overlap – Helps in sequence assembly 9 g 1 g 2
 Sequence Alignment Input: two sequences over the same alphabet Output: an alignment (inserting gaps into the sequences so that their lengths become the same) of the two sequences Example: • GCGCATGGATTGAGCGA • TGCGCCATTGATGACCA A possible alignment: -GCGC-ATGGATTGAGCGA TGCGCCATTGAT-GACC-A Need a scoring function. Goal: Find the alignment with the best score (and assignificance) Alternative view: Edit distance = “cost” of the “cheapest” set of edit operations needed to transform one sequence into the other. Current Approaches: Dynamic Programming ; HMMs
 Profile Shotgun Sequencing Target What is the information a given") Average Mutual Information (AMI) Profile Shotgun Sequencing Target What is the information a given base carries about a base k positions apart? I(k) = pij(k) log 2 [ pij(k) / pipj ] Sequences AACTAACGC… TAAGATCGA… CCCGATTTC. . . Shotgun Sequencing AMI Profiles [0. 53, 0. 35, 0. 18, …] [0. 61, 0. 42, 0. 23, . . . ] [0. 72, 0. 55, 0. 31, …] Fragment Assembly contigs Overall System Fragments AMI Profiles Vector Quantization Process Clusters MA Clusters (Consensus) Output Otu and Sayood, Bioinformatics, 2003 19: 22 -9
Average Mutual Information (AMI) Profile Shotgun Sequencing Target What is the information a given base carries about a base k positions apart? I(k) = pij(k) log 2 [ pij(k) / pipj ] Sequences AACTAACGC… TAAGATCGA… CCCGATTTC. . . Shotgun Sequencing AMI Profiles [0. 53, 0. 35, 0. 18, …] [0. 61, 0. 42, 0. 23, . . . ] [0. 72, 0. 55, 0. 31, …] Fragment Assembly contigs Overall System Fragments AMI Profiles Vector Quantization Process Clusters MA Clusters (Consensus) Output Otu and Sayood, Bioinformatics, 2003 19: 22 -9
 A phylogeny is a tree that describes the sequence of speciation events that lead to the forming of a set of current day species; also called a phylogenetic tree. Also used to understand functional relatedness of a group of genes or proteins • Classical phylogenetic analysis: morphological features: number of legs, lengths of legs, etc. • Modern biological methods allow to use molecular features – Gene sequences – Protein sequences
 Morphological topology Bonobo Chimpanzee Man Gorilla Sumatran orangutan Bornean orangutan Common gibbon Barbary ape Baboon White-fronted capuchin Slow loris Tree shrew Japanese pipistrelle Long-tailed bat Jamaican fruit-eating bat Horseshoe bat Little red flying fox Ryukyu flying fox Mouse Rat Vole Cane-rat Guinea pig Squirrel Dormouse Rabbit Pika Pig Hippopotamus Sheep Cow Alpaca Blue whale Fin whale Sperm whale Donkey Horse Indian rhino White rhino Elephant Aardvark Grey seal Harbor seal Dog Cat Asiatic shrew Long-clawed shrew Small Madagascar hedgehog Hedgehog Gymnure Mole Armadillo Bandicoot Wallaroo Opossum Platypus Archonta Glires Ungulata Carnivora Insectivora Xenarthra
 From sequences to a phylogenetic tree Rat QEPGGLVVPPTDA Rabbit QEPGGMVVPPTDA Gorilla QEPGGLVVPPTDA Cat REPGGLVVPPTEG There are many possible types of sequences to use (e. g. Mitochondrial vs Nuclear proteins).
 Mitochondrial topology Donkey Horse Indian rhino White rhino Grey seal Harbor seal Dog Cat Blue whale Fin whale Sperm whale Hippopotamus Sheep Cow Alpaca Pig Little red flying fox Ryukyu flying fox Horseshoe bat Japanese pipistrelle Long-tailed bat Jamaican fruit-eating bat Asiatic shrew Long-clawed shrew Mole Small Madagascar hedgehog Aardvark Elephant Armadillo Rabbit Pika Tree shrew Bonobo Chimpanzee Man Gorilla Sumatran orangutan Bornean orangutan Common gibbon Barbary ape Baboon White-fronted capuchin Slow loris Squirrel Dormouse Cane-rat Guinea pig Mouse Rat Vole Hedgehog Gymnure Bandicoot Wallaroo Opossum Platypus Perissodactyla Carnivora Cetartiodactyla Chiroptera Moles+Shrews Afrotheria Xenarthra Lagomorpha + Scandentia Primates Rodentia 1 Rodentia 2 Hedgehogs
 Nuclear topology Round Eared Bat Flying Fox Hedgehog Mole Pangolin 1 Cow Cat Dog Horse Rhino Rat 3 Capybara Rabbit Flying Lemur Tree Shrew Human Galago Sloth 4 Eulipotyphla Pholidota Whale Hippo Pig 2 Chiroptera Hyrax Dugong Elephant Aardvark Elephant Shrew Opossum Kangaroo Cetartiodactyla Carnivora Perissodactyla Glires Scandentia+ Dermoptera Primate Xenarthra Afrotheria
 Compute distance between molecular sequences (ii)") Three Methods of Tree Construction • Distance- (i) Compute distance between molecular sequences (ii) find a tree that realizes the distances between the objects (UPGMA, NJ, etc. ). • Parsimony – A tree with a total minimum number of character changes between nodes. • Likelihood– A tree with highest likelihood of explaining relation between underlying sequences given a evolutionary model.
Three Methods of Tree Construction • Distance- (i) Compute distance between molecular sequences (ii) find a tree that realizes the distances between the objects (UPGMA, NJ, etc. ). • Parsimony – A tree with a total minimum number of character changes between nodes. • Likelihood– A tree with highest likelihood of explaining relation between underlying sequences given a evolutionary model.
 Computing Distances Between Sequences Given a multiple alignment of N sequences, assume -Each position in DNA sequence is independent -Each position can mutate with same probability to any another base A simple Model D=k/n where n is the length of the sequence and k is the number of nucleotides that differ Jukes-Cantor distance : DJC = – ¾ ln [1 – 4/3 D] Kimura 2 parameter distance: DK = ½ ln [ 1 / (1– 2 P – 2 Q) ] + ¼ ln [ 1 / (1 – 2 Q) ] P: fraction of transitions (changes among purines or pyrimidines) Q: fraction of transversions (changes between purines and pyrimidines)
 Non Distance Based Method: Maximum Likelihood • Given a probabilistic model for nucleotide (or protein) substitution (e. g. , Jukes & Cantor), pick the tree that has highest probability of generating observed data – i. e. , given data D and model M, find tree T such that Pr(D|T, M)is maximized • Models gives values pij(t), the probability of going from nucleotide i to j in time t
 Maximum Likelihood • Requires a MA of sequences • Makes 2 independence assumptions – Different sites evolve independently – Diverged sequences (or species) evolve independently after diverging • If Di is data for ith site
 ? pxy(t)~ prob of going from x") Maximum Likelihood How to calculate Pr(Di|T, M) ? pxy(t)~ prob of going from x to y in time t
Maximum Likelihood How to calculate Pr(Di|T, M) ? pxy(t)~ prob of going from x to y in time t
 ML Possible Trees Sequence W: X: Y: Z: W X Y Z A A C C G G G A C C G G A A W Y X Z T T A G T T T G G G G A A W Z X Y
 = L(root)") Likelihood for One Path T T A G T G G L(path) = L(root) x P L(branches) = P(G)P(G T)P(G G) P(G A)P(G G) P(T T)
Likelihood for One Path T T A G T G G L(path) = L(root) x P L(branches) = P(G)P(G T)P(G G) P(G A)P(G G) P(T T)
 Sum over all paths TTAG A A T T G G C A C T G C L(Column) = S L(all possible Evolutionary Paths) = L(path 1) + L(path 2) + L(path 3) + … + L(path 64)
 = L(each position i) Choose the") Whole Sequence Likelihood W X Y Z L(Sequence) = L(each position i) Choose the tree with the Maximum Likelihood.
Whole Sequence Likelihood W X Y Z L(Sequence) = L(each position i) Choose the tree with the Maximum Likelihood.
 Non Distance Based Method: Parsimony Minimal Evolution Principle Most parsimonious tree: Tree with minimal parsimony score Parsimony-score: Number of character-changes (mutations) along the evolutionary tree (tree containing labels on internal vertices) Example: Score = 3 Score = 4 0 AAA 1 AAA AAG 1 AGA 0 AAA AAA 0 0 2 GGA 1 AAA AAG 0 AAA 1 0 AGA 1 GGA
 Proposed Distance Complexity of DNA Sequences Through a Production Process Produce Q from S S = AACGTACCATTG S=AACGTACCGCGTCCGCA T = CTAGGGACTTAT Q = ACGGTCACCAA H(S) = A • AC • G • T • ACC • GTC • CGCA C(S) = 8 H(SQ) = A • AC • G • T • ACC • AT • TG • ACGG • TC • ACCAA H(TQ) = C • T • A • GGA • CTT • ACG • GT • CA • CC • AA c(SQ) – c(S) = 3 c(TQ) – c(T) =5 Q is “closer” to S than it is to T Application to phylogeny reconstruction Otu and Sayood Bioinformatics 2003; 19: 2122 -2130 Fungi Phylogeny Whole mt. DNA Genome Bastola, Otu et al. Mycological Research 2004; 108(2): 117 -125
 ATTCCTACTTA Microarray Principle Affymetrix Gene. Chip® Approach Gene Sequence 25 mer T G C A T G C A G C 11 -20 pairs of features used to represent one gene A T G C A T G PM MM T G C A T G 1, 000 features per array representing ~ 50, 000 transcripts C A T G C A A G A T T G C A T G
 Affy Signal Values
 • Cell Cycle • DNA processing:") Stemness Genes – do they really exist? (Nanog) • Cell Cycle • DNA processing: replication, repair, helicase, binding-protein • RNA processing • Chromatin modifiers • Transcription factors Otu et al. Science. 2003 302: 393
Stemness Genes – do they really exist? (Nanog) • Cell Cycle • DNA processing: replication, repair, helicase, binding-protein • RNA processing • Chromatin modifiers • Transcription factors Otu et al. Science. 2003 302: 393
 Renal Cell Cancer Run Affymetrix array for each of the following samples: 32 Normal Malignant 23 Clear Cell RCC 11 Papillary RCC Benign 8 Transitional Cell Carcinoma 12 Oncocytoma 6 Chromophobe RCC Jones, Otu et al. 2005 Clinical Cancer Research
 categories Development") Regenerating liver and developing liver are distinct Selected overrepresented Gene Ontology (GO) categories Development Regeneration Dev. and Reg. CELL CYCLE 339 (2. 7 E-30) 104 (3. 0 E-12) 74 (1. 2 E-18) DNA REPLICATION 82 (2. 5 E-13) 25 (9. 5 E-05) 23 (1. 6 E-09) MITOSIS 87 (1. 8 E-15) 30 (5. 7 E-07) 24 (4. 5 E-10) REGULATION OF CELL CYCLE 170 (3. 9 E-10) 52 (3. 6 E-05) 34 (9. 1 E-07) ACUTE-PHASE RESPONSE N/A 10 (1. 9 E-04) N/A CELLULAR PHYSIOLOGICAL PROCESS 3308 (1. 5 E-32) 795 (7. 7 E-03) 386 (6. 0 E-06) CHROMATIN MODIFICATION 73 7 3 TRANSCRIPTION 782 (2. 0 E-12) 144 (***) 73 (***) CHROMATIN REMODELING 24 (1. 5 E-04) 2 (***) 2 HEME BIOSYNTHESIS 8 (2. 9 E-02) 1 (***) N/A REGULATION OF TRANSCRIPTION 744 (5. 1 E-10) 136 (***) 69 (***) TRANSCRIPTION FACTOR BINDING 96 (2. 7 E-08) 17 (***) 11 (***) TRANSCRIPTION COFACTOR ACTIVITY 67 (5. 8 E-05) 12 (***) 8 (***) TRANSCRIPTIONAL ACTIVATOR ACTIVITY 76 (1. 4 E-04) 12 6 (***) TRANSCRIPTION COACTIVATOR ACTIVITY 35 (4. 9 E-03) 4 (***) 2 (***) TRANSCRIPTION COREPRESSOR ACTIVITY 29 (4. 6 E-03) 6 (***) 5 (***) (9. 4 E-09) (***) Otu et al. J. Biol. Chem. 2007; 282: 11197 -11204 (***)
Regenerating liver and developing liver are distinct Selected overrepresented Gene Ontology (GO) categories Development Regeneration Dev. and Reg. CELL CYCLE 339 (2. 7 E-30) 104 (3. 0 E-12) 74 (1. 2 E-18) DNA REPLICATION 82 (2. 5 E-13) 25 (9. 5 E-05) 23 (1. 6 E-09) MITOSIS 87 (1. 8 E-15) 30 (5. 7 E-07) 24 (4. 5 E-10) REGULATION OF CELL CYCLE 170 (3. 9 E-10) 52 (3. 6 E-05) 34 (9. 1 E-07) ACUTE-PHASE RESPONSE N/A 10 (1. 9 E-04) N/A CELLULAR PHYSIOLOGICAL PROCESS 3308 (1. 5 E-32) 795 (7. 7 E-03) 386 (6. 0 E-06) CHROMATIN MODIFICATION 73 7 3 TRANSCRIPTION 782 (2. 0 E-12) 144 (***) 73 (***) CHROMATIN REMODELING 24 (1. 5 E-04) 2 (***) 2 HEME BIOSYNTHESIS 8 (2. 9 E-02) 1 (***) N/A REGULATION OF TRANSCRIPTION 744 (5. 1 E-10) 136 (***) 69 (***) TRANSCRIPTION FACTOR BINDING 96 (2. 7 E-08) 17 (***) 11 (***) TRANSCRIPTION COFACTOR ACTIVITY 67 (5. 8 E-05) 12 (***) 8 (***) TRANSCRIPTIONAL ACTIVATOR ACTIVITY 76 (1. 4 E-04) 12 6 (***) TRANSCRIPTION COACTIVATOR ACTIVITY 35 (4. 9 E-03) 4 (***) 2 (***) TRANSCRIPTION COREPRESSOR ACTIVITY 29 (4. 6 E-03) 6 (***) 5 (***) (9. 4 E-09) (***) Otu et al. J. Biol. Chem. 2007; 282: 11197 -11204 (***)
 103, 14027 -14032 Genes") Transcriptome of Human Oocyte Proc. Natl. Acad. Sci. USA (2006) 103, 14027 -14032 Genes and gene products responsible for dedifferentiation of somatic cells. US Patent by MSU, GIS, and HMS
Transcriptome of Human Oocyte Proc. Natl. Acad. Sci. USA (2006) 103, 14027 -14032 Genes and gene products responsible for dedifferentiation of somatic cells. US Patent by MSU, GIS, and HMS
 Type 2 Diabetes → Diabetic Nephropathy Predictive Signature • 62 Pima Indians • All with T 2 D at baseline • 31 go on to DN within 10 years • Training: 14 Case, 14 Control • Validation: 17 Case , 17 Control 12 peak signature: 89% on training (93% sensitivity, 86% specificity) 74% accuracy an validation (71% sensitivity, 76% specificity) Otu et al. Diabetes Care, 2007 30: 638 -643
 Completed Projects • Transcriptional Effects of PTH and Estrogen Combination Treatment During Anabolic Bone Formation J. Cell. Biochem. 2004; 93: 476 -490 • Differences in Gene Expression Profiles of Diabetic and Non-diabetic Patients Undergoing Cardiopulmonary Bypass and Cardioplegic Arrest Circulation 2004; 110: II-280 -286 • High-Throughput Generation of Reliable Serum and Plasma Protein Profiles with SELDITOF MS Clinical Chemistry and Laboratory Medicine 2005; 43(2), 133 -140 • Preconditioning Of Primary Human Endothelial Cells With İnflammatory Mediators Alters The “Set Point” Of The Cell FASEB Journal 2005 19(13): 1914 -1916 • Unique Gene Expression Profile based upon Pathologic Response in Epithelial Ovarian Cancer Journal of Clinical Oncology 2005 23(31): 7911 -7918 • A Novel Role For Gadd 45β As A Mediator Of MMP-13 Gene Expression During Chondrocyte Terminal Differentiation Journal of Biological Chemistry 2005 280 (46): 38544 -38555
: 267 -274") Completed Projects • Proteomic Analysis Of The Allograft Response Transplantation 2006 82(2): 267 -274 • Differential Gene Expression Analysis Reveals Generation Of An Autocrine Loop By A Mutant EGFR İn Glioma Cells Cancer Research 2006 66(2): 867 -874 • A Novel Class of VEGF-Responsive Genes That Require Forkhead Activity for Expression Journal of Biological Chemistry 2006 281(46): 35544 -53 • Essential Role Of Jun Family Transcription Factors İn PU. 1 -induced Leukemic Stem Cell Transformation Nature Genetics, 2006 38(11): 1269 -77 • A Novel Pathway Involving Melanoma Differentiation Associated Gene-7/Interleukin-24 Mediates Nonsteroidal Anti-inflammatory Drug-Induced Apoptosis and Growth Arrest of Cancer Cells Cancer Res. 2006 66(24): 11922 -31 • Serum Proteome Profiling Detects Myelodysplastic Syndromes and Identifies CXC Chemokine Ligands 4 and 7 As Markers For Advanced Disease PNAS, 2007 104(4): 1307 -12
Completed Projects • Proteomic Analysis Of The Allograft Response Transplantation 2006 82(2): 267 -274 • Differential Gene Expression Analysis Reveals Generation Of An Autocrine Loop By A Mutant EGFR İn Glioma Cells Cancer Research 2006 66(2): 867 -874 • A Novel Class of VEGF-Responsive Genes That Require Forkhead Activity for Expression Journal of Biological Chemistry 2006 281(46): 35544 -53 • Essential Role Of Jun Family Transcription Factors İn PU. 1 -induced Leukemic Stem Cell Transformation Nature Genetics, 2006 38(11): 1269 -77 • A Novel Pathway Involving Melanoma Differentiation Associated Gene-7/Interleukin-24 Mediates Nonsteroidal Anti-inflammatory Drug-Induced Apoptosis and Growth Arrest of Cancer Cells Cancer Res. 2006 66(24): 11922 -31 • Serum Proteome Profiling Detects Myelodysplastic Syndromes and Identifies CXC Chemokine Ligands 4 and 7 As Markers For Advanced Disease PNAS, 2007 104(4): 1307 -12
 Completed Projects • Reduced PDEF Expression Enhances Prostate Cancer Cell Motility and Invasiveness Due To A Switch From Epithelial To Mesenchymal Gene Expression Cancer Research, 2007 67(9): 4219 -26 • A High Fat, Ketogenic Diet, Induces a Unique Metabolic State in Mice. American Journal of Physiology-Endocrinology and Metabolism, 2007 292(6): E 1724 -39 • c-Fos as a Pro-Apoptotic Agent in TRAIL-induced Apoptosis in Prostate Cancer Cells. Cancer Research, 2007 67(19): 9425 -9434 • Oxidative Stress and Atrial Fibrillation After Cardiac Surgery: A Case-Control Study. Ann. Thoracic Surgery, 2007 84(4): 1166 - 1173. • Genomic Expression Pathways Associated to Brain Injury after Cardiopulmonary Bypass. Journal of Thoracic and Cardiovascular Surgery, 2007 134(4): 996 -1005. • Serum Proteomics and Biomarkers in Hepatocellular Carcinoma and Chronic Liver Disease Clinical Cancer Research, 2008 14(2): 470 -7 • Proteomic Identification of Interleukin-2 Therapy Response in Metastatic Renal Cell Cancer. Journal of Urology, 2008 179(2): 730 -736.
 Completed Projects • Gene expression of purified beta cell tissue obtained from human pancreas with laser capture microdissection. The Journal of Clinical Endocrinology & Metabolism, 2008 93(3): 1046 -1053. • Genomic Counter-Stress Changes Induced by the Relaxation Response. PLo. S One, 2008 3(7): e 2576. • A Role for GADD 45β as a Survival Factor in Articular Chondrocytes in Normal and Osteoarthritic Cartilage Arthritis & Rheumatism, 2008 58(7): 2075 -87. • Gene expression profile of mouse prostate tumors reveals dysregulations in major biological processes and identifies potential murine targets for preclinical development of human prostate cancer therapy. The Prostate, 2008 Oct 1; 68(14): 1517 -30. • Gene expression analysis of embryonic stem cells expressing VE-cadherin (CD 144) during endothelial differentiation. BMC Genomics, 2008 9: 240. • Differential gene expression of bone marrow-derived CD 34+ cells is associated with survival of patients suffering from myelodysplastic syndrome. Int J Hematol. , 2009 89(2): 173 -87
 Ongoing Projects • Identifying Reprogramming Genes / i. PS cell characterization Jose Cibelli, Michigan State University • Stem Cell-Differentiation Mechanism Bing Lim, Genome Institute of Singapore • Genomic Changes Induced by Relaxation Response Herbert Benson, Harvard Medical School • Effects of Soy Pythochemicals on Bladder Cancer JR Zhou Harvard Medical School • Genome Wide Association for Brain Aneurysms Murat Gunel Yale School of Medicine • Effect of Nicotine on Palate Development. Ali Nawshad, University of Nebraska
 The Challenge: Create Order Out of Chaos Integration of Disparate Clinical, Genomic and Proteomic Data Into Biological Pathways
 Infrastructure
 Research Portal www. bidmcgenomics. org
 Assigning Significance to Subclusters of Experimental Sample. S ASSESS Inspired by Felsenstein’s Bootstrap Method for Phylogeny Sub-sample expression data Build a HC tree for each sample Generate the consensus tree from above s 1 s 2 s 3 … s n f 1 f 1 f 2 f 3 f 2 f 1 f 3 … … … M*1 … M*2 … … …… …… fm-2 fm-k fm-2 fm-1 fm fm fm-1 M*B fm T T*1 …… T*2 Assign Confidence …… T*B
 ASSESS Otu et al. EIT, 2005 pp: 1 -6
 Bayesian Networks • Consists of two components: – A directed acyclic graph G whose nodes are the random variables Xi – θ describes conditional distribution for each variable • Each variable Xi is independent of its non-descendants, given its parents in G BNs are • Inherently Stochastic • Resistant to Noise • Captures Gene Interactions Suitable for Gene Regulation Network Analysis
 Bayesian Pathway Analysis
 Simulation Results BN name # of nodes Data following CPT Data inconsistent with CPT Score p-value Alarm 37 -9, 955 0 -22, 600 0. 56 Asia 8 -2, 221 0 -2, 926 0. 54 BN 1 19 -9, 344 0 -10, 213 0. 62 BN 2 8 -3, 569 0 -3, 874 0. 54 BN 3 21 -10, 844 0 -12, 763 0. 55 BN 4 36 -20, 074 0 -21, 746 0. 59 BN 5 18 -9, 607 0 -10, 245 0. 50 BN 6 29 -15, 859 0 -17, 122 0. 64 BN 7 19 -9, 804 0 -10, 996 0. 65 BN 8 53 -29, 937 0 -32, 262 0. 67
") RCC Dataset Pathway Definition Score nodes P-value Glycolysis / Gluconeogenesis - Homo sapiens (human) -802. 593 27 0 Cell cycle - Homo sapiens (human) -2508. 29 74 0 Citrate cycle (TCA cycle) - Homo sapiens (human) -557. 116 17 0 Fatty acid metabolism - Homo sapiens (human) -684. 362 22 0 Purine metabolism - Homo sapiens (human) -1586. 13 65 0 Glutamate metabolism - Homo sapiens (human) -840. 076 21 0 Alanine and aspartate metabolism - Homo sapiens (human) -922. 135 22 0 Valine, leucine and isoleucine degradation - Homo sapiens (human) -888. 348 26 0 0 beta-Alanine metabolism - Homo sapiens (human) -439. 498 12 0 Glutathione metabolism - Homo sapiens (human) -399. 509 11 0 Pyruvate metabolism - Homo sapiens (human) -710. 303 19 0 Fluorobenzoate degradation - Homo sapiens (human) 1, 4 -Dichlorobenzene degradation - Homo sapiens (human) 0 0 0 -554. 229 22 0 PPAR signaling pathway - Homo sapiens (human) -1724. 8 42 0 Erb. B signaling pathway - Homo sapiens (human) -1592. 59 44 0 -1415. 7 42 0 One carbon pool by folate - Homo sapiens (human) TGF-beta signaling pathway - Homo sapiens (human) Toll-like receptor signaling pathway - Homo sapiens (human) -2060. 7 60 0 Synthesis and degradation of ketone bodies - Homo sapiens (human) -207. 897 5 0 Fc epsilon RI signaling pathway - Homo sapiens (human) -1135. 56 35 0 Natural killer cell mediated cytotoxicity - Homo sapiens (human) -2123. 25 59 0. 001 B cell receptor signaling pathway - Homo sapiens (human) -1187. 39 35 0. 001 MAPK signaling pathway - Homo sapiens (human) -3889. 26 115 0. 002 Insulin signaling pathway - Homo sapiens (human) -1953. 19 60 0. 002 3 -Chloroacrylic acid degradation - Homo sapiens (human) -73. 9607 2 0. 003 Nicotinate and nicotinamide metabolism - Homo sapiens (human) -508. 979 18 0. 003 VEGF signaling pathway - Homo sapiens (human) -772. 384 27 0. 003 Arginine and proline metabolism - Homo sapiens (human) -798. 486 23 0. 004 T cell receptor signaling pathway - Homo sapiens (human) -1887. 94 53 0. 004 Wnt signaling pathway - Homo sapiens (human) -1847. 35 60 0. 005 Pathway Definition Glycolysis / Gluconeogenesis Pyruvate metabolism Citrate cycle Arginine and proline metabolism Urea cycle Propanoate metabolism, Butanoate metabolism Lysine degradation Valine, leucine and isoleucine degradation p 53 -mediated pathway Purine Metabolism BPA Analysis Results of External Microarray Data Experimental proteomics study of RCC
RCC Dataset Pathway Definition Score nodes P-value Glycolysis / Gluconeogenesis - Homo sapiens (human) -802. 593 27 0 Cell cycle - Homo sapiens (human) -2508. 29 74 0 Citrate cycle (TCA cycle) - Homo sapiens (human) -557. 116 17 0 Fatty acid metabolism - Homo sapiens (human) -684. 362 22 0 Purine metabolism - Homo sapiens (human) -1586. 13 65 0 Glutamate metabolism - Homo sapiens (human) -840. 076 21 0 Alanine and aspartate metabolism - Homo sapiens (human) -922. 135 22 0 Valine, leucine and isoleucine degradation - Homo sapiens (human) -888. 348 26 0 0 beta-Alanine metabolism - Homo sapiens (human) -439. 498 12 0 Glutathione metabolism - Homo sapiens (human) -399. 509 11 0 Pyruvate metabolism - Homo sapiens (human) -710. 303 19 0 Fluorobenzoate degradation - Homo sapiens (human) 1, 4 -Dichlorobenzene degradation - Homo sapiens (human) 0 0 0 -554. 229 22 0 PPAR signaling pathway - Homo sapiens (human) -1724. 8 42 0 Erb. B signaling pathway - Homo sapiens (human) -1592. 59 44 0 -1415. 7 42 0 One carbon pool by folate - Homo sapiens (human) TGF-beta signaling pathway - Homo sapiens (human) Toll-like receptor signaling pathway - Homo sapiens (human) -2060. 7 60 0 Synthesis and degradation of ketone bodies - Homo sapiens (human) -207. 897 5 0 Fc epsilon RI signaling pathway - Homo sapiens (human) -1135. 56 35 0 Natural killer cell mediated cytotoxicity - Homo sapiens (human) -2123. 25 59 0. 001 B cell receptor signaling pathway - Homo sapiens (human) -1187. 39 35 0. 001 MAPK signaling pathway - Homo sapiens (human) -3889. 26 115 0. 002 Insulin signaling pathway - Homo sapiens (human) -1953. 19 60 0. 002 3 -Chloroacrylic acid degradation - Homo sapiens (human) -73. 9607 2 0. 003 Nicotinate and nicotinamide metabolism - Homo sapiens (human) -508. 979 18 0. 003 VEGF signaling pathway - Homo sapiens (human) -772. 384 27 0. 003 Arginine and proline metabolism - Homo sapiens (human) -798. 486 23 0. 004 T cell receptor signaling pathway - Homo sapiens (human) -1887. 94 53 0. 004 Wnt signaling pathway - Homo sapiens (human) -1847. 35 60 0. 005 Pathway Definition Glycolysis / Gluconeogenesis Pyruvate metabolism Citrate cycle Arginine and proline metabolism Urea cycle Propanoate metabolism, Butanoate metabolism Lysine degradation Valine, leucine and isoleucine degradation p 53 -mediated pathway Purine Metabolism BPA Analysis Results of External Microarray Data Experimental proteomics study of RCC
 (5 -6") Camel EST Sequencing Age Young Adult Aged Color (1 -2 yrs. old) (5 -6 yrs. old) (9 -10 yrs. old) Black 11 tissues* 11 tissues Brown 11 tissues White 11 tissues Camel 1 Camel 2 Camel 3 384 x 61 = 23, 424 read each; 70272 total reads * Br, Liv, Kid, Hrt, Bld, Stm, Lng, Spl, Pan, Gen, Msc
Camel EST Sequencing Age Young Adult Aged Color (1 -2 yrs. old) (5 -6 yrs. old) (9 -10 yrs. old) Black 11 tissues* 11 tissues Brown 11 tissues White 11 tissues Camel 1 Camel 2 Camel 3 384 x 61 = 23, 424 read each; 70272 total reads * Br, Liv, Kid, Hrt, Bld, Stm, Lng, Spl, Pan, Gen, Msc
 Raw chromatogram Homology Search Organism Based Annotation BLASTX BLASTN PHRED Sequence and Quality Files Contig/Singlet Processing Functional Annotation Assembly Full Length c. DNA Analysis LUCY 2 Vector and Low Quality Base Trimming CAP 3 Check for Chimeras REPEAT MASKER Mask for Repeats Clustering RBR TGICL Merge Repeats ORF Analysis
 Read Statistics Untrimmed # of reads 70, 272 Average read length 1, 447 ± 411 bp Average # of high 614 ± 283 quality bp/read # of reads after trimming Sequence Statistics # of contigs 8, 319 # of singletons 15, 283 total # of sequences 23, 602 average # of reads per contig 58, 842 5. 2 average contig length 1, 247 bp Average read length 755 ± 171 bp average singleton length 696 bp Average # of high 670 ± 181 average ORF length (contig) 673 bp average ORF length (singleton) 390 bp quality bp/read # of chimeric sequences 1, 241 # of reads after chimera 59, 534 # of reads with repeat region 18, 340 (30. 8%) to repeats ~2. 5 x 10⁶ (5. 5%) contigs 7, 490 singletons analysis total # of bp masked due # of sequences with hit 11, 480 # of sequences with no hit contigs 829 Singletons 3, 803
 • Exon Arrays (alternative") Other Microarray Applications • Tiling Arrays (covers whole genomic region) • Exon Arrays (alternative splicing) • micro. RNA Arrays • Methylation Arrays • SNP Arrays (Genome Wide Association) • Cytogenetics (chromosomal aberations) • Promoter Arrays
Other Microarray Applications • Tiling Arrays (covers whole genomic region) • Exon Arrays (alternative splicing) • micro. RNA Arrays • Methylation Arrays • SNP Arrays (Genome Wide Association) • Cytogenetics (chromosomal aberations) • Promoter Arrays
 • Motif finding,") Future Directions • Identification of species in a mixed culture (AMI) • Motif finding, classification, multiple alignment (LZ) • Network based analysis of high throughput data using external knowledge • Unified analysis of multiple measurements of same biological sample
Future Directions • Identification of species in a mixed culture (AMI) • Motif finding, classification, multiple alignment (LZ) • Network based analysis of high throughput data using external knowledge • Unified analysis of multiple measurements of same biological sample