

8e8a0595401d85c1c25482c05a1051af.ppt
- Количество слайдов: 70
 FMANZ gratefully acknowledges the support of our Gold Sponsors
 NZ Electricity Market - Where to Next? Mike Roan Wholesale Markets Manager Meridian Energy 13 September 2012
 The information provided in this presentation is provided for education and informational purposes only. The information is not intended to be and does not constitute financial advice. It is general in nature and is not specific to you, your business or anyone else. You should not make any decision based on this information (financial or otherwise) without undertaking independent due diligence or seeking your own independent financial or other professional advice. 3
 Recap – Other Seminars • At previous seminars we combined messages: – prices have risen by ~5 per cent since 2000 – prices will continue to rise (and can be volatile) – we can control the way we use electricity in order to manage cost – we can also contract out of exposure to price volatility Take Out: Controlling electricity consumption while contracting out of price volatility will become increasingly valuable to you 4
 This Time • This time: – what is going on in the electricity sector that might be of interest – how may this impact you and decisions you make? 5
 NZ Wholesale Electricity Price Forecast • MED electricity price forecasts remain the same – prices are likely to rise Source: MED Energy Outlook - www. med. govt. nz/sectors-industries/energy-modelling/new-zealands-energy-outlook 6
 Cross Winds • However, there are some cross winds to be aware of: – the global economy is weak – NZ electric demand is weak – reasonable levels of supply (absent hydro shortage) 7
 Cross Winds – NZ Electric Demand • Since 2007, NZ electric demand has been reasonably static Static Demand Source: Meridian • The drivers of flat demand are well documented – low inflows in 2008 (where consumers were asked to conserve), the global financial crisis, NZAS transformer failure, the Christchurch earthquake and improved energy intensity by consumers 8
 Cross Winds – NZ Electric Demand • Looking forward, much of the above uncertainty continues to exist – ongoing global economic instability and more local impacts are expected to remain – NZAS & Norske Skog announcements are indicators of difficulty that is possibly widespread Forecast demand growth • This graph includes ~2, 000 GWh of new supply being added over the next three years 9
 Offsets - Issues to be Aware of • Offsetting all of the above is hydro fuel availability (inflow volatility) • NZ electricity prices largely a function of hydro storage (unlike other countries) 10 Source: Meridian
 Recent Events – NZEM • NZ wholesale electricity prices reflect hydro storage capacity 11 Source: Meridian
 Offsets - Issues to be Aware of • Some of our competitors will have big decisions to make – Genesis has said it will shut two Huntly units – one in 2012 and one in 2014 – Contact is considering repowering its Otahuhu station • And there are some very specific challenges to overcome – Transpower is completing a number of large transmission upgrades in the near term – Genesis is relining the Tekapo canal – NZAS request to renegotiate contractual terms (approx 12% of NZ demand) 12 Source: Meridian
 Major Projects and Timelines Reinforce Auckland consumption - November 2012 Taupo Grid Strengthening - Late 2014 Lower NI Upgrading - 5+ years away 1000 MW HVDC Upgrade - February 2013 Tekapo Canal Relining - Jan through April 2013 Lower SI Renewable Upgrade - Stage 1: November 2012 - Stage 2: March 2014
 • My role is to manage these issues for Meridian • More importantly, what do they mean for you? 14
 What Does it Mean for You? • there are some cross currents for electricity prices – • they are still likely to increase some of the specific risks in the near term may result in some volatility – – the next 6 months include major transmission upgrade works contracts provide relief from volatility – both specific risk and hydrology • contract duration should match your business risk profile • continue hunting down waste regardless 15
 Managing Electricity in Your Business The Essentials 16
 First things first – Site Type? • Two types of site in the electricity world Non-Half Hourly Time of Use Small* Commercial/Residential sites e. g. your house, small-mid size retail Large* Commercial / Industrial e. g. manufacturing, hotels, supermarkets Meters read periodically (frequency depends) Consumption recorded every half hour “Anytime” is just one price Price varies (time of day + month) Network charges may be ‘bundled’ into rate Network charges are separated * Threshold varies by Network 17
 What charges are included in a bill? There are two major cost components: Energy (Wholesale purchase + Retailer) Network (Network company e. g. Vector)
 Your Pricing Options – Non Half Hourly • Variable Pricing – Energy component subject to change (30 days notice) – Network charges change when those companies change their rates – No price certainty. This is the default or ‘Do Nothing’ option • Fixed Energy Plan – The Energy component of your rate is fixed – typically for 2 -3 yrs – As above, Network charges change – Gives you significant (but not quite complete) price certainty • Select a specific tariff for your needs – Options are determined by metering configuration – Metering changes can enable savings – Options differ by network – Examples include • Day/Night/Weekend tariffs • ‘Controlled’ rates • Seasonality in some networks Main Message: Talk to an expert 19
 –") Your Pricing Options – Time of Use • Fixed Price (with Variable Volume) – Meridian calls this “Easiplan” – it is the most common contract – Provides price certainty and insulates you from spot market fluctuations – Pricing is ‘shaped’ so that different rates apply at different times • Spot Pricing – This is 100% exposure to the wholesale market (incl. Admin fee) – Expect significant variability in the price you pay each month • Proportional Pricing – Mixture of Fixed Price and Spot – Select % you want fixed e. g. 80% fixed price, 20% on spot market • More complex options – Spot supply with Contracts for Differences (CFDs or Hedges) Main Message: Talk to an expert 20
Your Pricing Options – Time of Use • Fixed Price (with Variable Volume) – Meridian calls this “Easiplan” – it is the most common contract – Provides price certainty and insulates you from spot market fluctuations – Pricing is ‘shaped’ so that different rates apply at different times • Spot Pricing – This is 100% exposure to the wholesale market (incl. Admin fee) – Expect significant variability in the price you pay each month • Proportional Pricing – Mixture of Fixed Price and Spot – Select % you want fixed e. g. 80% fixed price, 20% on spot market • More complex options – Spot supply with Contracts for Differences (CFDs or Hedges) Main Message: Talk to an expert 20
 Managing Your Electricity Budget Two primary ways to manage your budget 1. Enter into a Supply Agreement – Define what you are looking for in a supplier and ask Retailers to respond – Use competition to get the best outcome for you – Choose a supplier that will add value (we of course think there is only one) 2. Take Control of your electricity consumption – Request data from your retailer or use their on-line tools (Business On Line) – Eliminate waste! Consider undertaking an energy audit – Take advantage of pricing differentials e. g. night vs. day rates – Meridian customers, talk to one of our Account Managers. We are here to help 21
 Supply Agreements: Key Questions for You – How much do you spend on electricity per annum and how material is it to you? – What is your business’s appetite for price risk? – How well do you understand the electricity market – do you need help? – Do suppliers values align with yours? e. g. sustainability – Are you aware of what Retailers offer beyond of price? (On Line, Electronic Invoicing, payment terms, reporting, account management) – If you are considering participating in a supply group, are the group’s requirements aligned with yours? In the success game – Value always beats Price 22
 Take Outs • controlling consumption will become increasingly valuable • wholesale price volatility reflects the place we live – • this volatility is not a new feature if you enter into contracts, define what success looks like before you begin – use trusted partners to get there and ask for advice on how to structure along the way 23
 29 August 2012 Getting on the Energy Management Cycle Improve your energy wasteline
 Energy Management Cycle Westpac followed all elements of this cycle • Quarterly M&T Report & Meeting Get commitment Control, monitor & report Implement • Manage through Action Plan • Monthly Reporting • e-Smart Understand • Annual Implementation Plan & organise plan • 6 weekly meetings
 Energy Management is about reducing waste Reduce energy use and costs AND not adversely impact the operation of the site. Performance improvements need to be measured in KPI’s. • Westpac A/C Focus on making good business decisions – any green benefits are the icing on the cake.
 You Need to Measure to Manage Energy management needs commitment Customers should expect a return on investment. Westpac recovers more than $2 for every $1 they have spent on EM. Energy needs to be actively managed Benchmarking and targets identify issues, drive improvement Regular reporting is required - add intelligence to information Action plan implementing cost effective solutions Don’t be scared to spend money on Advice!
 Understand Your Site/Portfolio How Much Energy do I use? How much is it costing me?
 How does this site compare? What is a common unit of measure? k. Wh? FTE’s? Output? What is the trend? How does it compare to similar sites?
 How can I as an FM make energy savings? Minimise the energy costs Review the operational requirements of the current tenant Compare against your building plant operating hours Invest in cost-effective improvements Use life-cycle costing Start a structured programme with regular reviews
 Energy Supply Cost Key information How much has") Reduce energy costs to your site(s) Energy Supply Cost Key information How much has it cost me last year? and What will it cost me next year? Tender for the supply of energy gain best price Always avoid default rates. Our experience: two out of three tenders lead to a change in supplier based usually on price Myth of Security of Supply
Reduce energy costs to your site(s) Energy Supply Cost Key information How much has it cost me last year? and What will it cost me next year? Tender for the supply of energy gain best price Always avoid default rates. Our experience: two out of three tenders lead to a change in supplier based usually on price Myth of Security of Supply
 – Part 2 Network and line costs Network") Reduce energy costs to your site(s) – Part 2 Network and line costs Network costs are NOT fixed and NOT only Daily charge Network Optimisation: Review nominated capacity charges (HV) Ensure that you are in the best network load group Check every couple of years! Examples: Food: In Christchurch changed load group on 3 sites with annual savings over $160, 000 p. a. School: Increase capacity & change load group, savings $10, 000 p. a. Power factor - penalty charges introduced by Vector 2012
Reduce energy costs to your site(s) – Part 2 Network and line costs Network costs are NOT fixed and NOT only Daily charge Network Optimisation: Review nominated capacity charges (HV) Ensure that you are in the best network load group Check every couple of years! Examples: Food: In Christchurch changed load group on 3 sites with annual savings over $160, 000 p. a. School: Increase capacity & change load group, savings $10, 000 p. a. Power factor - penalty charges introduced by Vector 2012
 – Part 3 Impact Having gained the best") Reduce energy costs to your site(s) – Part 3 Impact Having gained the best possible delivered energy price for your site or sites: Any investment decisions can be made based on a solid foundation.
Reduce energy costs to your site(s) – Part 3 Impact Having gained the best possible delivered energy price for your site or sites: Any investment decisions can be made based on a solid foundation.
 Where does energy normally get consumed in an office building? 73/20 RULE
 Review site operating requirements and current control settings Establish current building system operating requirements What is plant controlling? time clock, security system, BMS What is the time on the controlling system? When is plant set to turn on and off? Review regularly as site operations change. Do not be surprised is time of the time clock or other controls are wrong! “Lazy running” - Daylight savings often see plant running an hour longer than required every day
 • Reset public Holidays annually • Change for daylight savings 2 x p. a. Programme for 5 years GOOD INVESTMENT?
 Controller Maintenance in Action Westpac established a set operating schedule for a branch and installed many smart relays to lock this in. Westpac monitors operating times using smart meter energy profile information After Hours baseload Weekend load/profile Public Holiday load/profile
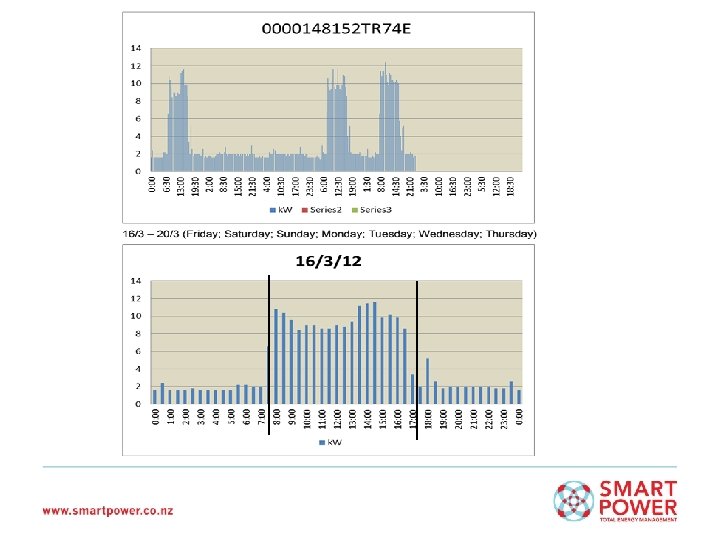
 Smart meter energy profile information Waste A/C - 108 hours/week Approx $5, 000 p. a.
 Smart meter energy profile information
 Saving Energy is about Reducing Waste Actively manage control systems Building walk through - outside normal operating hours! Identify controllable loads Identify control options that are cost effective Sensor; time switch; Use existing control system or install new control systems?
 looks at the") Use Life Cycle costing to establish benefit Life cycle costing (LCC) looks at the maintained life of a system over a period of time to provide a more accurate view of the financial benefits of each option. LCC factors in the: • Purchase cost; and • Energy cost; and • Maintenance costs of the system. There are very few energy related opportunities that can be justified on energy reduction alone.
Use Life Cycle costing to establish benefit Life cycle costing (LCC) looks at the maintained life of a system over a period of time to provide a more accurate view of the financial benefits of each option. LCC factors in the: • Purchase cost; and • Energy cost; and • Maintenance costs of the system. There are very few energy related opportunities that can be justified on energy reduction alone.

 What is not working well in terms of Energy Management A large number of sophisticated control systems are failing to deliver the benefits for the end users REASON: No-one is actively managing these systems. This is a LOSE-LOSE: High OPEX costs increases costs to tenants and reduces value of building. Unless these systems are managed in a continuous and proactive manner there is no financial benefit derived from having them installed. A $100, 000 BMS is (often) just an expensive time clock
 SOLUTION Use a third party to manage control systems! Removes risk of knowledge being lost when an employee moves on. These “management costs” should form part of the OPEX for the building and be passed through to Tenant(s) in all lease agreements. Financial Benefits will exceed Management costs, reducing OPEX Creates a WIN-WIN
 Key areas to focus for low cost benefits Ensure the technology you already have is actively managed Use metering information. Saving 1 k. W baseload saves more that 6, 000 k. Wh pa ~ $900 Consider professional help - it will be cost effective! You need to measure to manage. Monitor and report operational savings (energy and other system savings). Use action plans and targets (with regular meetings). The old adage is true - a team works better than an individual
 More Information or Assistance If you want further information on this presentation, or assistance with the energy management on your site, please contact: Peter Mc. Keown peter@smartpower. co. nz
 Smart Metering – what it means for businesses Thursday 13 September, 2012 Hamish Mc. Ewen, Business Marketing Manager Meridian Energy September 2012
 A meter is a meter, unless it’s a smart meter • Records half-hourly consumption data. • Regularly transmits consumption data. • Remotely receives meter configuration data. • What they are not… – A check meter – A control device
 The benefits of awareness • Knowing what, how, and when, power is being used provides for the opportunity to make changes. – – Consumption across a week Performance monitoring Budgeting WEEK Consumption during the day DAY
 Combining and comparing data • Benchmarking • Industry trends and behaviours Single site consumption compared to city average Day time consumption patterns across industries
 Smart meters enable the development of new pricing structures DAY • Measuring consumption in 30 min intervals allows for pricing at 30 min intervals. • Electricity pricing in the New Zealand market follows supply and demand triggers, on a daily, weekly and yearly basis. WEEK Sunday Saturday YEAR Summer Winter Summer
 Time-of-use or not time-of-use Sculptured Market pricing Schools Pubs and taverns Grocery and supermarkets Cafes and restaurants Retail 00: 00 24: 00
 Access and deployment • Smart meter deployment is continuing across NZ. • Access to data is becoming available to customers. • Retailers are developing systems that will incorporate data from different meters providers. • Smart meters can be installed outside of roll-out programmes… but may incur a cost.
 Smart meter takeaways • Awareness and monitoring can save money • Pricing plans that better fit industry consumption are coming • Smart meters can be installed at customer request – if interested talk to one us.
 Smart metering
 Why? • To better understand electricity usage across multiple sites • Identify opportunities to reduce emissions • Lower consumption costs • Provide real-time feedback on variances and potential issues • Eliminate need for meter reading and bill estimates
 How? • National deployment • Data analysis and reporting • Corrective actions • Performance monitoring
 National Deployment- Site Analysis Photographic review of existing installation
 Deployment - Site Analysis At times, getting the right photo was a childrens game of “hot and cold”……. Warmer…. Really warm….
 Deployment - Site Analysis At times, getting the right photo was a childrens game of “hot and cold”……. Cold!
 installation process…… – Arc Innovation set up") National Deployment - Site Preparation The (simplified) installation process…… – Arc Innovation set up steps – Westpac engagement to allow for installation – Westpac to IT server management – Meter installation Installation challenges – Contractor failure – IT hardware failure – Insufficient space for installation – Unusual cross-tenancy metering – Embedded networking (under contract)
National Deployment - Site Preparation The (simplified) installation process…… – Arc Innovation set up steps – Westpac engagement to allow for installation – Westpac to IT server management – Meter installation Installation challenges – Contractor failure – IT hardware failure – Insufficient space for installation – Unusual cross-tenancy metering – Embedded networking (under contract)
 National Deployment - Data Analysis and Reporting The smart meter interval data allows you to understand more about your sites Analysing the data allows you to identify peak/off-peak consumption, developing an energy index, sites with issues, etc…
 National Deployment - Data Analysis and Reporting What the data won’t tell you: • The root cause of excessive consumption • Whether consumption behaviour is human or controlled
 National Deployment - Data Analysis and Reporting While Meridian are developing a web based portal for reporting and data analytics, Westpac were keen to realise the benefits of smart meter data. The reporting tool is based on a scoring system which rates the performance of each site on performance criteria: • Energy Index (benchmarked and scaled) • Peak average (benchmarked and scaled) • Off peak average (benchmarked and scaled) • Consumption on weekends/public holidays
 National Deployment Data Analysis and Reporting Benchmarking figures: • Energy Index – 161 • Peak average – 9 kwh • Off peak average – 3 kwh These benchmarking figures are derived from the smart meter data. Poor performing sites were removed from this calculation.
 Case Study Kilbirnie Corrective Action Post corrective action performance • The off-peak average load for this site was reported as 6. 1 kwhr (compared to the Westpac branch portfolio average of 3. 04 kwhr). • Work commenced at Kilbirnie branch on 26 th July, to install the data loggers and carry out an evaluation of the site HVAC control system. Savings as a result of the works undertaken
 Summary Kilbirnie Average weekly energy use per hour prior Smart meters : 11. 15 KW Per hour New average weekly energy use per hour : 5. 83 KW per hour Estimated savings $6500. 00 PA Return on investment 2 months.
 What’s Next? Meridian to advise on web tool and escalation plan • BAU – ongoing performance monitoring • Westpac to review audit templates and audit protocols for service contractors – reduce cost of “fix” • Westpac to review PPM task list for service contractors • Ongoing re-commissioning is essential • “Smart building controls” – “Smart Buildings” – “Smart Savings” • Focus on asset management & performance • “Green Design” • Sustainability focus • Cost Savings – Bottom Line
 FMANZ gratefully acknowledges the support of our Gold Sponsors