

6038edb9e3e17d770b94f9298325ebd1.ppt
- Количество слайдов: 51
 Florida’s PS/Rt. I Project: Evaluation of Efforts to Scale Up Implementation Jose Castillo, MA Clark Dorman, Ed. S. George Batsche, Ed. D. Michael Curtis, Ph. D.
 Presentation Overview • Rationale for Comprehensive PS/Rt. I Evaluation Model • Florida PS/Rt. I Project Overview • Evaluation Model Philosophy • Evaluation Model Blueprint • Examples of Data Collected • Preliminary Outcomes
 Reasons to Evaluate PS/Rt. I • Determine impact of PS/Rt. I on student performance – NCLB – IDEA • SPED rule revisions – EBD – SLD • States Implementing PS/Rt. I – – – Florida Illinois Iowa, Michigan Wisconsin
 Additional Research Needed • Literature on PS/Rt. I Outcomes: – Small number of buildings included – Focused primarily on student and systemic outcomes – Limited focus on variables that might predict improved outcomes • More data needed on: – Beliefs, practices, skills, and satisfaction of educators responsible for implementation – Implementation of the model across service delivery tiers – How implementation integrity relates to outcomes – How student and staff variables impact implementation and outcomes
 Brief FL PS/Rt. I Project Description Two purposes of PS/Rt. I Project: – Statewide training in PS/Rt. I – Evaluate the impact of PS/Rt. I on educator, student, and systemic outcomes in pilot sites implementing the model
 Statewide Training Sites
 Pilot Site Project Overview • 3 year project • School, district and Project personnel work collaboratively to implement PS/Rt. I model • Training, technical assistance, and support provided to schools • Purpose = program evaluation
 Project Staff Regional Coordinators /Trainers • Beth Hardcastle - North - Hardcast@coedu. usf. edu • Denise Bishop - Central - Bishop@tempest. coedu. usf. edu • Kelly Justice - South - Justice@coedu. usf. edu Project Leader • Clark Dorman - Dorman@coedu. usf. edu Co-Directors • George Batsche - Batsche@tempest. coedu. usf. edu • Mike Curtis - Curtis@tempest. coedu. usf. edu Project Evaluators • Jose Castillo - Castillo@coedu. usf. edu • Connie Hines - Hines@tempest. coedu. usf. edu Staff Assistant • Stevi Schermond - Schermon@coedu. usf. edu
 Mini-Grant Application • • Applications sent to all 67 FL districts Criteria for Choosing Pilot Districts 1. District and Pilot Schools Commitment 2. District, Pilot, and Comparison Schools Demographic Data 3. Statement of Need and Objectives 4. District and Pilot Schools Experience with Initiatives and Programs 5. District Personnel Resources and Technology
 Selected Pilot Sites • 12 school districts applied • 8 school districts selected to participate through competitive application process – 40 demonstration schools – 33 matched comparison schools • Data collected from/on: – Approximately 25 -100 educators per school – Approximately 300 -1200 students per school • Districts and schools vary in terms of – Geographic location – Student demographics – School size
 Demonstration Districts
 Services Provided by Project I. Services Provided to Demonstration Sites by Statewide Project Staff – – Funding for up to two Coaches Training, T/A for Coaches & Building Administrators Training, T/A for School-based Teams T/A in use of Technology and Data
 Expectations for Pilot Sites II. Expectations of Demonstration Districts and Pilot Sites – Collaboration between General Ed, Special Ed, and other projects – People with expertise - district and school level teams – Funds/Resources - evidenced based instruction and intervention, – Professional Development - support and attend – Policies and Procedures – Technology/Data Systems – Making changes when the data indicate
 Year 1 Focus
 Three Tiered Model of School Supports - Tier I Focus Behavioral Systems Academic Systems Tier 3: Comprehensive and Intensive Interventions Individual Students or Small Group (2 -3) Reading: Scholastic Program, 1 -5% Tier 3: Intensive Interventions Individual Counseling FBA/BIP Prevent, Teach, Reinforce (PTR) Assessment-based Intense, durable procedures 1 -5% Reading, Mastery, ALL, Soar to Success, Leap Track, Fundations Tier 2: Strategic Interventions Students that don’t respond to the core curriculum Reading: Soar to Success, Leap Frog, CRISS strategies, CCC Lab Math: Extended Day Writing: Small Group, CRISS strategies, and “Just Write Narrative” by K. Robinson Tier 1: Core Curriculum All students Reading: Houghton Mifflin Math: Harcourt Writing: Six Traits Of Writing Learning Focus Strategies 5 -10% Tier 2: Targeted Group Interventions Some students (at-risk) Small Group Counseling Parent Training (Behavior & Academic) Bullying Prevention Program FBA/BIP Classroom Management Techniques, Professional Development Small Group Parent Training , Data 5 -10% Students 80 -90% Tier 1: Universal Interventions All settings, all students Committee, Preventive, proactive strategies School Wide Rules/ Expectations Positive Reinforcement System (Tickets & 200 Club) School Wide Consequence System School Wide Social Skills Program, Data (Discipline, Surveys, etc. ) Professional Development (behavior) Classroom Management Techniques, Parent Training
 Change Model Consensus Infrastructure Implementation
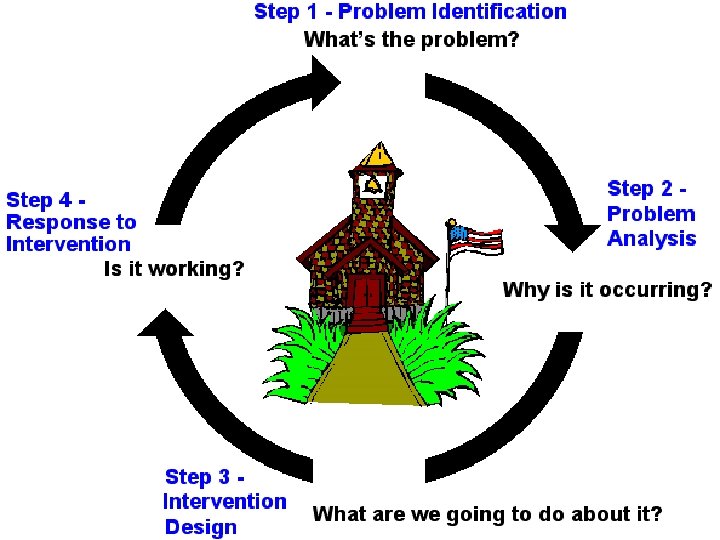
 Training Curriculum • Year 1 training focus for schools – Day 1 = Historical and legislative pushes toward implementing the PSM/Rt. I – Day 2 = Problem Identification – Day 3 = Problem Analysis – Day 4 = Intervention Development & Implementation – Day 5 = Program Evaluation/Rt. I • Considerable attention during Year 1 trainings is focused on improving Tier I instruction
 Evaluation Model
 Difference Between Evaluation & Research “Prove” “Improve” Research Evaluation Higher Certainty Lower Relevance Higher Relevance
 Working Definition of Evaluation • The practice of evaluation involves the systematic collection of information about the activities, characteristics, and outcomes of programs, personnel, and products for use by specific people to reduce uncertainties, improve effectiveness and make decisions with regard to what those program, personnel, or products are doing and affecting (Patton).
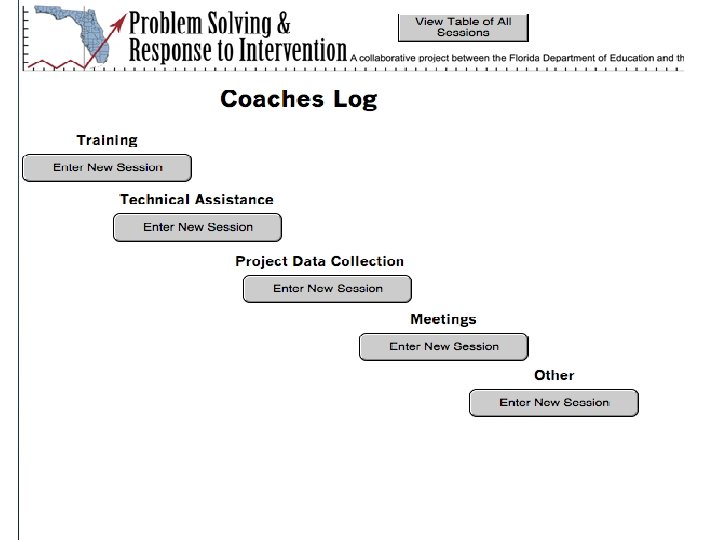
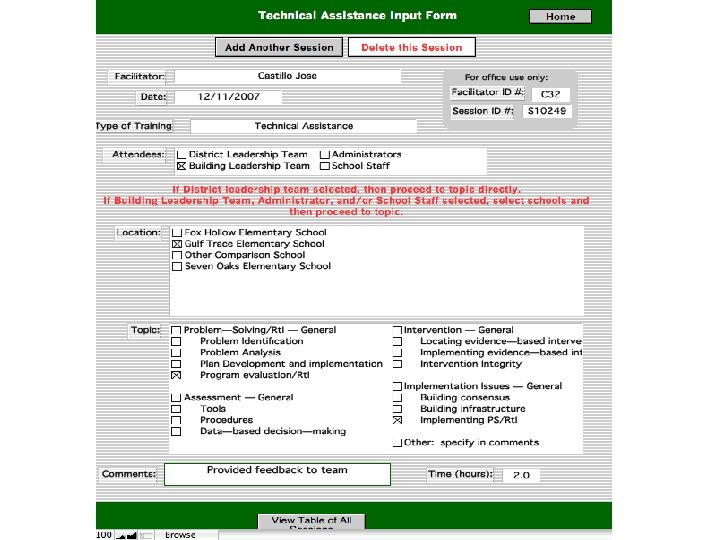
 Data Collection Philosophy • Data elements selected that will best answer Project evaluation questions – Demonstration schools – Comparison schools when applicable • Data collected from – Existing databases • Building • District • State – Instruments developed by the Project • Data derived from multiple sources when possible • Data used to drive decision-making – Project – Districts – Schools
 FL PS/Rt. I Evaluation Process Program Goals Needs Assessment Program Planning Service Delivery Process Evaluation Formative Evaluation Summative or Outcome Evaluation
 FL PS/Rt. I Evaluation Model • IPO model used • Variables included – Levels – Inputs – Processes – Outcomes – Contextual factors – External factors – Goals & objectives
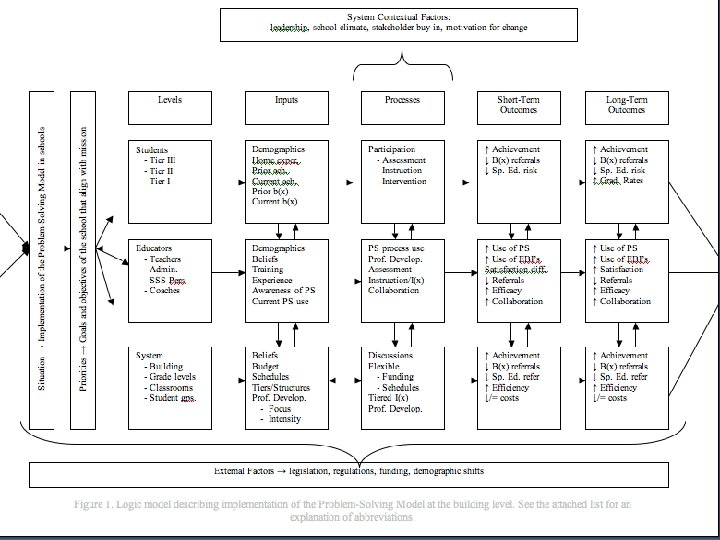
 Levels • Students – Receiving Tiers I, II, & III • Educators – – Teachers Administrators Coaches Student and instructional support personnel • System – – District Building Grade levels Classrooms
 • Students – Demographics – Previous learning experiences &") Inputs (What We Don’t Control) • Students – Demographics – Previous learning experiences & achievement • Educators – – Roles Experience Previous PS/Rt. I training Previous beliefs about services • System – Previous consensus regarding PS/Rt. I – Previous PS/Rt. I infrastructure • • Assessments Interventions Procedures Technology
Inputs (What We Don’t Control) • Students – Demographics – Previous learning experiences & achievement • Educators – – Roles Experience Previous PS/Rt. I training Previous beliefs about services • System – Previous consensus regarding PS/Rt. I – Previous PS/Rt. I infrastructure • • Assessments Interventions Procedures Technology


 • Students – Assessment participation (e. g. , DIBELS screening)") Processes (What We Do) • Students – Assessment participation (e. g. , DIBELS screening) – Instruction/intervention participation • Educators – Frequency and duration of participation in PS/Rt. I Project training – Content of Project training in which they participated • System – – Frequency & duration of professional development offered by the Project Content of professional development offered Stakeholders participating in professional development activities Communication between Project and districts/buildings
Processes (What We Do) • Students – Assessment participation (e. g. , DIBELS screening) – Instruction/intervention participation • Educators – Frequency and duration of participation in PS/Rt. I Project training – Content of Project training in which they participated • System – – Frequency & duration of professional development offered by the Project Content of professional development offered Stakeholders participating in professional development activities Communication between Project and districts/buildings
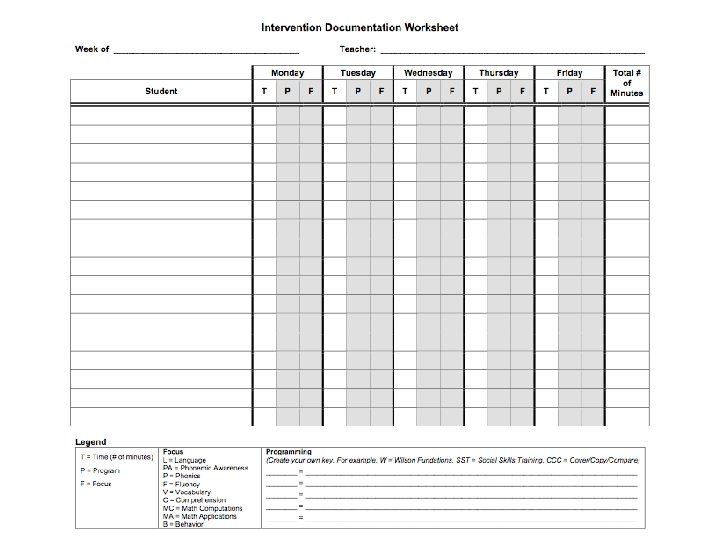
 Implementation Integrity Checklists • Implementation integrity measures developed • Measure – Steps of problem solving – Focus on Tiers I, II, & III • Data come from: – Permanent products (e. g. , meeting notes, reports) – Problem Solving Team meetings
 • Educators – Consensus regarding PS/Rt. I •") Outcomes (What We Hope to Impact) • Educators – Consensus regarding PS/Rt. I • Beliefs • Satisfaction – PS/Rt. I Skills – PS/Rt. I Practices
Outcomes (What We Hope to Impact) • Educators – Consensus regarding PS/Rt. I • Beliefs • Satisfaction – PS/Rt. I Skills – PS/Rt. I Practices
 PS/Rt. I Model Tier III Behavior 5% of Students Academic Tier II 10 -15% More Students Tier I ALL STUDENTS 80 -90% of Students Respond T III: COMPREHENSIVE INTERVENTION: T I + T III Students with Intensive Needs Problem Solving and Progress Monitoring Specialized Procedures, of Longer Duration Frequent, Assessment-Based Diagnostics, Progress Monitoring, Rate of Learning T II: SUPPLEMENTAL INTERVENTION: T I + T II: Targeted Group Interventions Problem Solving to Identify Students At-Risk Implement Standard Treatment Protocol High Efficiency, Rapid Response Progress Monitoring, Rate of Learning T I: UNIVERSAL INSTRUCTION: School-Wide Systems Implement Core Instruction Universal Screening, Benchmark Assessment All Students, All Settings Preventive, Proactive
 Outcomes cont. • System – PS/Rt. I Infrastructure • • • Assessments Interventions Procedures Technology Costs – PS/Rt. I Implementation
 Outcomes cont. • Students – Academic achievement – Behavioral outcomes • Systemic – Discipline referrals – Referrals for problem solving – Referrals for SPED evaluations – SPED placements
 Reading Instruction - Tier I Grade Level
 Reading Instruction - Tier I Classroom Level
 Reading Instruction - Students Receiving Tier II Services
 Systemic Outcomes - Office Discipline Referrals
 Other Variables to Keep in Mind • Contextual factors – Leadership – School climate – Stakeholder buy-in • External factors – Legislation – Regulations – Policy
 Factors Noted So Far • Legislative & Regulatory Factors – NCLB reauthorization – FL EBD rule change effective July 1, 2007 – Pending FL SLD rule change • Leadership – Level of involvement (school & district levels) – Facilitative versus directive styles
 School Goals & Objectives • Content Area Targets – Reading – Math – Behavior • Majority focusing on reading • Some selected math and/or behavior as well • Grade levels targeted varied – Some chose K or K-1 – Some chose K-5
 Evaluation Issues • Buy-in for intensive data collection – Schools – District research & evaluation personnel • Technology for data collection, management, & analysis • Flexibility with data collection methods needed
 Special Thanks • We would like to offer our gratitude to the graduate assistants who make the intense data collection and analysis that we are attempting possible – Decia Dixon, Amanda March, Kevin Stockslager, Devon Minch, Susan Forde, J. C. Smith, Josh Nadeau, Alana Lopez, Jason Hangauer