Financial Statements Earnings statement Depreciation Balance sheet Working

Financial Statements Earnings statement Depreciation Balance sheet Working capital Cash flow statement 8-1
Financial Statements The trio of financial statements: Earnings statement Balance sheet Cash flow statement The three financial statements are linked to each other All three are key elements to understanding the financial situation of a company 8-2
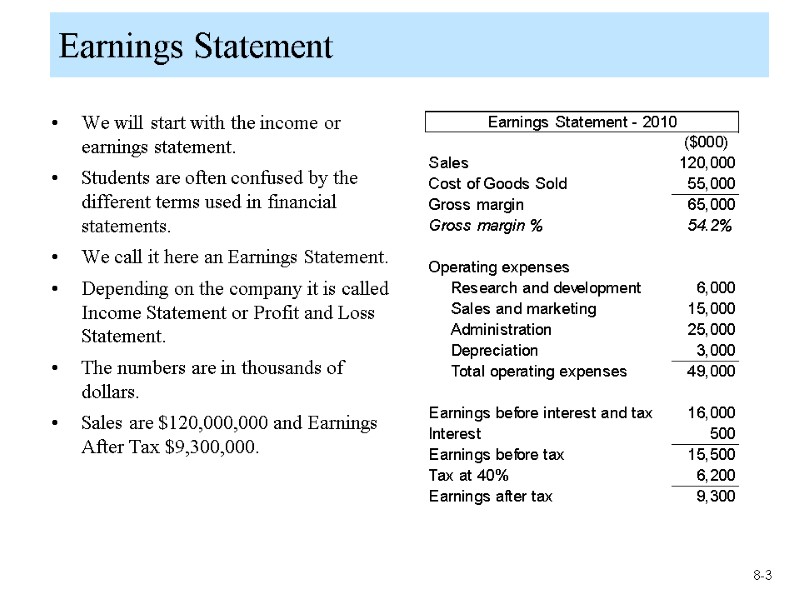
Earnings Statement We will start with the income or earnings statement. Students are often confused by the different terms used in financial statements. We call it here an Earnings Statement. Depending on the company it is called Income Statement or Profit and Loss Statement. The numbers are in thousands of dollars. Sales are $120,000,000 and Earnings After Tax $9,300,000. 8-3
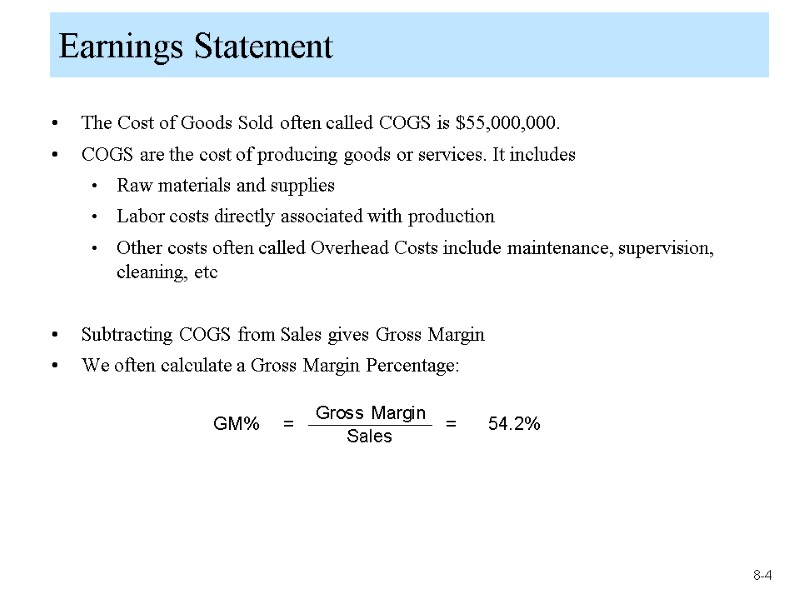
Earnings Statement The Cost of Goods Sold often called COGS is $55,000,000. COGS are the cost of producing goods or services. It includes Raw materials and supplies Labor costs directly associated with production Other costs often called Overhead Costs include maintenance, supervision, cleaning, etc Subtracting COGS from Sales gives Gross Margin We often calculate a Gross Margin Percentage: 8-4
Earnings Statement Operating costs are those not directly associated with the production of goods and services. They are indirect costs in that they cannot be directly traced to a particular product or service. Operating costs include: research and development, sales and marketing, administration such as accounting, HR, senior management, rents, utilities, insurance, etc depreciation Depreciation will need some explanation. 8-5
Earnings Statement If accept that the earnings statement should include all the costs of the running the business how can we integrate the cost of equipment and buildings? Equipment and buildings are long-term assets are “consumed” over many years. They decline in value every year and depreciation is an estimate of this decline Suppose a company buys a machine for $50,000. We assume the machine will have a life of 10 years. The depreciation is $50,000 / 10 years or $5,000 per year Accounting for depreciation is complex and outside the context of this course. For our uses, we will assume “straight line” depreciation as calculated above 8-6
Earnings Statement Earnings Before Interest and Tax is often abbreviated as EBIT. Interest is the payment on debt that the company has raised for financing. When the company has Debt it pays an interest rate, 5% for example, and this amount is entered into the Earnings Statement. Earnings Before Tax is often abbreviated as EBT. Taxes are Corporate Taxes or Profit Taxes. Do not confuse them with property taxes, payroll taxes or VAT The example company has an EBT of $15,500 Taxes are 40% or 0.40 X $15,500 = $6,200 Earnings After Tax or EAT is also called Net Income, Net Profit, Net Earnings, Income After Tax, etc. 8-7
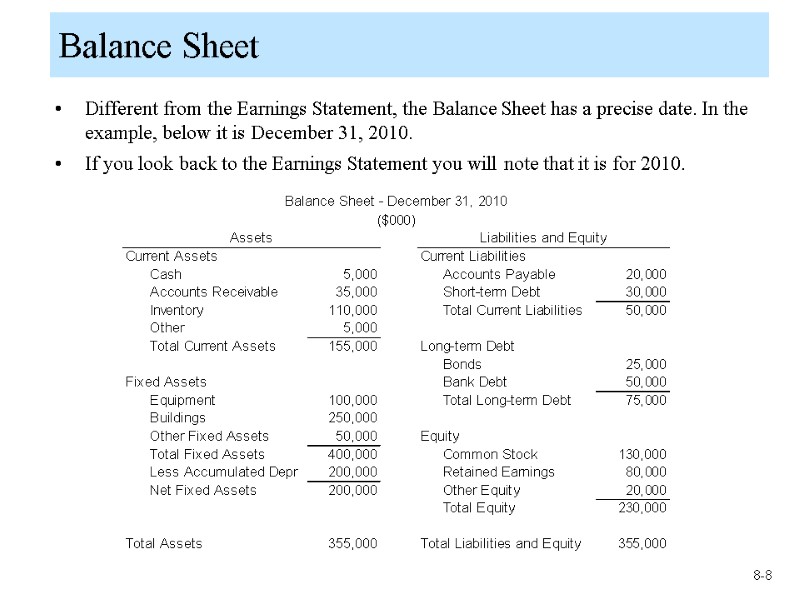
Balance Sheet Different from the Earnings Statement, the Balance Sheet has a precise date. In the example, below it is December 31, 2010. If you look back to the Earnings Statement you will note that it is for 2010. 8-8
Balance Sheet The Balance Sheet is a “picture” of the assets and liabilities of the company at a precise date. In our example, it is December 31, 2010. The Earnings Statement is a “flow” over a period of time, in our case it is the year 2010 so starting on January 1 and ending December 31. Earnings are published yearly, quarterly and monthly. Balance Sheets, in contrast, are published every six months and sometimes just at the end of the year. The Balance Sheet comprises Assets on one side and Liabilities and Equity on the other. Balance Sheets always balance: Total Assets must equal Total Liabilities and Equity. 8-9
Balance Sheet Starting with Current Assets, these are assets owned by the company that can be converted into cash in less than one year. Fixed Assets are long-term assets with a life of more than one year. Cash represents the cash on hand in company bank accounts. Accounts Receivable (AR) is the money owed to the company by its clients. In many Business to Business (B2B) sales, the sale is concluded and the customer pays in 30, 60 or 90 days. When the sale is concluded it is recorded as sales in the Earnings Statement. But the cash has not yet been received; it appears as AR in the Balance Sheet. When the client finally pays 30 or 60 days later, AR decreases by the amount of the payment and cash increases by the same amount. Many retail operations have little or no AR because customers pay at the point of sale in cash. 8-10
Balance Sheet Inventories include: raw materials, goods in the process of production, finished goods waiting to be delivered Notice that inventories are at “cost” or in other words at their purchase price or the production costs including labor and overheads. They are sold at a selling price which includes the margin. Fixed Assets are long-term assets; they include Equipment such as machines, vehicles, computers Buildings are separated from equipment because they tend to have a longer life. We sometimes add a separate line for land. Other Fixed Assets can include patents, licenses, and other similar intangible assets. 8-11
Balance Sheet Fixed Assets are recorded at their cost of purchase plus any additional costs that were necessary to engineer or install the asset. Students will remember that we had depreciation expenses in the Earnings Statement. Accumulated Depreciation in the Balance Sheet is, as the name suggests, all the depreciation from previous years plus the current year. We subtract from the cost of the asset, its accumulated depreciation to arrive to Net Fixed Assets. At the end of the asset’s useful life, the Net Fixed Asset value in the Balance Sheet will be zero because the asset has been fully depreciated. Yes, the company can still be using the equipment or building, but it will have no accounting value. 8-12
Balance Sheet Current Liabilities are for less than one year; they include Accounts Payable which is similar to Accounts Receivable because the company will purchase assets or inventory and pay suppliers at a later date. When the supplier is paid in 30 or 60 days, Cash is reduced by that same amount. Short-term debt is the amount due to lenders at the time the Balance Sheet has been prepared, but will be due within the next year. Companies will also delay payments for taxes, benefits, etc, these are also current liabilities. Long-term Liabilities are for longer than one year and comprise: Bonds is a type of borrowing; the company issues bonds to raise funds and promises to pay holders of the bonds regular interest payments and then the amount of the bond. Bank Debt is also a type of borrowing; the company borrows instead from a bank. More on bonds and bank debt later. 8-13
Balance Sheet Perhaps the best way to explain equity is to start with investors. Holders of bonds and bank debt are investors. If you purchase a share of the company you become an equity investor. Different from holders of bond and bank debt, shareholders are owners of the company. Equity in the Balance Sheet represents what the company owes its owners. Equity includes Common Shares corresponding to the amount equity investors have contributed to the company Retrained Earnings or the cumulated amount of earnings stayed in the company since its creation. The Earnings on the Earnings Statement for 2010 is $9,300,000. The company may pay some of those earnings to shareholders as dividends; the remaining earnings are “retained”. Other equity can include reserves, other types of shares and earnings 8-14
Working Capital We have already seen that there is a difference between the date when a sale is recorded and the date when the customer actually pays. The difference creates an account receivable. The same delay occurs for a company who accepts delivery of raw materials and pays suppliers at a later date. It creates an account payable. Accounts Receivable and Accounts Payable occur because of timing differences. Other timing differences occur in the operation and notably with inventory We can describe the timing differences as the working capital cycle. Often the first thing to be done is to order raw materials Then we will make the order. Once made, it may sit in inventory until the customer wants delivery We make the sale by delivering and then await payment. 8-15
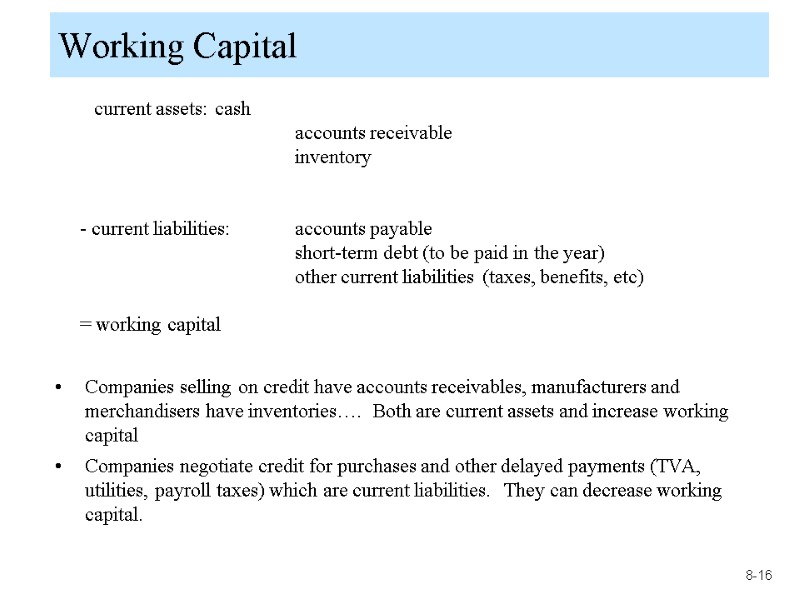
Working Capital current assets: cash accounts receivable inventory - current liabilities: accounts payable short-term debt (to be paid in the year) other current liabilities (taxes, benefits, etc) = working capital Companies selling on credit have accounts receivables, manufacturers and merchandisers have inventories…. Both are current assets and increase working capital Companies negotiate credit for purchases and other delayed payments (TVA, utilities, payroll taxes) which are current liabilities. They can decrease working capital. 8-16
Working Capital Students can understand that working capital is necessary, but should be reduced as much as possible. If customers are paying in 30, 60 ,90 days, companies still need to purchase raw materials, pay workers and rents, hire consultants. The delay in cash payments require companies to seek additional financing. We call this working capital financing and will study it further later. Note that companies have different working capital needs. Consider a retailer, a supermarket for example, whose customers pay in cash and who pays suppliers in 90 days The supermarket can have very low working capital and perhaps even negative working capital 8-17
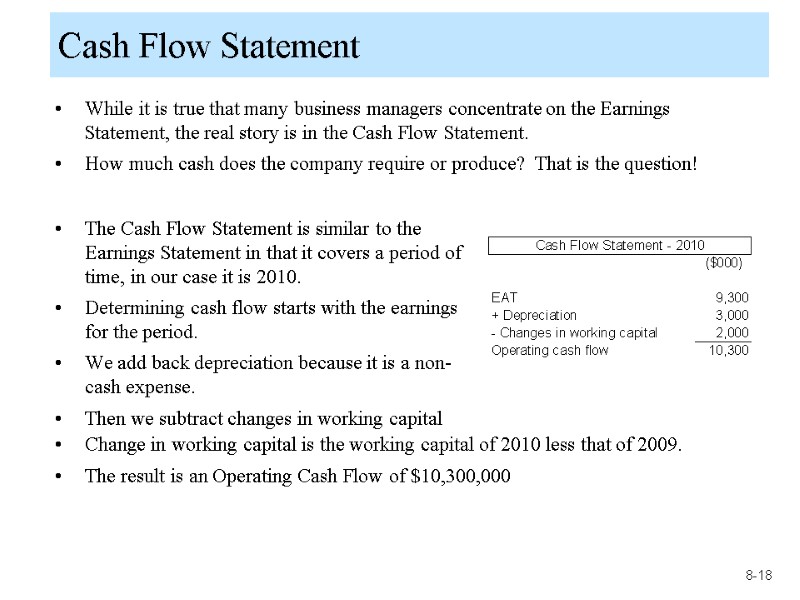
Cash Flow Statement While it is true that many business managers concentrate on the Earnings Statement, the real story is in the Cash Flow Statement. How much cash does the company require or produce? That is the question! Change in working capital is the working capital of 2010 less that of 2009. The result is an Operating Cash Flow of $10,300,000 The Cash Flow Statement is similar to the Earnings Statement in that it covers a period of time, in our case it is 2010. Determining cash flow starts with the earnings for the period. We add back depreciation because it is a non-cash expense. Then we subtract changes in working capital 8-18
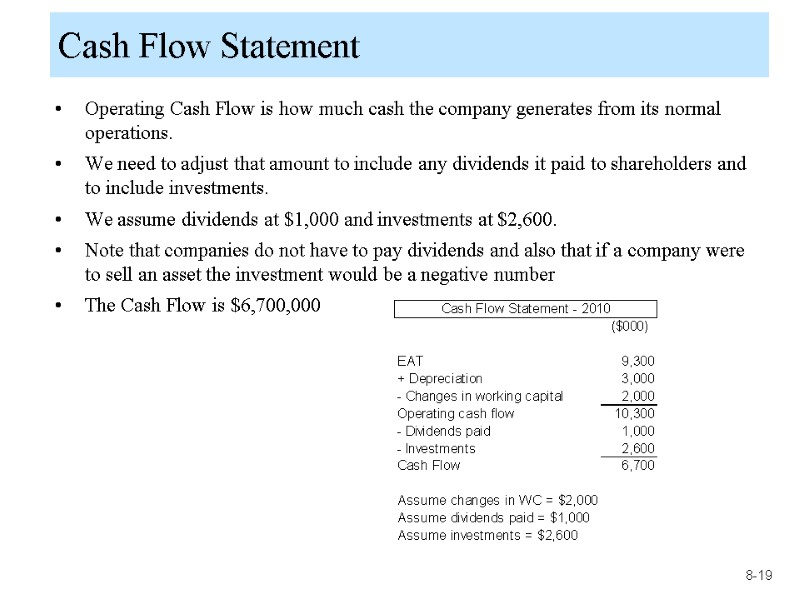
Cash Flow Statement Operating Cash Flow is how much cash the company generates from its normal operations. We need to adjust that amount to include any dividends it paid to shareholders and to include investments. We assume dividends at $1,000 and investments at $2,600. Note that companies do not have to pay dividends and also that if a company were to sell an asset the investment would be a negative number The Cash Flow is $6,700,000 8-19
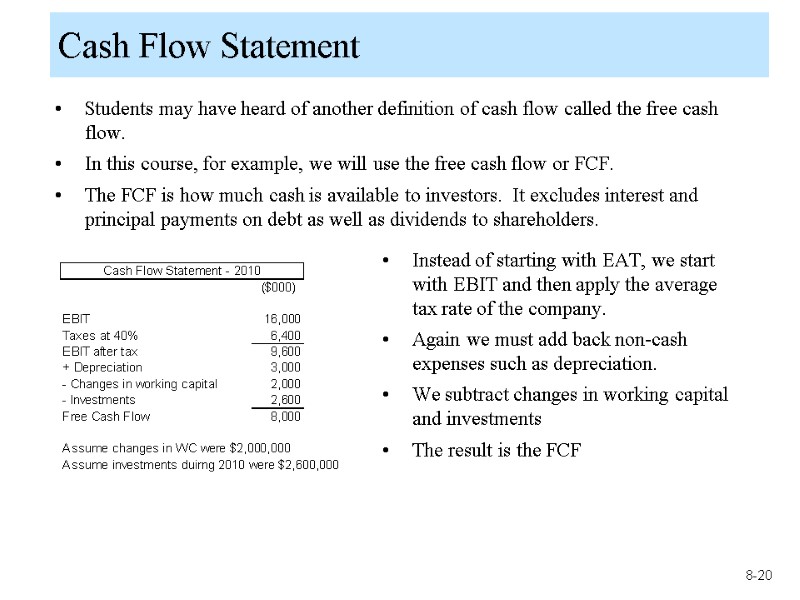
Cash Flow Statement Students may have heard of another definition of cash flow called the free cash flow. In this course, for example, we will use the free cash flow or FCF. The FCF is how much cash is available to investors. It excludes interest and principal payments on debt as well as dividends to shareholders. Instead of starting with EAT, we start with EBIT and then apply the average tax rate of the company. Again we must add back non-cash expenses such as depreciation. We subtract changes in working capital and investments The result is the FCF 8-20
7726-e8_financial_statements.ppt
- Количество слайдов: 20

