

9df10da057a6d14d29f55bd1946f5f80.ppt
- Количество слайдов: 83
 Financial crisis John H. Cochrane University of Chicago Booth School of Business
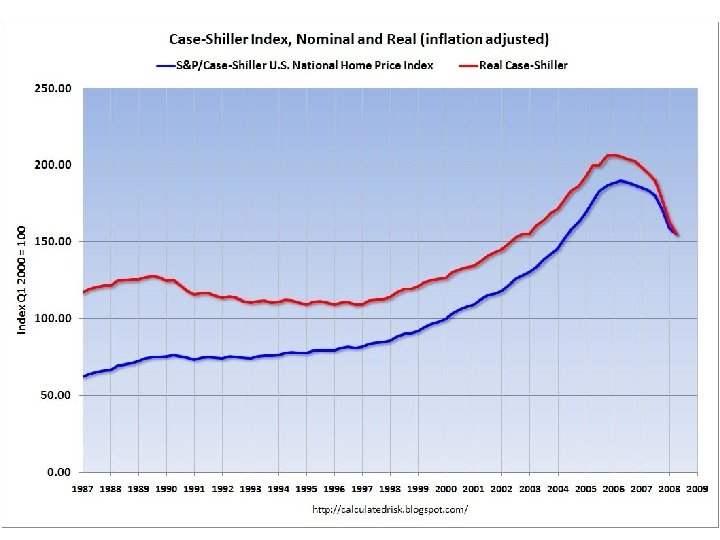
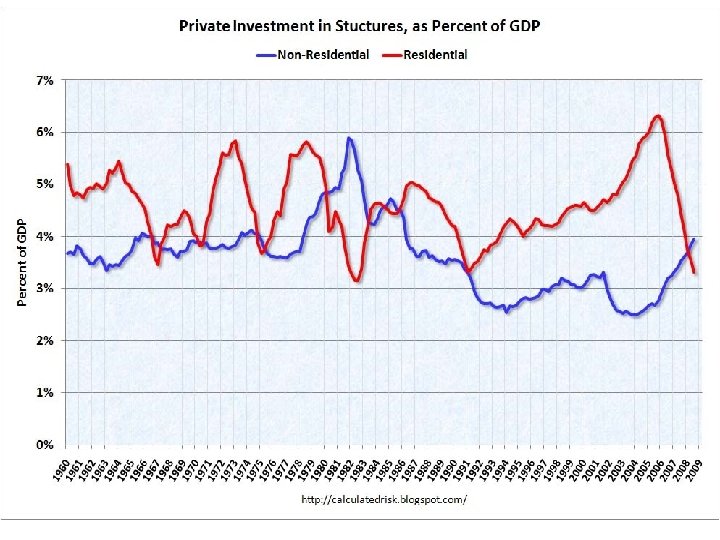
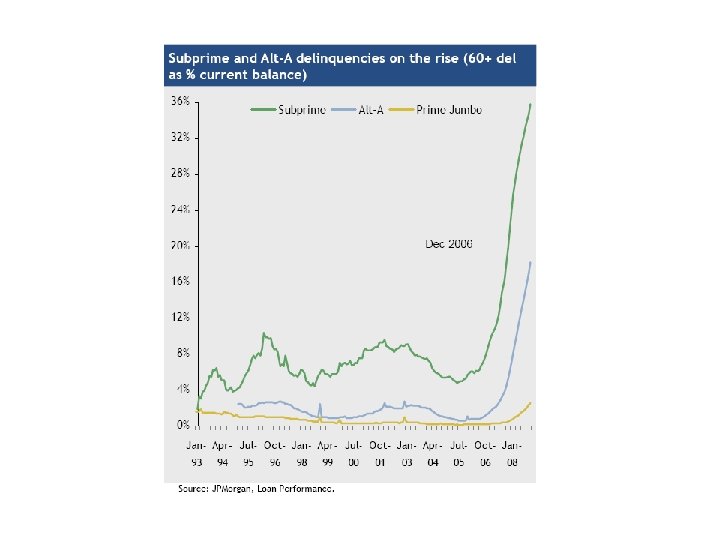
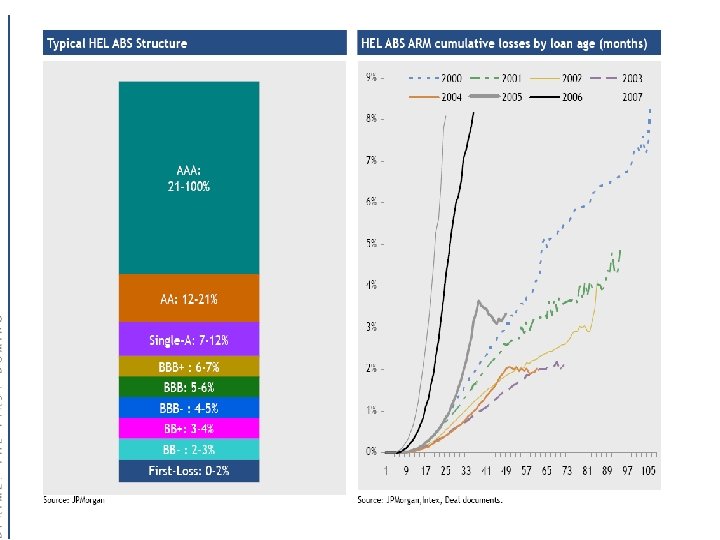
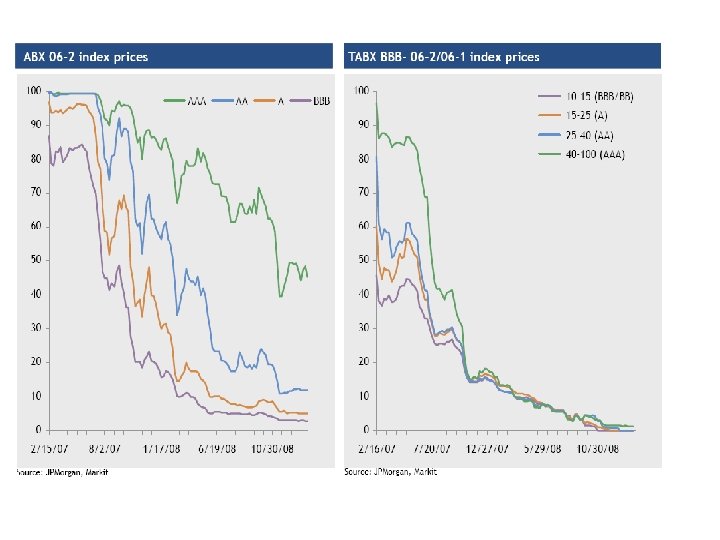
 House prices, investment • House prices rose a lot, then fell. • Residential investment (home building) fell too. It often falls first in recessions • Mortgage defaults start, especially in subprime and other mortgage products that basically invite homeowners to default if house prices go down • Defaults wipe out low tranches fast!
 Interest Rates
 In normal times, CP spreads are really low!
 A chronology of the crisis, and a sense of when things are better/worse
 The crisis. I’m interested how much is financial, how much “illiquidity, ” and how much a simple rise in credit risk and its premium. The fact that non financial AA does well and nonfinancial A 2 P 2 is even worse than financial suggests the latter interpretation to me. The credit risk premium went up – and this is just about how investors feel, not about liquidity, leveraged investors, etc.
 A closer view. CP rates. It differs a lot by maturity. I found it interesting that overnight financial and nonfinancial are the same. The banks were not having special problems borrowing overnight. Again, the poor A 2 P 2 are the ones really having problems. I think the sharp drop comes when the Fed starts buying commercial paper.
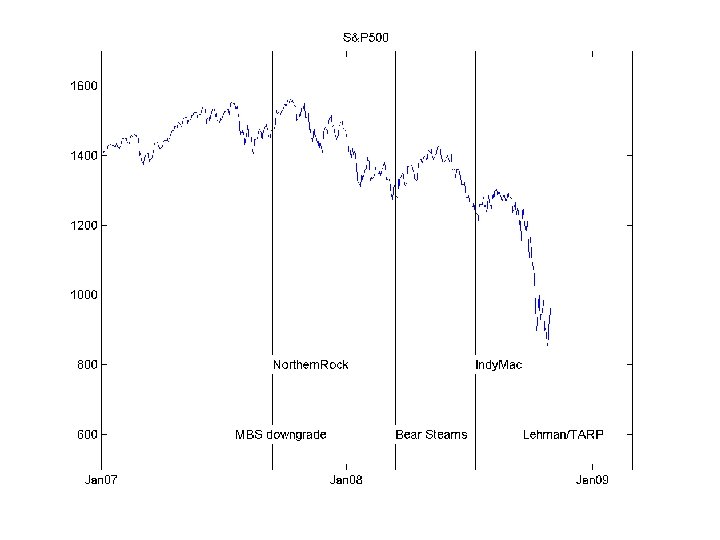
 Lehman or Tarp? Did Lehman or the Tarp speeches set off the run? This makes the case it was the TARP speeches. (With inspiration from John Taylor) It also suggests that the function of the TARP asset purchases was just to convince the markets that the government really was going to bail out citi, not “recapitalization so they could start lending”
 The bond spread widens to historic proportions. Let’s look a bit deeper…
 We worry about a crisis because “firms can’t borrow. ” But of course most firms do not depend terribly on bank financing, they can issue bonds. Also, bond issues do go straight to investors – you and I can buy the Vanguard corporate bond fund if prices are good. So, what happened to these rates? The credit spread opened to huge amounts, not seen since 1982 and near Depression levels. Interestingly though it’s because government and short rates fell not so much because corporates rose, at least until Tarp. There is nothing that “recapitalizing the banks” will do about this.
 The huge credit spread doesn’t seem that affected by the momentous events moving around short-term rates
 A bit of an update though without the nice vertical bars
. Notice 3 month bills") The Fed is easing like crazy. (More Fed policy later). Notice 3 month bills below fed funds, and notice 3 month bills actually hitting zero in Dec 2008. I think the “flight to quality” represented here is a big part of the crisis.
The Fed is easing like crazy. (More Fed policy later). Notice 3 month bills below fed funds, and notice 3 month bills actually hitting zero in Dec 2008. I think the “flight to quality” represented here is a big part of the crisis.
 CDS is the modern way to measure credit spreads. This is percent per year you have to pay for bond insurance (-200 = 2%). By summer 09 the crisis is over.
 “Arbitrage” Many markets saw “arbitrages” open up. These aren’t true arbitrages; one end is always more illiquid than the other, or has some counterparty risk, etc. But these are prices that usually are very close to each other. In each case, the leg of the arbitrage that needs cash, needs funding, or needs borrowing is underpriced. In each case, the price difference is still small enough that “long only” investors don’t really bother that much. Why does this matter? It’s certainly a sign of illiquid markets – the usual arbitrageurs are maxed out, can’t borrow, can’t raise equity -- so strategies that try to manage risk by “we’ll sell on the way down’’ rather than buy real put options will fall apart at times like these.
 Borrow dollars, buy Euros, lend euros, buy dollars forward. 20 bp is huge, because you can lever this up arbitrarily. But…”borrow dollars!” 20 bp is not enough to attract long-only money.
 Basis: by Rating (Bond-CDS) Basis Date A BBB BB 9/12/2008 54") Average Daily (Bond–CDS) Basis: by Rating (Bond-CDS) Basis Date A BBB BB 9/12/2008 54 bp 105 bp 126 bp 12/16/2008 282 388 760 10/8/2009 51 100 123 Source: J. P. Morgan Buy corporate and CDS vs. buy Treasuries. But buying corporate needs cash or repo financing, now hard to do. (Also illiquid, and CDS counterparty risk)
Average Daily (Bond–CDS) Basis: by Rating (Bond-CDS) Basis Date A BBB BB 9/12/2008 54 bp 105 bp 126 bp 12/16/2008 282 388 760 10/8/2009 51 100 123 Source: J. P. Morgan Buy corporate and CDS vs. buy Treasuries. But buying corporate needs cash or repo financing, now hard to do. (Also illiquid, and CDS counterparty risk)
 A normal treasury yield curve
 On the run/off the run spread explodes! Yield vs. duration of all outstanding treasury bonds and bills, crsp mbx database
 Credit quantities What matters to the economy of course is whether it’s hard to borrow. It’s important to distinguish “sand in the gears, ” financial dysfunction, from simple shift in the supply curve or greater credit risk. If that’s the case, fixing the banks won’t help, nor is it obvious we should help. Not every fall in quantity is a wedge between demand supply, not every project should be funded Which kinds of debt fell, and what can we tell about supply vs. demand vs. wedge between the two opening up?
 Flow of funds data—private borrowing collapses Home Date Total Mortgage Consumer Business credit Total S&L Federal financial Corp Govt sectors Foreign D. 2 Borrowing by Sector ($Billion, SAAR) 2007 2536 659 137 1252 783 186 237 1791 170 2008 1870 -58 40 551 347 43 1239 888 -129 2008 Q 4 2011 -196 -76 113 56 -3. 5 2155 554 -429 2009 Q 4 956 -370 -81 -283 94 115 1485 -1533 -547 • Massive decline in private borrowing, massive increase in government! • Which markets and channels show this huge decline? • Why? Is this “supply and demand” or “something’s wrong”?
 Flow of new lending r r Loan • “Something’s wrong” • Broken intermediary? • Capital constrained banks? • In banks or securitized debt markets? Loan • “Supply and demand” • Higher risk aversion, greater chance of default • Less demand to borrow, invest in recession?
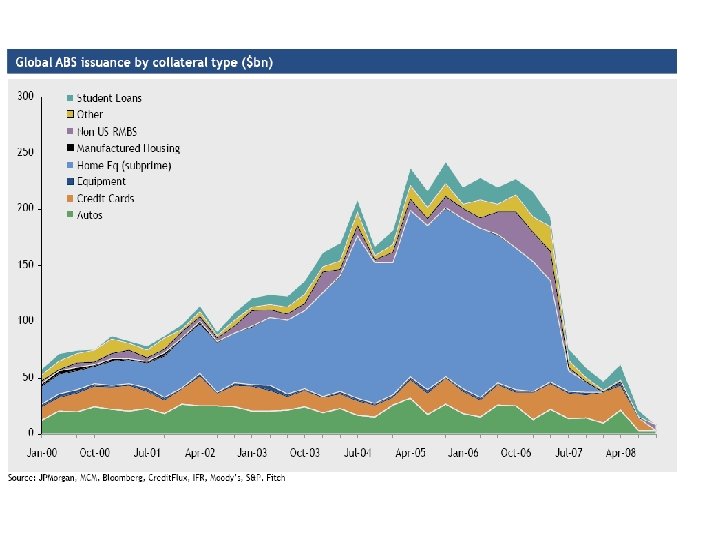
 Commerical paper issuance. Asset-backed falls apart in 2007 with the blowup of SPVs. Financial falls apart post Lehman/TARP. Nonfinancial keeps going! In fact, it increases. Savers want to put money somewere, it was easy for large safe companies to borrow commercial paper in the middle of the crisis. Newspaper hyperbole “credit markets froze” miss this fact.
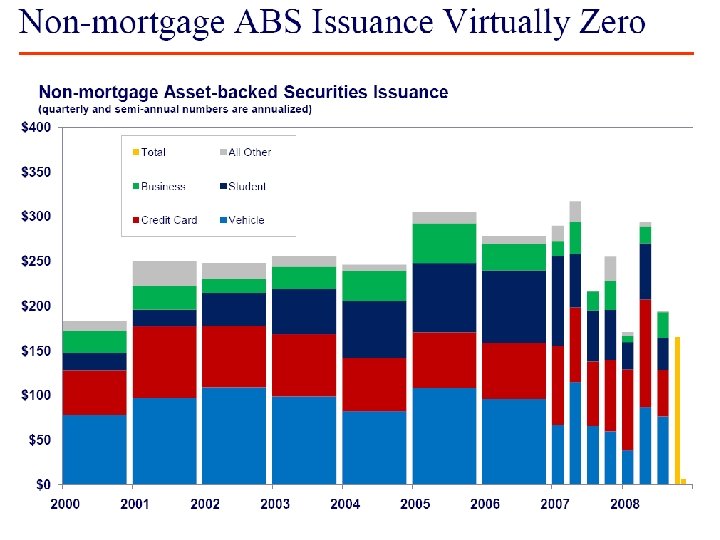
, but you’d expect to") Quantities. Yes, financial declined (and all maturities declined a lot), but you’d expect to see much worse given all the complaining.
Quantities. Yes, financial declined (and all maturities declined a lot), but you’d expect to see much worse given all the complaining.
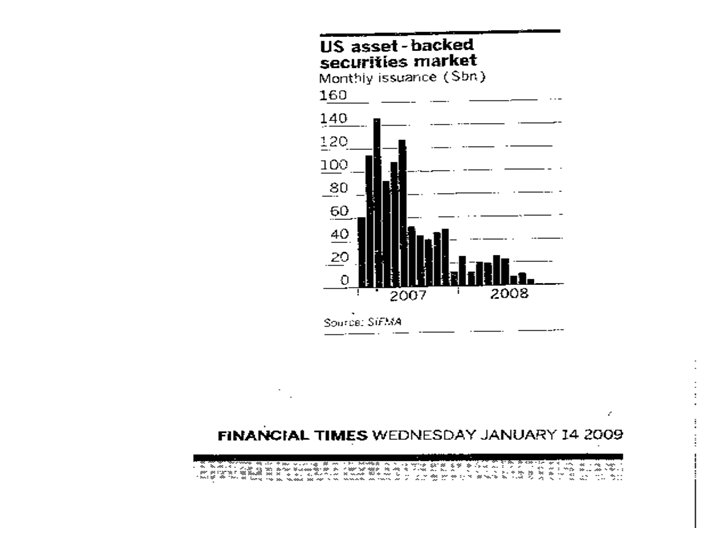
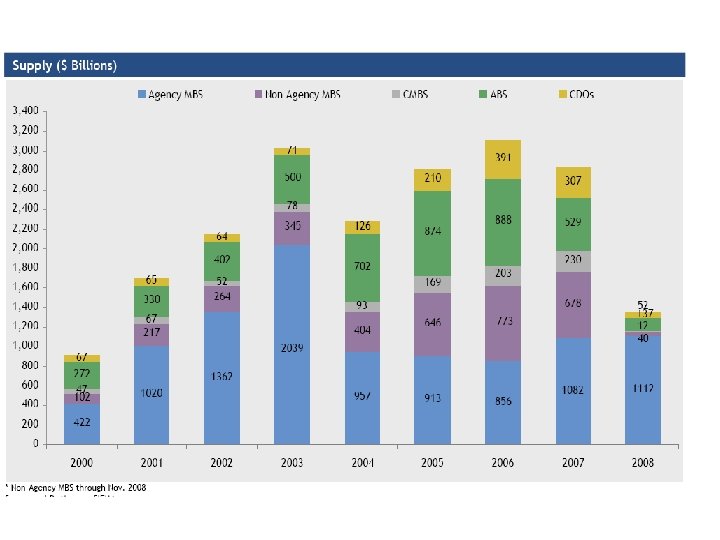
,") US Non-Agency MBS Issuance Falls off a cliff. And in 07 (along with ABS), long before TARP etc. The originate to sell model ended. If you want to see credit quantities affected by the financial crisis this is it. These are mortgage backed securities that don’t go through Fannie. Freddie, thus don’t get the government guarantee. Jumbos are an example. 70. 0 60. 0 50. 0 40. 0 30. 0 20. 0 10. 0 Nov-08 Oct-08 Sep-08 Aug-08 Jul-08 Jun-08 May-08 Apr-08 Mar-08 Feb-08 Jan-08 Dec-07 Nov-07 Oct-07 Sep-07 Aug-07 Jul-07 Jun-07 May-07 Apr-07 Mar-07 Feb-07 Jan-07 Dec-06 Nov-06 Oct-06 Sep-06 Aug-06 Jul-06 Jun-06 May-06 Apr-06 Mar-06 Feb-06 Jan-06 0. 0
US Non-Agency MBS Issuance Falls off a cliff. And in 07 (along with ABS), long before TARP etc. The originate to sell model ended. If you want to see credit quantities affected by the financial crisis this is it. These are mortgage backed securities that don’t go through Fannie. Freddie, thus don’t get the government guarantee. Jumbos are an example. 70. 0 60. 0 50. 0 40. 0 30. 0 20. 0 10. 0 Nov-08 Oct-08 Sep-08 Aug-08 Jul-08 Jun-08 May-08 Apr-08 Mar-08 Feb-08 Jan-08 Dec-07 Nov-07 Oct-07 Sep-07 Aug-07 Jul-07 Jun-07 May-07 Apr-07 Mar-07 Feb-07 Jan-07 Dec-06 Nov-06 Oct-06 Sep-06 Aug-06 Jul-06 Jun-06 May-06 Apr-06 Mar-06 Feb-06 Jan-06 0. 0
 Scale of Dealer Deleveraging in Corporate Bonds over 2007 and 2008 • A sense of how important the run in repo is Source: Primary Dealer Survey, Federal Reserve Bank of New York
 What about the Banks? Do the banks want to lend, can’t because of capital constraints? Or do the banks not want to lend, (they can’t sell loans anymore), and no amount of capital will change that fact? Distinguish “banks” (many were surely in trouble) from “banking system” (can competitors come in and take over) Bottom line: I think the evidence favors #2, and TARP purchases did not spur lending.
 Fact: Banking system did not “delever” to any great extent
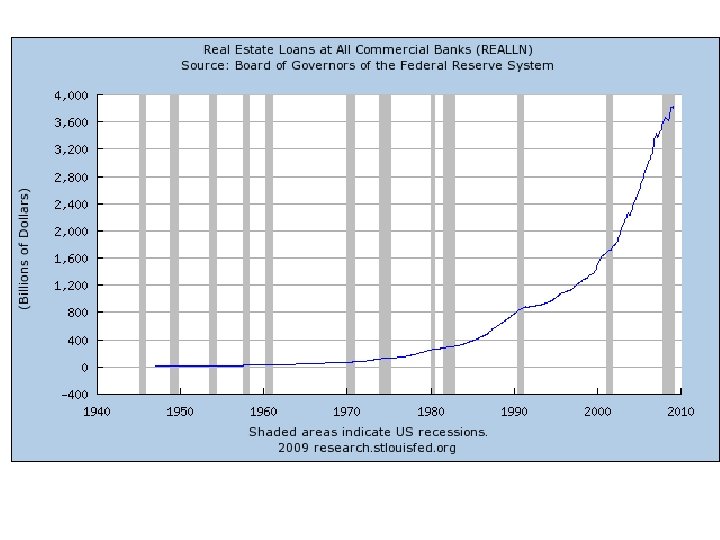
 Again, we do not see a huge decline in loans at banks
 Once again, no huge decline in lending. Actually, given the severity of the recession, it’s surprising how little lending went down.
 Bank –held debt is a small part of credit markets. Even if the “banks don’t lend”, does this matter? Source: FRB Sept 18 Flow of funds L. 1 Credit Market Debt Outstanding Description Total credit market assets held by : Household sector Nonfinancial corporate noncorporate State and local Federal Rest of world Monetary Authority Commercial banking Savings institutions Credit unions Property-casualty insurance Life insurance Private pension funds State and local retirement Federal retirement Money market mutual funds Mutual funds Closed end funds Exchange traded funds GSE Agency and GSE-backed Mortgage pools ABS Finance companies REITS Broker dealers Funding corporations 2006 45347 3865 329 109 1471 281 6198 779 8019 1519 623 814 2806 705 770 84 1561 1932 172 21 2591 3837 4069 1627 295 583 289 Pct 100 8. 5 0. 7 0. 2 3. 2 0. 6 13. 7 17. 7 3. 3 1. 4 1. 8 6. 2 1. 6 1. 7 0. 2 3. 4 4. 3 0. 4 0. 0 5. 7 8. 5 9. 0 3. 6 0. 7 1. 3 0. 6 2008 Q 2 51019 4140 169 129 1473 294 7775 538 8950 1607 686 835 2937 757 812 108 2233 2314 161 43 2995 4762 4257 1639 232 694 480 Pct 100 8. 1 0. 3 2. 9 0. 6 15. 2 1. 1 17. 5 3. 1 1. 3 1. 6 5. 8 1. 5 1. 6 0. 2 4. 4 4. 5 0. 3 0. 1 5. 9 9. 3 8. 3 3. 2 0. 5 1. 4 0. 9
 • This is what all assets and liabilities of commercial banks look like, from which the next slide is drawn
 • Banks did not delever, they actually expanded! Banks also did not conserve captal, paying dividends, bonuses, and making acquisitions. • Controversies: Much expansion came from existing lines of credit, not new lending. Much came by taking on SPV assets from unwinding of shadow system, not new lending. And many borrowers did report trouble getting loans.
 Banks Can And Do Raise Capital! The “debt overhang” story is not absolute. When banks lose money they can and do go out and raise more capital. (This being impossible is a central part of the “capital constraint” story) (source: Bloomberg. com) Firm Citigroup Inc. * Wachovia Corporation* Merrill Lynch & Co. Washington Mutual Inc. UBS AG HSBC Holdings Plc Bank of America Corp. JPMorgan Chase & Co. Morgan Stanley* IKB Deutsche Industriebank AG Royal Bank of Scotland Group Plc Lehman Brothers Holdings Inc. Credit Suisse Group AG Deutsche Bank AG Wells Fargo & Company Credit Agricole S. A. Barclays Plc Canadian Imperial Bank of Commerce Fortis* Bayerische Landesbank HBOS Plc ING Groep N. V. Societe Generale Mizuho Financial Group Inc. National City Corp. Natixis Indymac Bancorp Inc Goldman Sachs Group Inc. …… TOTAL Writedown & Loss Capital Raised 60. 8 71. 1 52. 7 11 52. 2 29. 9 45. 6 12. 1 44. 2 28 27. 4 5. 1 21. 2 20. 7 18. 8 19. 7 15. 7 14. 6 14. 8 12. 2 14. 1 23. 1 13. 8 13. 9 10. 4 3 10. 4 6. 1 10 5. 8 8. 5 7. 6 17. 9 7. 2 2. 8 7. 1 23. 1 6. 9 0 6. 8 7. 2 6. 7 4. 6 6. 6 9. 4 6. 1 0 5. 4 8. 9 5. 3 11. 8 4. 9 0 4. 9 10. 6 … … 590. 8 434. 2
 Banks Can and Do Raise Capital II Source : Anil Kashyap Includes Treasury Purchase
 • Banks can and do fail, with operations taken over and continuing under new ownership. A bank failing does not mean it cannot process new loans. In fact, sometimes it can do it better. Two lists from the internet JPMorgan Chase Bear Stearns Bank of America Merrill Lynch JPMorgan Chase Washington Mutual Wells Fargo Wachovia 5/3 Bank First Charter Bank PNC Financial Services National City Corp. #1 Northern Rock #2 Bear Stearns #3 ANB Financial #4 First Integrity Bank #5 Roskilde Bank #6 Indy. Mac #7 First Heritage Bank #8 First National Bank of Nevada #9 IKB (basically insolvent after gov't intervention) #10 Silver State #11 Fannie Mae #12 Freddie Mac #13 Lehman Brothers #14 AIG #15 Washington Mutual
 Macroeconomics and finance Is there anything for our simple models that tie macro to asset pricing to do? Or do we throw everything out and only study frictions? A: Frictions are frosting, but there is a lot of cake. Many long-only unconstrained investors were “marginal” and tried to sell. Consumption: Risk aversion rises following recent losses. (“habits”). Investment: Investment falls when stock prices (q) falls.
 X C") Rising risk aversion U(C) X C
Rising risk aversion U(C) X C
 SPC is the Cambell/Cochrane measure of consumption relative to habit. When SPC falls, prices fall, risk premia rise
 Q theory says investment falls when stock market falls. This needs no frictions or constraints
 The Fed
 §The Fed is no longer just setting the funds rate and letting others adjust. The Fed was trying to influence rates in many markets. A good issue for monetary economics is whether it actually raises rates in individual markets or just ends up supplying more money and treasury debt
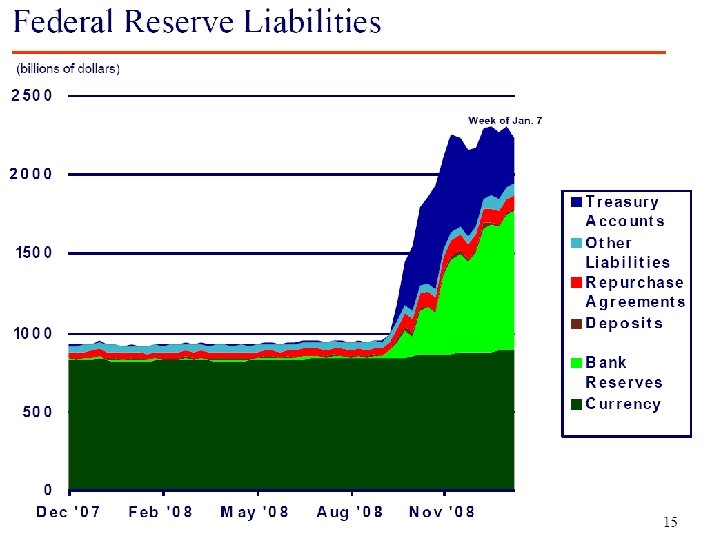
 • “Expansion of balance sheet” = printing money, lending it out. A trillion extra dollars! • Bernanke: “Milton Friedman, we won’t make the same mistake again”
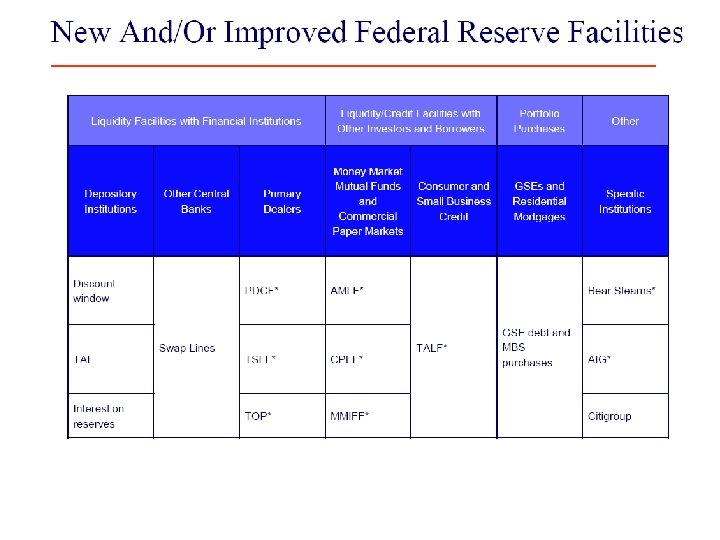
 • More detail on the many new facilities
 Balance sheet of the Federal Reserve. Millions of dollars. Data source: Federal Reserve Release H. 4. 1. Aug 8, 2007 Sep 3, 2008 Oct 22, 2008 Securities 790, 820 479, 726 490, 617 Repos 18, 750 109, 000 80, 000 Loans 255 198, 376 698, 050 Discount window 255 19, 089 107, 561 TAF 150, 000 263, 092 PDCF 102, 377 AMLF 107, 895 Other credit 90, 323 Maiden Lane 29, 287 26, 802 Other F. R. assets 41, 957 100, 524 519, 713 Factors supplying reserve funds 902, 993 939, 307 1, 839, 042 814, 626 836, 836 856, 821 30, 132 4, 670 41, 756 5, 606 95, 987 55, 625 Currency in circulation Reverse repos Treasury general Treasury supplement Reserve balances Factors absorbing reserve funds 558, 987 6, 794 3, 831 220, 762 902, 993 939, 307 1, 839, 042 120, 790 226, 357 Off balance sheet Securities lent to dealers
 Stocks You know the stock market cratered and then recovered.
 A reminder that lower p/d means a higher risk premium, quite sensible in a huge recession and the same as the higher credit spread. P/D didn’t change that much because D fell like a stone.
 Earnings may be a better divisor, since price decline anticipates lower dividends next year. This means less of a screaming buy, higher ER
 • Both actual and implied volatility rose sharply. 80%! Lots of signs of distress, forced selling, illiquidity (negative serial correlation). Vol = 20 day backward looking average volatility of daily S&P 500 index
 Vol = 20 day backward looking average volatility of daily S&P 500 index
 • People thought volatility was temporary. “Safer in long run” Source: CBOE. com
 Does the crash mean that free markets failed? New instruments, toxic derivatives, financial innovation gone amok, etc.
 Unused slides
 Ideas
Ideas
 What is the worry? • Home prices decline → defaults → mortgages worth less → banks insolvent • Who cares? • Great depression story 1: (Friedman) • Banks fail → M 1 declines • Great depression story 2: (Bernanke) • Banks fail → No banks to make loans -> savers can’t meet borrowers.
 System") A credit crunch: Banking system cannot make new loans. Interest rate Supply (savings) System Doesn’t Work Demand (investment, mortgages) Loans
A credit crunch: Banking system cannot make new loans. Interest rate Supply (savings) System Doesn’t Work Demand (investment, mortgages) Loans
 View 2: A crunch, but in debt markets not banks.
 View 3: Investor Fear + Recession Interest rate Supply Of risky debt Demand Loans A fall in loans need not mean a credit crunch
 Which is it? 1. Banking system wants to lend, but cannot. -Secretly undercapitalized, can’t get new capital. “Recapitalizing” banks would fix everything 2. Banking system doesn’t want to lend because it can’t sell in dysfunctional debt markets. 3. Nobody wants to lend because investors don’t want to hold risk.
 Summary: Bank constraint vs. Credit market Or risk premium view r r Loan • Little decline in banking system lending. • Banks can and do raise equity. • Banks can and do fail / get taken over. • Treasury purchase/debt guarantee did not stop it in tracks. • “Recapitalized banks” pay dividends, buy other banks. • High risk premiums in nonfinancial, non-intermediated assets. • Obvious huge problem in credit markets • Nothing without Govt guarantee or direct purchase is selling
 Summary so far: 1. Huge risk premium in debt markets = Large demand for Treasury debt 2. Risk premium: “precautionary savings”, lower “aggregate demand” = more demand for treasury or guaranteed debt. Policy #1 (basically good) : Fed and Treasury Accommodate demand for Treasury Debt/money Together they issue Trillions of Treasury/money to buy assets a) Act as missing intermediary b) Provide desired Gov’t debt without needing deflation
 Policy #1 danger 1. Fed is running the world’s biggest hedge fund. 2. Can we reverse all this without inflation? 3. Will the Fed be the only intermediary for a generation? 4. Is the Fed buying good, especially new, debt at market prices? 5. True blue free-market objections
 Bad Policy Ideas 1. TARP to buy troubled assets on the open market 2. TARP to buy assets from banks at artificial prices 3. Bank “recapitalization” without quick workout. 4. Forced mortgage renegotiation: a $150, 000 unemployment subsidy 5. Bailout Contagion. S&L Government, Pension Funds, … 6. Policy uncertainty, changing the rules of the game. Who will buy now? 7. Government running the banks / credit system for a long time. 8. Fiscal “stimulus. ” 9. “Do something. ” It’s ok to be negative. 10. The major danger is political, not economic.
 Policy. Will the Treasury Plan work? Supply Price Treasury Hope: Small purchase raises price a lot Finance experience: Huge purchase to move prices a little Demand Mortgage-backed securities
 Credit Crunch – “undercapitalized” mechanics 1. Before Risk 2. After 10 Equity 100 Loan (Assets) = ! 95 90 Debt 3. No new loans! New loan 5 5 = 90 Debt 3. “Deleverage? ” 5 5 Sell. New debt 95 = Equity 50 90 5 45 = 45 50
 Solutions? 4. “Recapitalize” 10 New loan 5 55 45 4. “Failure” = recapitalization 1. New Equity 2. New debt =? 70 20 90 Fail, = 70 50 = 95 = 90 Wa. Mu JPMorgan
 What went wrong / needs to be fixed? 1. Amazing amount of overnight / short financing $100 Joe Yes Not $1. 10 $100 Joe $99 $1. 10 Sue $99 $98 Sue Bob $1 Joe
 Swaps, brokerage, etc. $100 2. Value = 80 3. Value = 80 $1 $1 1. Will this last? 2. Abandon Mark to Market? 3. Dynamic capital standards! $100 Joe $99 $1 Sue $99 $98 Sue Bob Who stops ?
 Financial system (intermediary) Supply (saving) The financial system") Deposits, CDs, Stock Mortgage Demand (investment) Financial system (intermediary) Supply (saving) The financial system can slice, dice and transfer risk, but cannot bear risk. People must bear risk. A credit crunch: banking system cannot make new loans. Interest rate Supply Banking System Demand Loans
Deposits, CDs, Stock Mortgage Demand (investment) Financial system (intermediary) Supply (saving) The financial system can slice, dice and transfer risk, but cannot bear risk. People must bear risk. A credit crunch: banking system cannot make new loans. Interest rate Supply Banking System Demand Loans