de9dd92e1dcd35516685f9222e5d0085.ppt
- Количество слайдов: 177
 FINAL EXAM REVIEW
 What are TAXES ? • Required payment to the govt (_____, ________) *look at your paycheck The main source of government revenue TAXES:
 SOCIAL CONTRACT THEORY -____? ______ As citizens, we authorize the govt to tax CONSTITUTION/ARTICLE 1 “TO LAY & COLLECT TAXES……. . PROVIDE FOR THE COMMON DEFENSE & GENERAL WELFARE Amendment 16 gives Congress the power to lay and collect taxes.


 *TWO PRINCIPLES of TAXATION “Who pays What” is based on two principles: • Benefit Principle - The more you benefit from something, the more you should pay. Example: Your education is paid for mostly by the rich. Taxes on gasoline • Ability to Pay - The more you make the more you should pay. • Rich people have an easier time paying taxes than those with less income.
 PAY AS YOU EARN • * Ex’s Medieval Kings • Colonial America

 What is the Pay As You Earn (PAYE) system ? • method of paying income tax and national insurance contributions.
 PAYE (Pay As You-Earn) • is an amount collected by employers on behalf of the govt from employees.
 Income Tax or Federal Income Tax FIT • Individual income taxes are paid over time through PAYE *** (just look at your paycheck). By April 15, you must file a tax return. Any difference in the amount paid compared to the amount owed is settled at this time.
 1 - Your employer deducts tax and insurance contributions (FICA)from your wages before paying your wages.
 2 - You receive your W-2 form from your employer. It is used to calculate your Federal Income Tax - FIT
 3 -FILE YOUR TAXES
 Reconcile w/ the IRS • Pay Taxes Due OR Wait For Check
 CORPORATE TAXES “ONLY PEOPLE PAY TAXES”
 FICA TAXES – 7. 65% • Federal Insurance Contributions Act Social Security(OASDI) (6. 2%) benefits for OA ______ » » S_____ D _____ • Medicare(1. 45%) medical benefits people over ______
 OASDI
OASDI
 Types of Taxes Proportional Tax Progressive Tax Regressive Tax
 Proportional Taxes • Constant % is taken in taxes. • Everyone pays the same rate. • Regardless of Income, the same tax rate is imposed upon everyone. FLAT TAX **If there is a 15% flat tax, how much do you pay in taxes if you earn $50, 000? $7500 * What if you earn $150, 000? $ 22, 500 * Note as a person’s income increases, the percentage of total income paid in taxes remains the same. • Property Tax a proportional tax. is
 Proportional Tax 40% 20% Tax Rate 10% 10, 000 50, 000 100, 000 Income
 Progressive Tax • People with higher incomes pay a higher % in taxes. • The rich pay a higher %. • Federal and State income tax are progressive taxes. INCOME $10, 000 Amount Paid in Taxes as a percentage of Income $1, 000 10% $50, 000 $ 10, 000 20% $100, 000 $ 30, 000 30%
 Progressive Tax 40% 20% Tax Rate 10% 10, 000 50, 000 100, 000 Income

 Regressive Taxes • The lower the income the higher % paid in taxes. – Sales tax is an example of a regressive tax. – The poor pay a higher %. * Assume two families paid $1000 in sales tax by the end of the year. Which family spent a higher percent of their income on taxes? Income Amount paid in taxes as a in taxes percentage of their income. $10, 000 $1000. 00 10% $50, 000 $1000. 00 5%
 Regressive Tax 40% 20% Tax Rate 10% 10, 000 50, 000 100, 000 Income
 Q: * From an economist’s point of view- • Is it better to owe money to the IRS or receive a refund check? WHY? * From an ____’s point of view-
 * State Taxes and Local Taxes • Sales Tax • Individual Income Tax • Property Tax • Public Utility or State owned liquor stores • Sales Tax - this varies from city to city!

 . Government Spending – The Budget- The Federal spending plan is prepared by the president and approved by Congress. * Deficit- When the government spends more than it takes in. In 1998, the deficit was $120 billion. • * Surplus- When the government takes in more than what it spends. • SEE OVERHEAD
 * As of TODAY the NATIONAL DEBT was – $ 11. 7 Trillion • How Big is a Trillion? • In the U. S. , one trillion is written as the number "1" followed by 12 zeros (1, 000, 0 00).


 Medicare & Medicade * Medicare- Health care for the elderly. Along with S. S. this makes up 35% of the budget. Medicade • , Food Stamps and other Social Programs • * Health care and food for the poor. Makes up 17% of the budget. •

 FAIR TAX? ? ? ? ? • In America the highest quintile of households pay 27% of Govt Taxes, • the lowest quintile of households pay 5% • BUT… the poorest 10% pay 30% -
 SIN TAX • Behavior adjustment - attempt to change a person’s behavior * pack tax on cigarettes from 39 cents to $1. 01. The money generated will be used to support health care for low income children.
 SWINE FLU
 SCARCITY THE BASIC ECONOMIC PROBLEM
 WANTS vs NEEDS • Make a list- “Things I need to live include _____” “Things I want to have include______”
 NEEDS • Everyone NEEDS certain basic things to survive. • FOOD • SHELTER • CLOTHING • & …

 WANTS • Anything other than what is needed for survival • HUMAN WANTS ARE UNLIMITED

 CONCLUSION • It is hard to distinguish between wants & needs , BUT…. in economics there are only a few true needs.

 SCARCITY • the condition that occurs because peoples wants and needs are unlimited but all resources are limited.
 scarcity • There is a limit to resources. Limited resources means that there is never enough resources to fulfill everyone's wants and needs
 Economic Systems Ch. 2
 WHAT IS A MARKET ? ? ?
 A nation must answer the 3 basic economic questions (What • A nations responses they? ) Q’s are to these determined by its ECONOMIC SYSTEM- the way people organize the production & distribution of goods/services
 4 TYPES OF ECONOMIC SYSTEMS • PURE TRADITIONAL • PURE COMMAND • PURE MARKET • MIXED
 What is an economic model ? • Pure _____ economic systems are all models (they do not exist in the world) • ALL ECONOMIES ARE ____? _____ • Q Why do we label economies? ? ?
 3 Economic Questions • What to produce? – What to produce and in What quantities? • How to produce? – Methods of production • For Whom to produce? – Allocation of the items produced

 Resource allocation • Resource allocation is crucial for a society and is handled in different ways in different societies • WHO GETS THE (FOP’s)FACTORS OF PRODUCTION IN EACH COUNTRY?
 Traditional Economy • All three economic questions are answered through habit, custom, rituals, religion and tradition. • Roles are defined by the customs of the elders and ancestors.
 Traditional Economy continued • Children often carry on the economic roles played by their parents. • - centered around families & social units such as a tribe. • SHARING
 Traditional Economy continued • Examples – Early Native Americans – Amish – Inuit – Indigenous peoples of Africa, South America – Mbuti

 Command Economy • Relies on govt officials or “central planners” to make all economic decisions • All of the economic questions are answered through a central planning committee • Most of the factors of production are owned by the government
 Command Economy continued • Weaknesses – Lack of motivation for individuals to pursue new ideas or innovations – Does not provide for development – Tends to lead to inefficient use of resources
 Command Economy continued • Examples (very common in the past) Monarchs/Kings owned the land & controlled all trade – Communism – Former Soviet Union – China in the past – Cuba
 Market Economy • Individuals or consumers answer 3 Q’s • What to produce is answered through the interaction of producers and consumers– supply and demand (PRICE SYSTEM) • Producers will produce goods through the most efficient methods since they are self interested -?
 Market Economy Continued ADAM SMITH: • Govt has NO SAY in economic matters • People can buy, sell or produce anything they want to fulfill their needs or wants • Individuals would work for their own self-interest • Guided by “invisible hand” of competition • Laissez-faire

 Market Economy Continued • Examples – All examples of Market Economies are actually mixed economies – The United States – Japan – Canada – Great Britain
 INCENTIVES • Individuals(consumers) respond to incentivessomething that makes you behave in a certain way --- POS or NEG
 MIXED ECONOMY • Combines elements of traditional, command, & market economies. • All nations have mixed economies • Each nation (country ) can be plotted graphically between pure market & pure command models
 Market orientation China Cuba Hungary Command economy USA Sweden UK Hong Kong Free market economy
 SCARCITY VS. SHORTAGES
 Scarcity always exists because ______?
 TINSTAAFL • russian proverb: • the only place you find free cheese is in a mousetrap.
 THE BASIC ECONOMIC PROBLEM LIMITED RESOURCES & UNLIMITED WANTS & NEEDS CREATES SCARCITY
 ALLOCATION • Scarcity forces people to make decisions about how to use resources effectively. • People decide how to allocate, or distribute resources in order to satisfy as many wants & needs as possible. • Def. The process of choosing which needs will be satisfied & how much of our resources we will use to satisfy them.
 • Do wealthy people have a scarcity problem in their lives? • You cannot be in 2 places at the same time. • TIME • You cannot use the same money to buy 2 items.


 OPPORTUNITY COST & TRADE-OFFS

 • When you make a purchase decision, you weigh the price you must pay against the satisfaction you will get from the purchase. • There is more to cost than just $, there is opportunity cost.
 • The opportunity cost of a decision is the cost of the next best alternative use of money, time , or resources that is given up when one choice is made rather than another.
 Opportunity Cost • Every time we make a choice: -we have a list of alternatives from which to choose -we choose the one that will give us the greatest benefit & the least cost. COST-BENEFIT ANALYSIS
 OPPORTUNITY COSTS (definitions) • -cost of what a person gives up in order to get something else • -next best alternative(not taken) • -second best choice • -value of the opportunity lost • Highest-valued alternative you give up
 Opportunity Cost Every decision has an opportunity cost.
 What opportunity cost am I experiencing now? The most money that you could be making if you were somewhere else instead of studying these slides


 Opportunity costs are not always money • TIME • ENERGY
 Can opportunity cost be something other than money? That most desired activity that you are presently giving up is considered an opportunity cost
 TRADE-OFFS Trade offs involve choosing less of one thing so that we can have more of another.
 Trade-Offs • Exchanging one thing for the use of another is called a TRADE-OFF
 PEOPLE FACE TRADE-OFFS & OPPORTUNITY COSTS EVERY DAY
 MODELS • Oversimplification of reality • EX’s • Economists use a popular model called a ___________….
 PRODUCTION POSSIBILITIES CURVE-- (PPF) ? ? • Scarcity, Trade-offs & Opportunity Costs can be graphically represented by a PPC • Shows all of the possible combinations of 2 goods or services that can be produced within a stated time • MORE OF 1 THING MEANS LESS THAN ANOTHER (trade-off)
 What is a production possibilities curve? A curve that shows the maximum combinations of two outputs that an economy can produce, given its available resources and technology

 GUNS & BUTTER

 The Specific Factors Model The Production Possibility Frontier Output, Q Slope of the PPF: -MPLF/MPLM Output, Q

 PPC’s • Show the different combinations of goods and services that can be produced with a given amount of resources • No ‘ideal’ point on the curve • Any point inside the curve – suggests resources are not being utilised efficiently • Any point outside the curve – not attainable with the current level of resources • Useful to demonstrate economic growth and opportunity cost
 Military Goods Production Possibilities Curve A Efficient Unattainable Inefficient B Consumer Goods
 What is the conclusion of the production possibilities curve? Scarcity limits an economy to points on or below its production possibilities curve
 What is economic growth? The ability of an economy to produce greater levels of output, an outward shift of its production possibilities curve

 What makes possible economic growth? Research and development of new technologies Increase production in excess of worn out capital
 Computers Technological Advance A Pizzas

 The Free Enterprise System
 Because our economy is large & complex we use a model to explain the FREE ENTERPRISE SYSTEM

 C F of E A • Refers to the continuous movement of income & resources between consumers & producers

 HOUSEHOLDS • Individuals • Everyone is a member of a household • Def- group of people whose spending & earning are connected • In America, HOUSEHOLDS own the resources. • LAND LABOR CAPITAL ENTREPRENEURSHIP • As RESOURSE SUPPLIERS, individuals earn money income (wages/salaries, interest, rent & dividends)
 BUSINESSES • FIRMS… … purchase Factors of Production from HOUSEHOLDS … offer PRODUCTS (goods/services) to HOUSEHOLDS for sale • Economic activity is the production of services & goods (capital & consumer) & in order to produce those products firms need resources(inputs) or _________. • In exchange for scarce resources(FOP’s), firms make payments(______, ______ & _______) to the households.
 MARKET-(not a place) buyers & sellers voluntarily exchange • PRODUCT MARKET & RESOURCE MARKET
 PRODUCT MARKET represents all the exchanges of goods & services (consumer goods) • BUSINESSES make goods/services to sell to HOUSEHOLDS • HOUSEHOLDS pay the BUSINESSES for the products


 RESOURSE MARKET represents all the exchanges of resources ( factors of production) • HOUSEHOLDS are people like you that own the factors of production • BUSINESSES are the users of resources

 The money paid to households is called income. • We receive income for: RENTS- for natural resources WAGES- for labor INTEREST- for capital($)
 Capitalism (4 major characteristics) * Need to have for Free Enterprise system to work well. 1) Economic Freedom 2) Voluntary Exchange 3) Private Property Rights 4) Profit Motive
 DEMAND REVIEW
 Understanding Demand • What is the law of demand? • How do the substitution effect and income effect influence decisions? • What is a demand schedule? • What is a demand curve?
 What Is the Law of Demand? The law of demand states that consumers buy more of a good when its price decreases and less when its price increases. • The law of demand is the result of two separate behavior patterns that overlap, the substitution effect and the income effect. • These two effects describe different ways that a consumer can change his or her spending patterns for other goods.
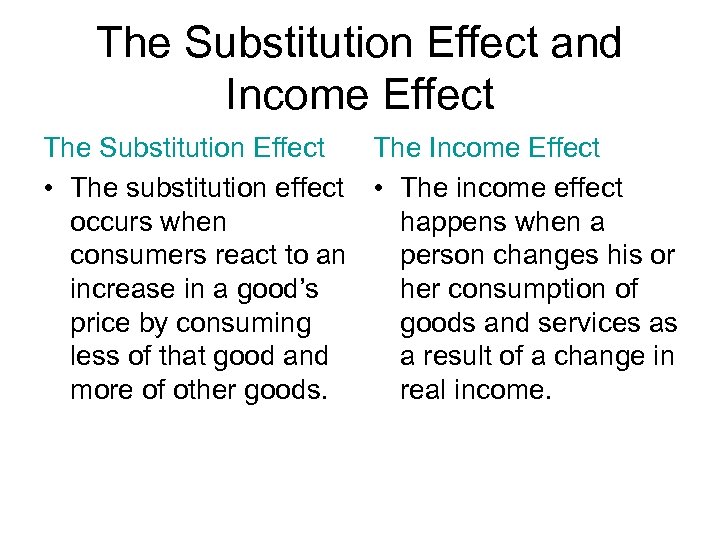 The Substitution Effect and Income Effect The Substitution Effect The Income Effect • The substitution effect • The income effect occurs when happens when a consumers react to an person changes his or increase in a good’s her consumption of price by consuming goods and services as less of that good and a result of a change in more of other goods. real income.

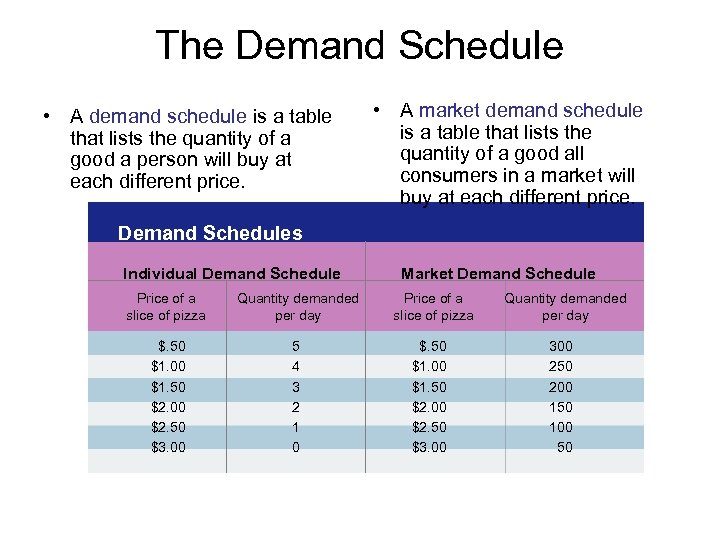 The Demand Schedule • A demand schedule is a table that lists the quantity of a good a person will buy at each different price. • A market demand schedule is a table that lists the quantity of a good all consumers in a market will buy at each different price. Demand Schedules Individual Demand Schedule Price of a slice of pizza Quantity demanded per day $. 50 $1. 00 $1. 50 $2. 00 $2. 50 $3. 00 5 4 3 2 1 0 Market Demand Schedule Price of a slice of pizza $. 50 $1. 00 $1. 50 $2. 00 $2. 50 $3. 00 Quantity demanded per day 300 250 200 150 100 50
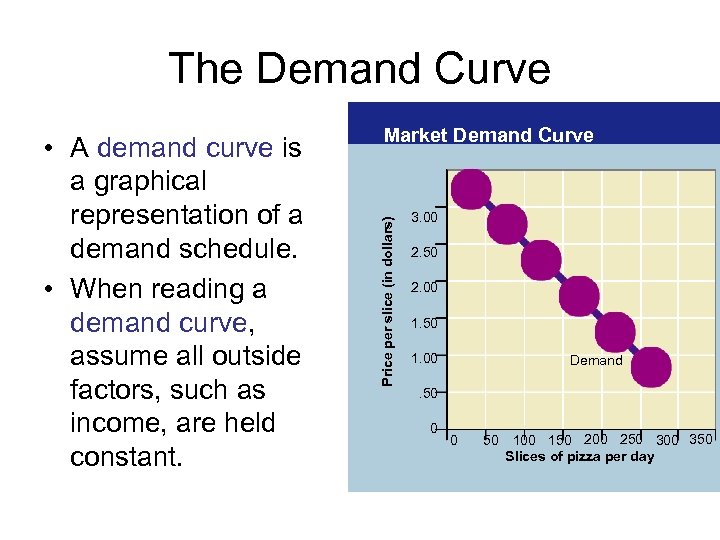 The Demand Curve Price per slice (in dollars) • A demand curve is a graphical representation of a demand schedule. • When reading a demand curve, assume all outside factors, such as income, are held constant. Market Demand Curve 3. 00 2. 50 2. 00 1. 50 1. 00 Demand . 50 0 0 50 100 150 200 250 300 350 Slices of pizza per day
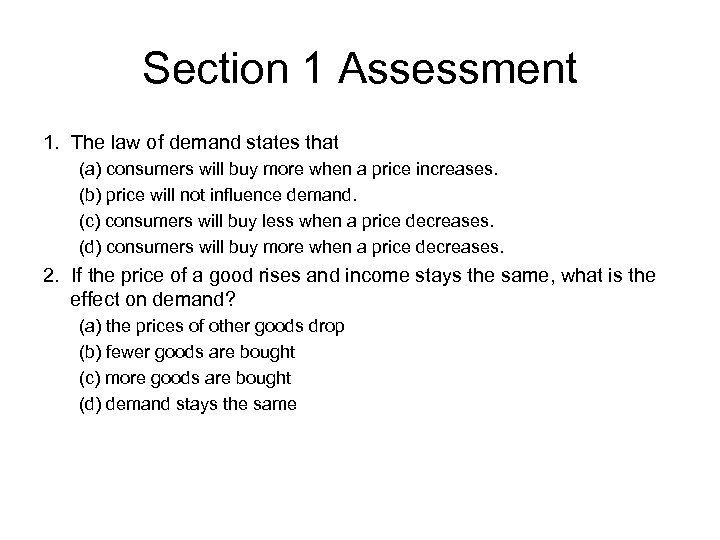 Section 1 Assessment 1. The law of demand states that (a) consumers will buy more when a price increases. (b) price will not influence demand. (c) consumers will buy less when a price decreases. (d) consumers will buy more when a price decreases. 2. If the price of a good rises and income stays the same, what is the effect on demand? (a) the prices of other goods drop (b) fewer goods are bought (c) more goods are bought (d) demand stays the same
 Section 1 - Q’s 1. The law of demand states that (a) consumers will buy more when a price increases. (b) price will not influence demand. (c) consumers will buy less when a price decreases. (d) consumers will buy more when a price decreases. 2. If the price of a good rises and income stays the same, what is the effect on demand? (a) the prices of other goods drop (b) fewer goods are bought (c) more goods are bought (d) demand stays the same
 Shifts of the Demand Curve • What is the difference between a change in quantity demanded and a shift in the demand curve? • What factors can cause shifts in the demand curve? • How does the change in the price of one good affect the demand for a related good?
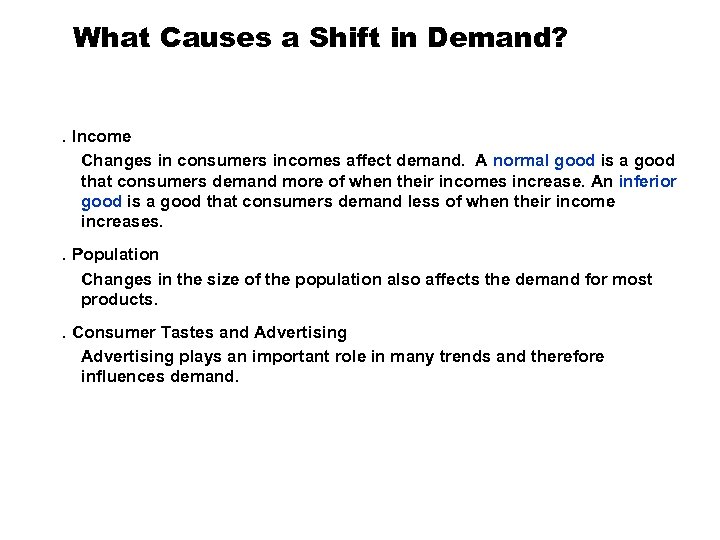 What Causes a Shift in Demand? . Income Changes in consumers incomes affect demand. A normal good is a good that consumers demand more of when their incomes increase. An inferior good is a good that consumers demand less of when their income increases. . Population Changes in the size of the population also affects the demand for most products. . Consumer Tastes and Advertising plays an important role in many trends and therefore influences demand.
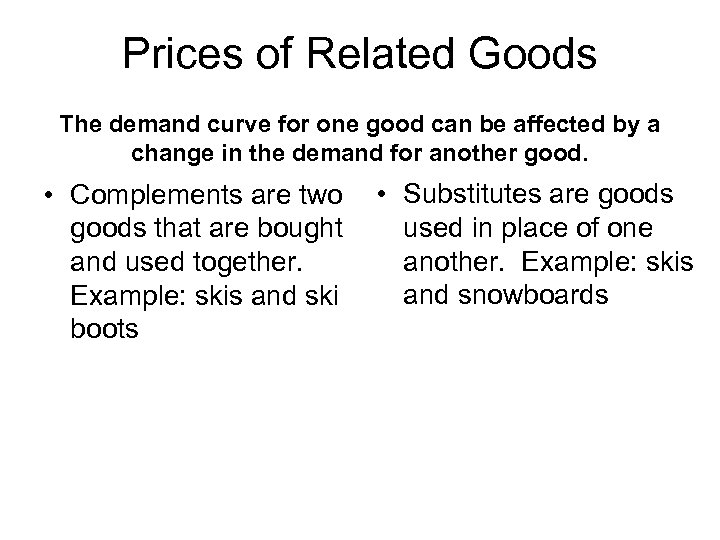 Prices of Related Goods The demand curve for one good can be affected by a change in the demand for another good. • Complements are two goods that are bought and used together. Example: skis and ski boots • Substitutes are goods used in place of one another. Example: skis and snowboards
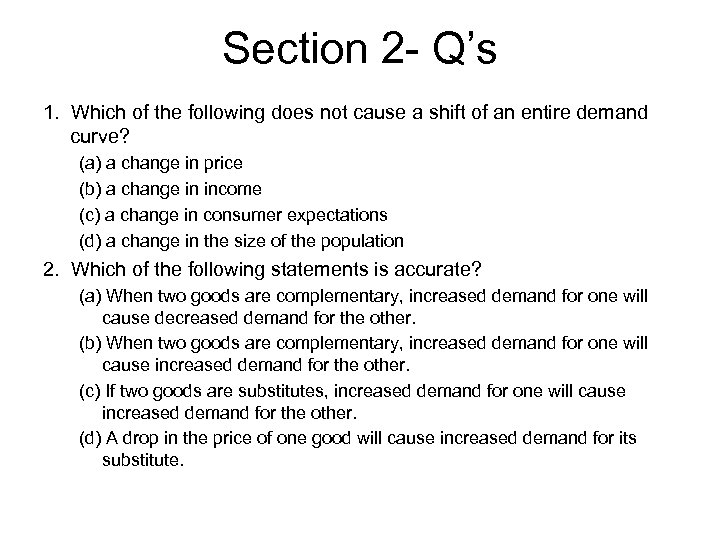 Section 2 - Q’s 1. Which of the following does not cause a shift of an entire demand curve? (a) a change in price (b) a change in income (c) a change in consumer expectations (d) a change in the size of the population 2. Which of the following statements is accurate? (a) When two goods are complementary, increased demand for one will cause decreased demand for the other. (b) When two goods are complementary, increased demand for one will cause increased demand for the other. (c) If two goods are substitutes, increased demand for one will cause increased demand for the other. (d) A drop in the price of one good will cause increased demand for its substitute.
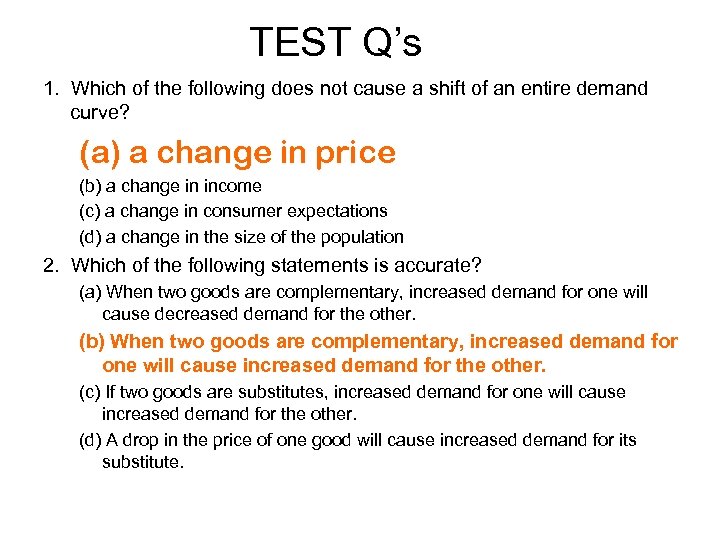 TEST Q’s 1. Which of the following does not cause a shift of an entire demand curve? (a) a change in price (b) a change in income (c) a change in consumer expectations (d) a change in the size of the population 2. Which of the following statements is accurate? (a) When two goods are complementary, increased demand for one will cause decreased demand for the other. (b) When two goods are complementary, increased demand for one will cause increased demand for the other. (c) If two goods are substitutes, increased demand for one will cause increased demand for the other. (d) A drop in the price of one good will cause increased demand for its substitute.
 DEMAND (a review) • Movements along the demand curve • Shifts in the demand curve

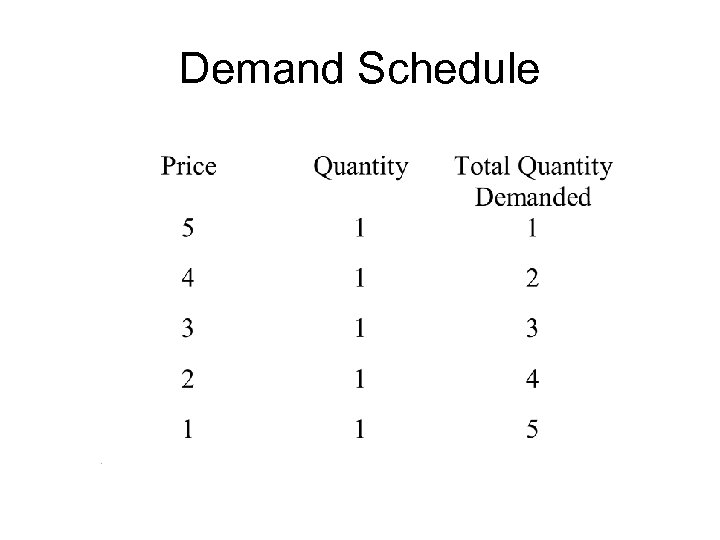 Demand Schedule
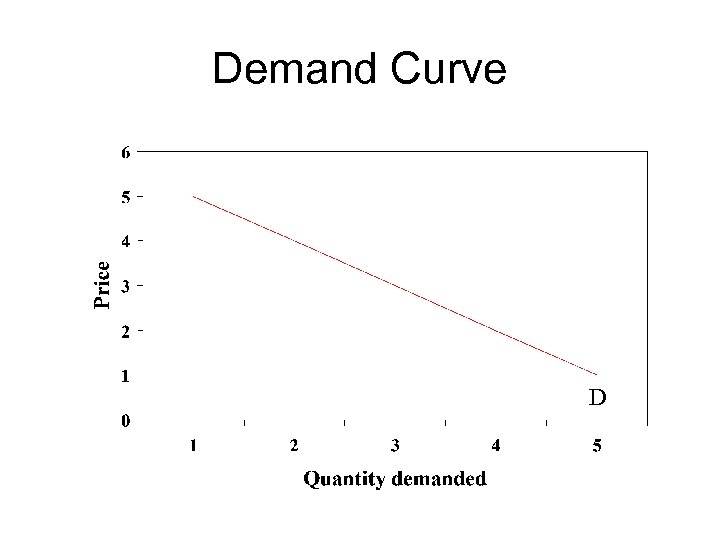 Demand Curve D
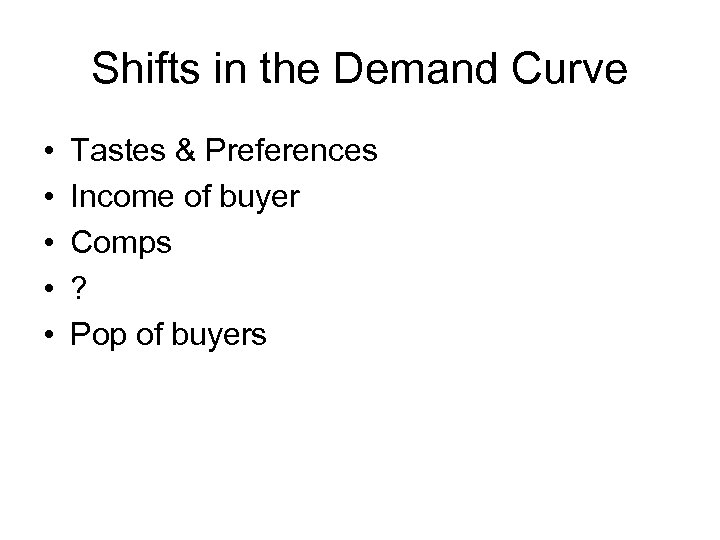 Shifts in the Demand Curve • • • Tastes & Preferences Income of buyer Comps ? Pop of buyers
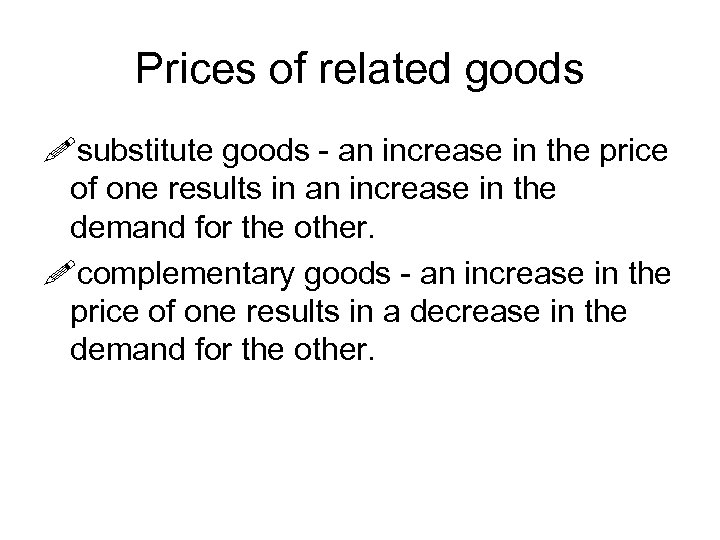 Prices of related goods !substitute goods - an increase in the price of one results in an increase in the demand for the other. !complementary goods - an increase in the price of one results in a decrease in the demand for the other.
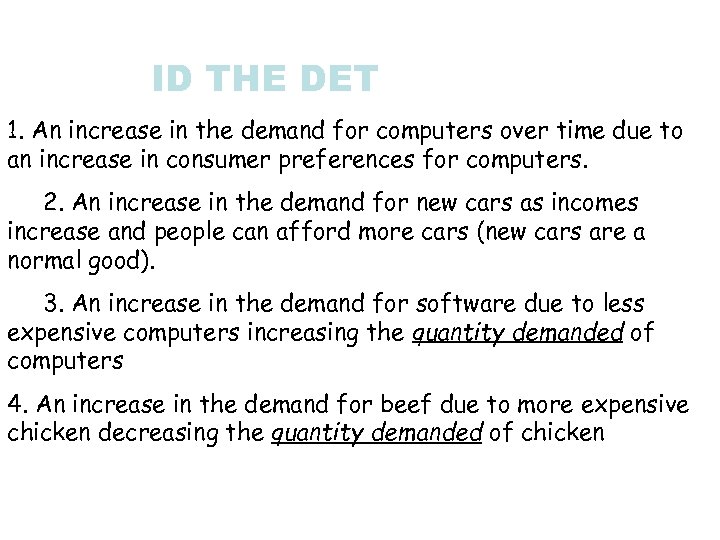 ID THE DET 1. An increase in the demand for computers over time due to an increase in consumer preferences for computers. 2. An increase in the demand for new cars as incomes increase and people can afford more cars (new cars are a normal good). 3. An increase in the demand for software due to less expensive computers increasing the quantity demanded of computers 4. An increase in the demand for beef due to more expensive chicken decreasing the quantity demanded of chicken
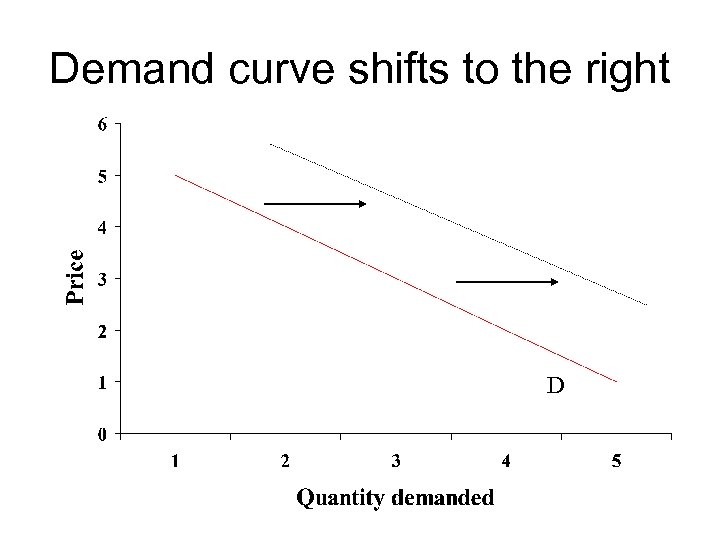 Demand curve shifts to the right D
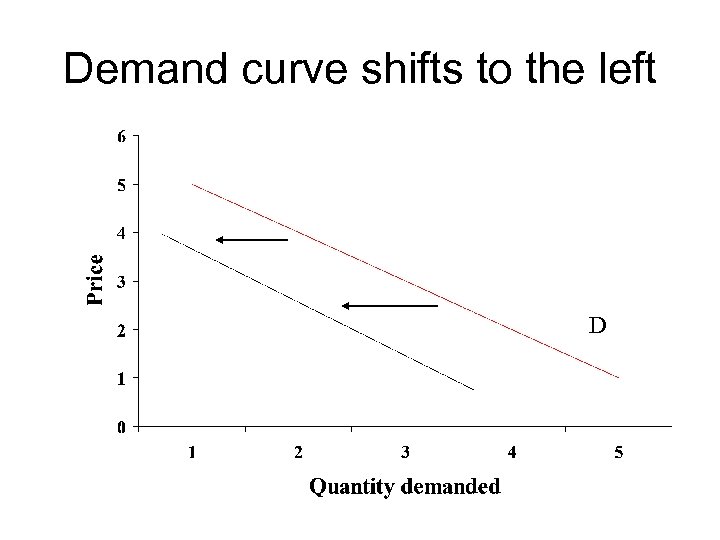 Demand curve shifts to the left D
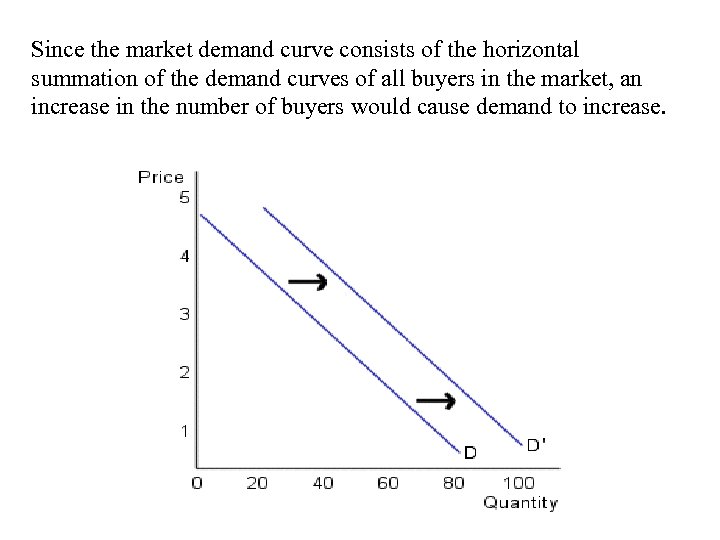 Since the market demand curve consists of the horizontal summation of the demand curves of all buyers in the market, an increase in the number of buyers would cause demand to increase.

 SUPPLY
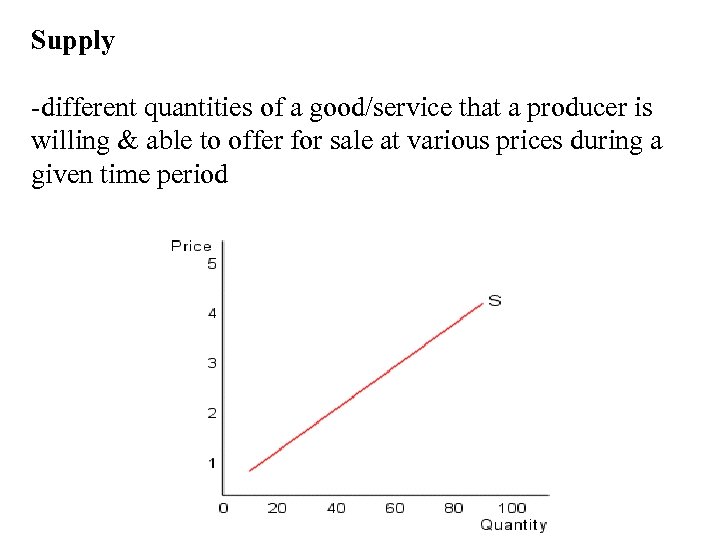 Supply -different quantities of a good/service that a producer is willing & able to offer for sale at various prices during a given time period
 LAW OF SUPPLY • -as price increases, the quantity that producers are willing to supply increases
 CHANGE IN QS • CAN ONLY BE CAUSED BY A CHANGE IN ________
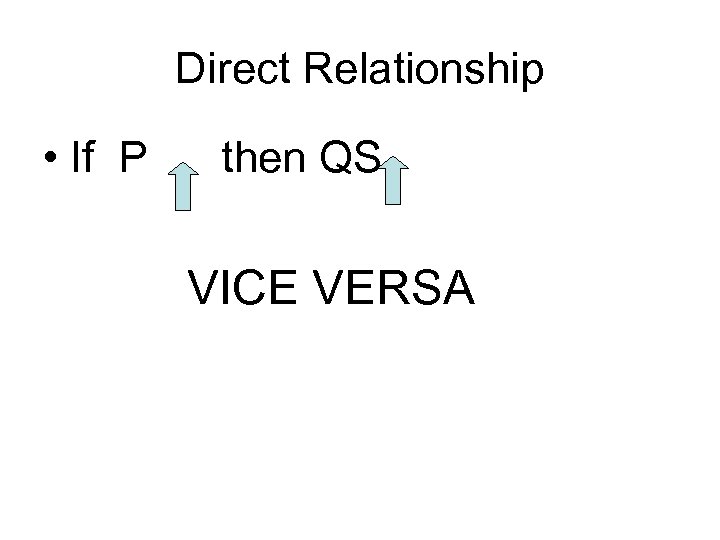 Direct Relationship • If P then QS VICE VERSA
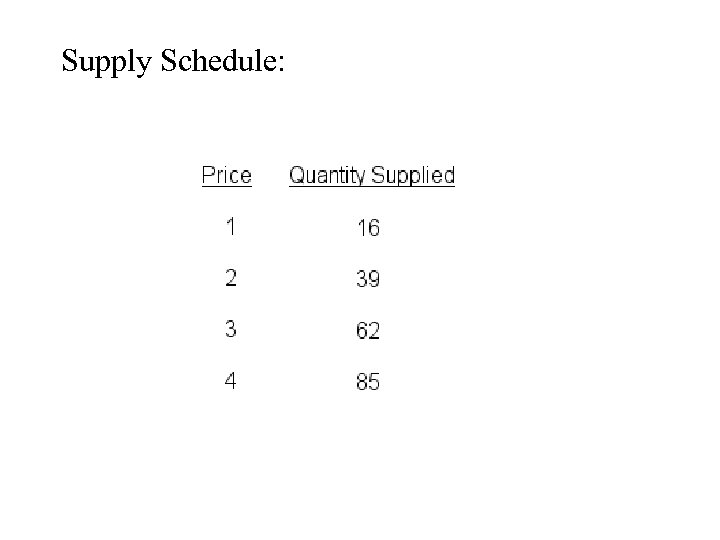 Supply Schedule:

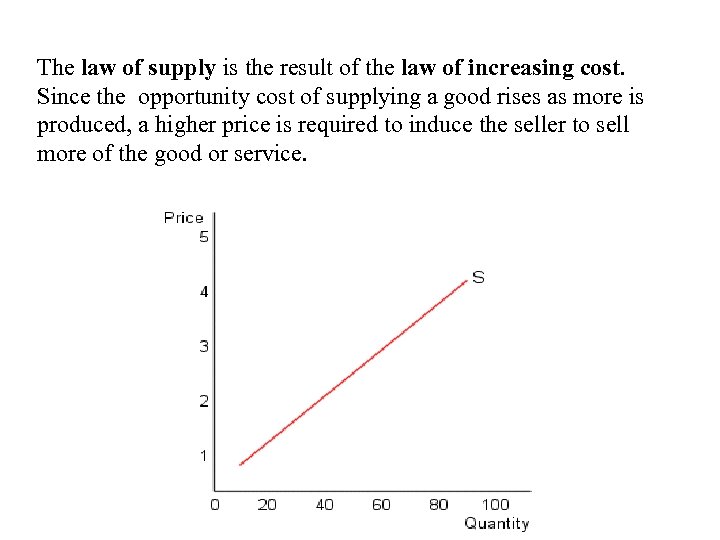 The law of supply is the result of the law of increasing cost. Since the opportunity cost of supplying a good rises as more is produced, a higher price is required to induce the seller to sell more of the good or service.
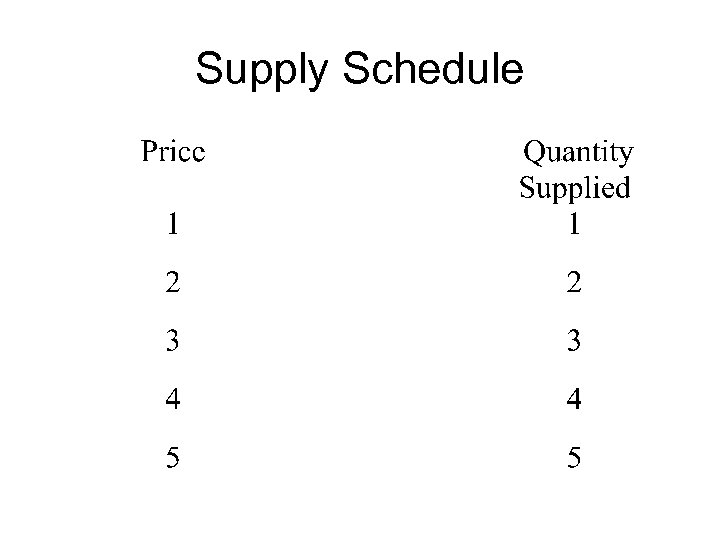 Supply Schedule
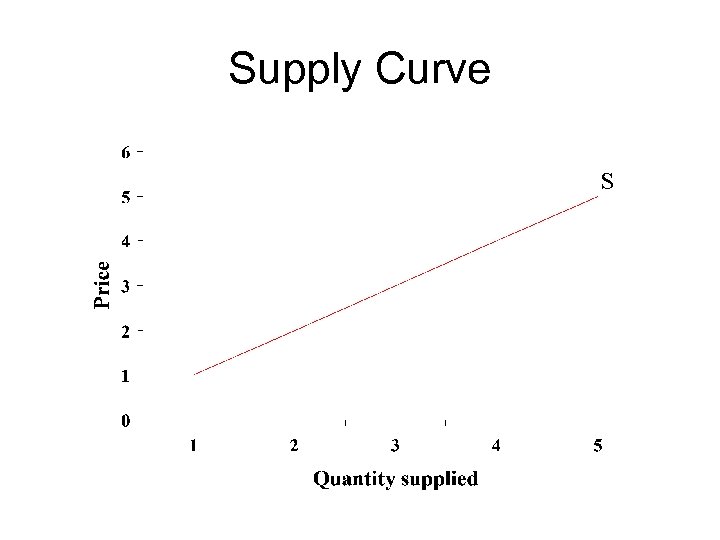 Supply Curve S
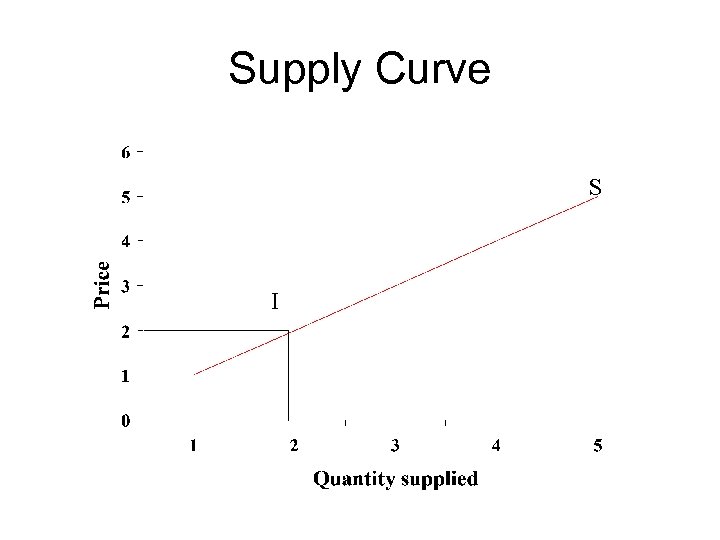 Supply Curve S I
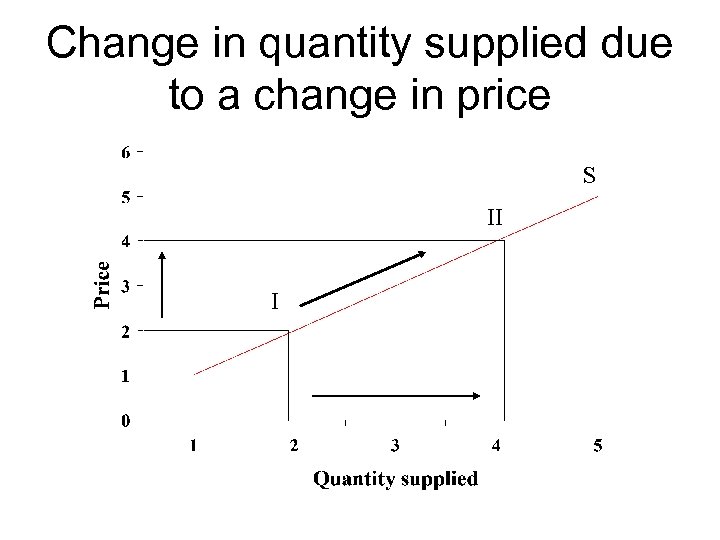 Change in quantity supplied due to a change in price S II I

 Shifts in the Supply Curve • WHAT CAUSES THE SUPPLY CURVE TO SHIFT ? ? ?
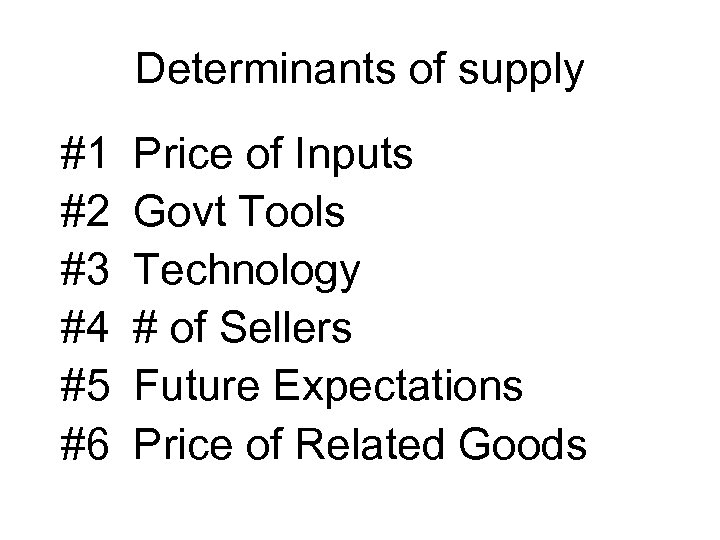 Determinants of supply #1 #2 #3 #4 #5 #6 Price of Inputs Govt Tools Technology # of Sellers Future Expectations Price of Related Goods
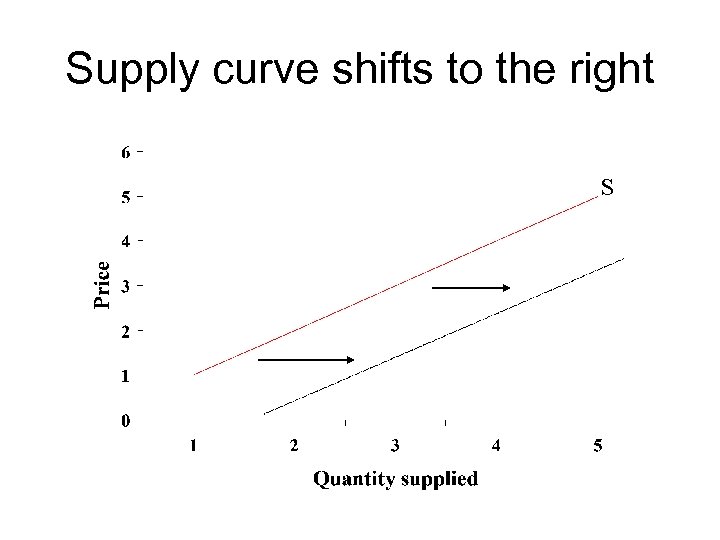 Supply curve shifts to the right S
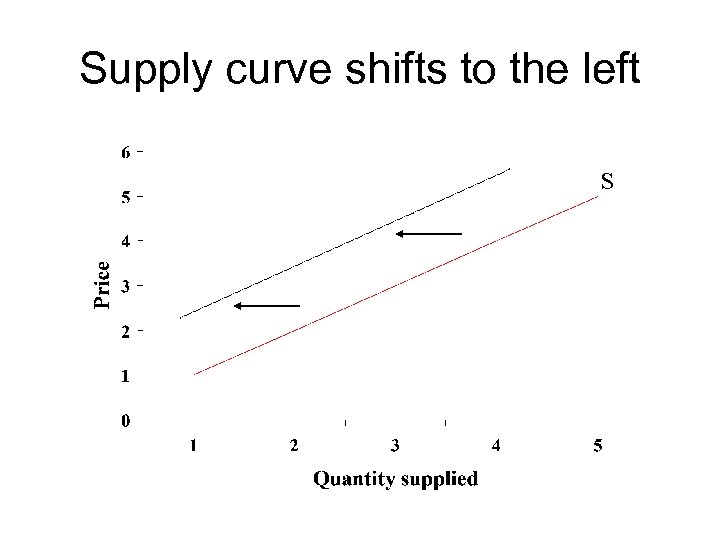 Supply curve shifts to the left S
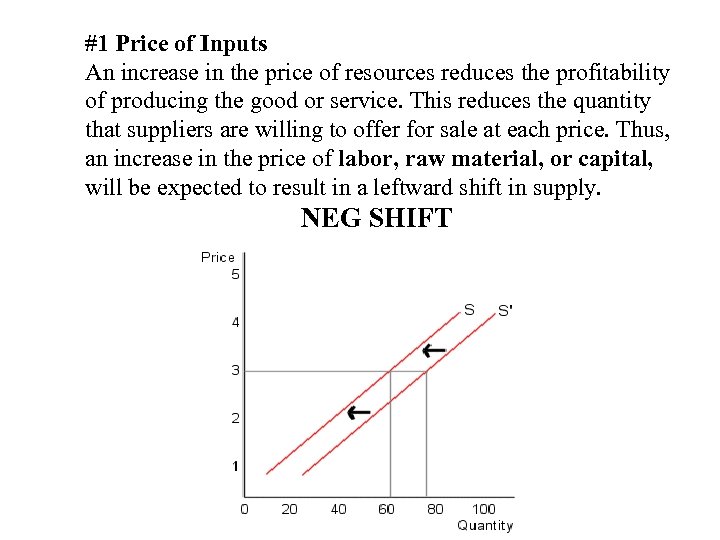 #1 Price of Inputs An increase in the price of resources reduces the profitability of producing the good or service. This reduces the quantity that suppliers are willing to offer for sale at each price. Thus, an increase in the price of labor, raw material, or capital, will be expected to result in a leftward shift in supply. NEG SHIFT
 #2 GOVT TOOLS • - TAXES: businesses pay taxes, this increases production NEG SHIFT • - SUBSIDIES: govt pays businesses POS SHIFT • -REGULATIONS: govt rules placed on business NEG SHIFT
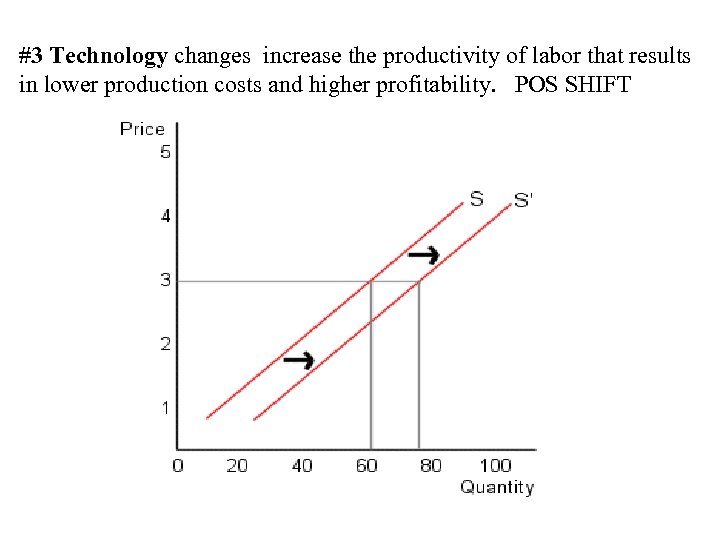 #3 Technology changes increase the productivity of labor that results in lower production costs and higher profitability. POS SHIFT
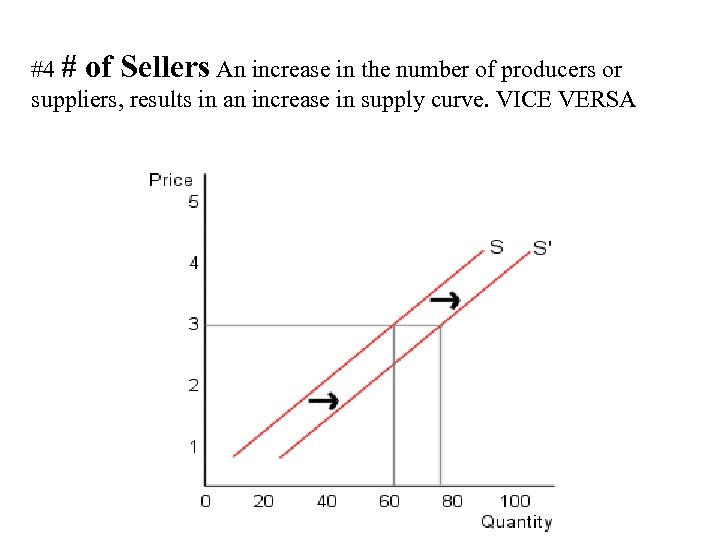 #4 # of Sellers An increase in the number of producers or suppliers, results in an increase in supply curve. VICE VERSA
 # 5 Future Expectations • an increase in the expected future price results in a reduction in current supply • If producers expect that future prices will be lower then they may supply more now.
 The biggest challenge for students is recognizing the difference between a change in Quantity Supplied and a change in Supply • QS vs S
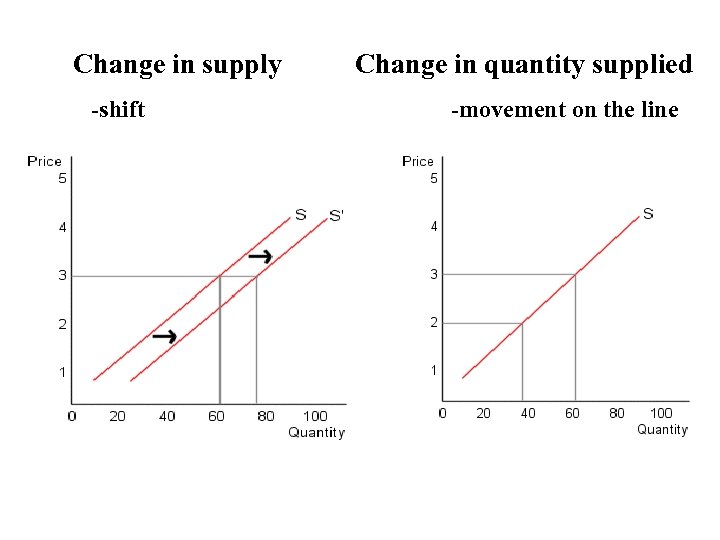 Change in supply -shift Change in quantity supplied -movement on the line
 TEST Q 1. What is the difference between a shortage and scarcity? (a) A shortage can be temporary or long-term, but scarcity always exists. (b) A shortage results from rising prices; a scarcity results from falling prices. (c) A shortage is a lack of all goods and services; a scarcity concerns a single item. (d) There is no real difference between a shortage and a scarcity.
 THE BASIC ECONOMIC PROBLEM LIMITED RESOURCES & UNLIMITED WANTS & NEEDS CREATES SCARCITY
 ALLOCATION *Scarcity forces people to make decisions about how to use resources effectively. • People decide how to allocate, or distribute resources in order to satisfy as many wants & needs as possible. • Def. The process of choosing which needs will be satisfied & how much of our resources we will use to satisfy them.
 ANOTHER MR D PRODUCTION


