

Chapter 12.ppt
- Количество слайдов: 60

 Figure 12. 1 Relationship of Sampling Design to the Previous Chapters and the Marketing Research Process Focus of This Chapter • Sampling Design Process • Nonprobability Sampling Techniques • Probability Sampling Techniques Relationship to Previous Chapters • Research Design Components (Chapter 3) Relationship to Marketing Process Problem Definition Approach to Problem Research Design Field Work Data Preparation and Analysis Report Preparation and Presentation
 Figure 12. 2 Sampling Design Procedures: An Overview Be an MR! Be a DM! Sample of Census Figs 12. 3 -12. 5 Sampling Design Process Table 12. 1 Sample of Census Table 12. 2 A Classification of Sampling Techniques Fig 12. 6 Nonprobability Sampling Techniques Table 12. 3 Probability Sampling Techniques Figs 12. 712. 8 Choosing Nonprobability vs. Probability Sampling Figs 12. 812. 11 Internet Sampling Figs 12. 12 Table 12. 4 Application to Contemporary Issues International Technology Ethics What Would You Do? Experiential Learning Opening Vignette
 Define the Target Population The target population is the collection of elements or objects that possess the information sought by the researcher and about which inferences are to be made. The target population should be defined in terms of elements, sampling units, extent, and time. – An element is the object (or person) about which or from which the information is desired, e. g. , the respondent. – A sampling unit is an element, or a unit containing the element, that is available for selection at some stage of the sampling process (e. g. household). – Extent refers to the geographical boundaries. – Time is the time period under consideration.
 • Population is the total of all elements that share some common set of characteristics • Census involves a complete count of each element in a population or study objects • Sample is a subgroup of the population selected for participation in the study
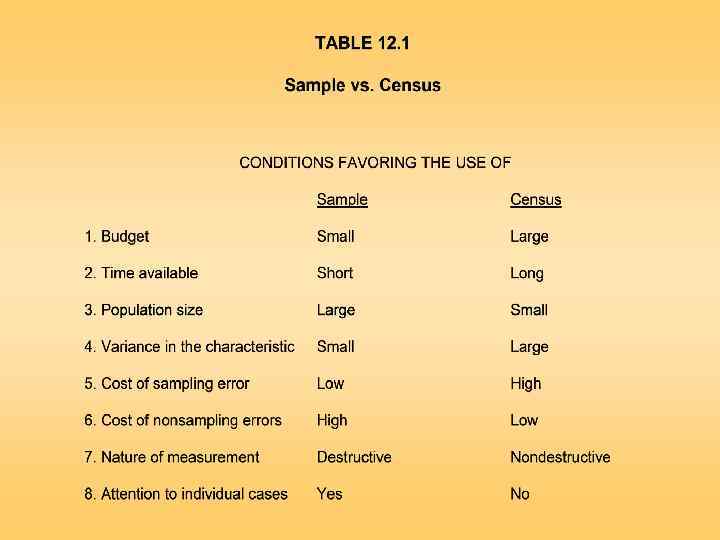
 Figure 12. 3 Sampling Design Process Define the Population Determine the Sampling Frame Select Sampling Technique(s) Determine the Sample Size Execute the Sampling Process
 Figure 12. 4 Defining the Target Population Time Frame: Upcoming Summer Sampling Unit: Households with 18 year old females Extent: Domestic United States Element: 18 year old females
 • Sampling frame is a representation of the elements of the target population (phone book, directory listing the firms in an industry, city directory, a map etc. )
 Figure 12. 5 Sampling Frame Error Target Population: Single parent households in Chicago Sampling Frame Error Sampling Frame: List supplied by a commercial vendor
 Define the Target Population Important qualitative factors in determining the sample size: – – – – the importance of the decision the nature of the research the number of variables the nature of the analysis sample sizes used in similar studies completion rates resource constraints
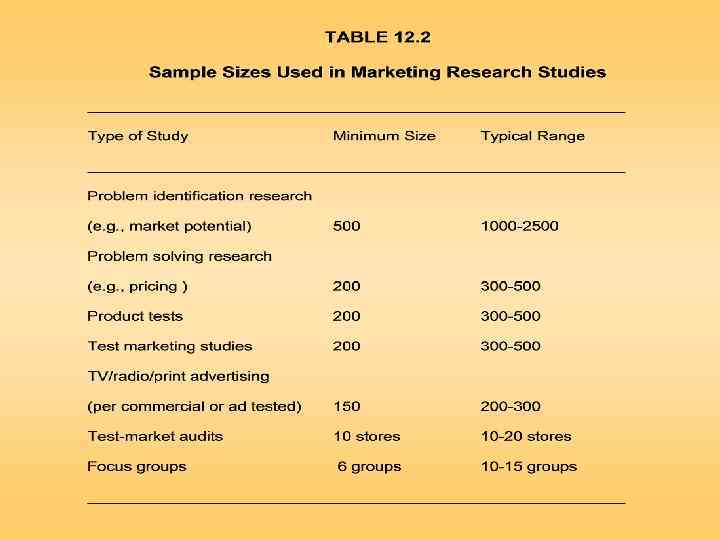
 Figure 12. 6 Classification of Sampling Techniques Nonprobability Sampling Techniques Probability Sampling Techniques
 • Nonprobability sampling is sampling technique that does not use chance selection procedures but instead, relies on the personal judgment of the researcher • Probability sampling is a sampling procedure in which each element of the population has a fixed probabilistic chance of being selected for the sample
 Probability sample vs. nonprobability sample • It is a rare that sample is of interest for its own sake; we nearly always intend some sort of generalisation beyond a particular sample • But a nonprobability sample is nearly certain to be biased and to generate larger sampling error than probability sample
 Figure 12. 7 Nonprobability Sampling Techniques Convenience Sampling Judgmental Sampling Quota Sampling Snowball Sampling
 Convenience Sampling Convenience sampling attempts to obtain a sample of convenient elements. Often, respondents are selected because they happen to be in the right place at the right time. – use of students and members of social organizations – mall intercept interviews without qualifying the respondents – department stores using charge account lists – “people on the street” interviews
 • Reliance on available subjects – Not good and is only justified if the researcher wants to study the characteristics of people passing the sampling point at specified times or if less risky sampling methods are not feasible.
 Figure 12. 8 A Graphical Illustration of Non-Probability Sampling Techniques Convenience Sampling A B C D E 1 6 11 16 21 2 7 12 17 22 3 8 13 18 23 4 9 14 19 24 5 10 15 20 25 Group D happens to assemble at a convenient time and place. So all the elements in this Group are selected. The resulting sample consists of elements 16, 17, 18, 19 and 20. Note, no elements are selected from group A, B, C and E.
 Judgmental Sampling Judgmental sampling is a form of convenience sampling in which the population elements are selected based on the judgment of the researcher. – test markets – purchase engineers selected in industrial marketing research – bellwether precincts selected in voting behavior research – expert witnesses used in court
 • Purposive or judgmental sampling – Is justified for studies in which it is impossible to list all elements of the population – In studying all or a sample of the most visible leaders, you may collect data sufficient for your purposes – Backpacker study – Generalising the findings beyond the sample relies on informal judgment
 Figure 12. 8 A Graphical Illustration of Non-Probability Sampling Techniques Judgmental Sampling A B C D E 1 6 11 16 21 2 7 12 17 22 3 8 13 18 23 4 9 14 19 24 5 10 15 20 25 The researcher considers groups B, C and E to be typical and convenient. Within each of these groups one or two elements are selected based on typicality and convenience. The resulting sample consists of elements 8, 10, 11, 13, 22 and 24. Note, no elements are selected from groups A and D.
 Quota Sampling Quota sampling may be viewed as two-stage restricted judgmental sampling. – The first stage consists of developing control categories, or quotas, of population elements. – In the second stage, sample elements are selected based on convenience or judgment. Control Characteristic Sex Male Female Population composition Sample composition Percentage Number 48 52 ____ 100 480 520 ____ 1000
 Quota sampling • KIMEP students are traveling more often than other students from Almaty – Proportional • • KIMEP students Other students Data collection – How, when, where, etc. Depending on your research purposes, you may need to know what proportion of the population is male and what proportion is female as well as what proportions of each gender fall into various age categories, educational levels, ethnic groups, etc.
 • In order to do this") Quota • Create a matrix of characteristics (%) • In order to do this you need valid and reliable information about the population • Example: – Almaty residents • • Gender Age groups Occupations Educational levels
Quota • Create a matrix of characteristics (%) • In order to do this you need valid and reliable information about the population • Example: – Almaty residents • • Gender Age groups Occupations Educational levels
 Figure 12. 8 A Graphical Illustration of Non-Probability Sampling Techniques Quota Sampling A B C D E 1 6 11 16 21 2 7 12 17 22 3 8 13 18 23 4 9 14 19 24 5 10 15 20 25 A quota of one element from each group, A to E, is imposed. Within each group, one element is selected based on judgment or convenience. The resulting sample consists of elements 3, 6, 13, 20 and 22. Note, one element is selected from each column or group.
 Snowball Sampling In snowball sampling, an initial group of respondents is selected, usually at random. – After being interviewed, these respondents are asked to identify others who belong to the target population of interest. – Subsequent respondents are selected based on the referrals.
 • Snowball – – – Appropriate when the members of a special population are difficult to locate, such as homeless individuals, migrant workers, or undocumented immigrants. The researcher collects data on the few members of the target population he or she can locate, then asks those individuals to provide the information needed to locate other members of that population whom they happen to know. “Saturation”
 Figure 12. 8 A Graphical Illustration of Non-Probability Sampling Techniques Snowball Sampling Random Selection Referrals A B C D E 1 6 11 16 21 2 7 12 17 22 3 8 13 18 23 4 9 14 19 24 5 10 15 20 25 Elements 2 and 9 are selected randomly from groups A and B. Element 2 refers elements 12 and 13. Element 9 refers element 18. The resulting sample consists of elements 2, 9, 12, 13, and 18. Note, no element from group E.
 Figure 12. 9 Probability Sampling Techniques Simple Random Sampling Systematic Sampling Stratified Sampling Cluster Sampling
 – any sample that isn’t probability sample.") Non-Probability Sampling • Convenience sample (haphazard sample) – any sample that isn’t probability sample. • The choice frequently is between a convenience sample and no sample (no research)
Non-Probability Sampling • Convenience sample (haphazard sample) – any sample that isn’t probability sample. • The choice frequently is between a convenience sample and no sample (no research)
 Probability Sampling • Generalizing sample to population • Large-scale surveys • Idea: A sample of individuals from a population must contain essentially the same variations that exist in the population • Sampling bias: those selected not representative
 • Probability sampling is the key to generalizing from a sample to a larger population – – – Probability sampling is the primary method of selecting large, representative samples for social research, including national polls. All large-scale surveys use probability sampling methods The fundamental idea behind probability sampling is this: To provide useful descriptions of the total population, a sample of individuals from a population must contain essentially the same variations that exist in the population
 • Probability sample is one for which the probability of selection is known and greater than zero for each element in the population – In the class of 30 students – the chance (probability) of being selected is 1 in 30 – a known probability • This type of probability sample is called a simple random sample (SRS) – each student has the same known chance of selection
 Simple Random Sampling • Each element in the population has a known and equal probability of selection. • Each possible sample of a given size (n) has a known and equal probability of being the sample actually selected. • This implies that every element is selected independently of every other element.
 – Sampling frame chosen") Types of Probability Sampling Design • Simple Random Sampling (SRS) – Sampling frame chosen then each element assigned a single number • Sampling frame – is a list of all elements in the population. Every element must be listed and listed only once. A Sample is selected from this list. – Random numbers table used to select samples
Types of Probability Sampling Design • Simple Random Sampling (SRS) – Sampling frame chosen then each element assigned a single number • Sampling frame – is a list of all elements in the population. Every element must be listed and listed only once. A Sample is selected from this list. – Random numbers table used to select samples
 Figure 12. 10 A Graphical Illustration of Probability Sampling Techniques Simple Random Sampling A B C D E 1 6 11 16 21 2 7 12 17 22 3 8 13 18 23 4 9 14 19 24 5 10 15 20 25 Select five random numbers from 1 to 25. The resulting sample consists of population elements 3, 7, 9, 16, and 24. Note, there is no element from Group C.
 Systematic Sampling • The sample is chosen by selecting a random starting point and then picking every ith element in succession from the sampling frame. • The sampling interval, i, is determined by dividing the population size N by the sample size n and rounding to the nearest integer. • When the ordering of the elements is related to the characteristic of interest, systematic sampling increases the representativeness of the sample. • If the ordering of the elements produces a cyclical pattern, systematic sampling may decrease the representativeness of the sample. For example, there are 100, 000 elements in the population and a sample of 1, 000 is desired. In this case the sampling interval, i, is 100. A random number between 1 and 100 is selected. If, for example, this number is 23, the sample consists of elements 23, 123, 223, 323, 423, 523, and so on.
 Systematic Sampling • If the ordering of the elements produces a cyclical pattern, systematic sampling may decrease the representativeness of the sample. For example, there are 100, 000 elements in the population and a sample of 1, 000 is desired. In this case the sampling interval, i, is 100. A random number between 1 and 100 is selected. If, for example, this number is 23, the sample consists of elements 23, 123, 223, 323, 423, 523, and so on.
 Systematic Sampling • Every ith element in the list is systematically chosen – i = N/n (N – population size, n – sample size) • First element should be chosen at random • Sampling interval- number between chosen elements • Sampling ratio- proportion of elements in the population that are selected (ie. 1/100)
 Figure 12. 10 A Graphical Illustration of Probability Sampling Techniques Systematic Sampling A B C D E 1 6 11 16 21 2 7 12 17 22 3 8 13 18 23 4 9 14 19 24 5 10 15 20 25 Select a random number between 1 to 5, say 2. The resulting sample consists of population 2, (2+5=) 7, (2+5 x 2=) 12, (2+5 x 3=)17, and (2+5 x 4=) 22. Note, all the elements are selected from a single row.
 Stratified Sampling • A two-step process in which the population is partitioned into subpopulations, or strata. • The strata should be mutually exclusive and collectively exhaustive in that every population element should be assigned to one and only one stratum and no population elements should be omitted. • Next, elements are selected from each stratum by a random procedure, usually SRS. • A major objective of stratified sampling is to increase precision without increasing cost.
 Stratified Sampling • Sample for which the population is divided into two or more groups, called strata (plural from stratum), in a way that guarantees each element fits into exactly one stratum – Travelling patterns of students working part -time as a travel agent – • Hypothesis - students working part-time as a travel agent are travelling more often
 Stratified Sampling • The elements within a stratum should be as homogeneous as possible, but the elements in different strata should be as heterogeneous as possible. • The stratification variables should also be closely related to the characteristic of interest. • Finally, the variables should decrease the cost of the stratification process by being easy to measure and apply.
 Figure 12. 10 A Graphical Illustration of Probability Sampling Techniques Stratified Sampling A B C D E 1 6 11 16 21 2 7 12 17 22 3 8 13 18 23 4 9 14 19 24 5 10 15 20 25 Randomly select a number from 1 to 5 for each stratum, A to E. The resulting sample consists of population elements 4, 7, 13, 19 and 21. Note, one element is selected from each column.
 Cluster Sampling • The target population is first divided into mutually exclusive and collectively exhaustive subpopulations, or clusters. • Then a random sample of clusters is selected, based on a probability sampling technique such as SRS. • For each selected cluster, either all the elements are included in the sample (one-stage) or a sample of elements is drawn probabilistically (two-stage). • Elements within a cluster should be as heterogeneous as possible, but clusters themselves should be as homogeneous as possible. Ideally, each cluster should be a small-scale representation of the population. • In probability proportionate to size sampling, the clusters are sampled with probability proportional to size. In the second stage, the probability of selecting a sampling unit in a selected cluster varies inversely with the size of the cluster.
 Cluster sampling • • • Clusters- groups of elements. Cluster sampling may be used when it’s either impossible or impractical to compile an exhaustive list of the elements composing the target population, such as all students in Almaty The idea of a cluster sampling is to sample groups of individual elements called “clusters”
 Cluster sampling • Primary sampling unit – households, schools, instead of individual persons • The general term for sampling within clusters is multistage sampling • Difference between cluster sample and stratified sample: – Stratified sample is one that selects individuals from every stratum, the strata are not sampled – Cluster sample is one that samples clusters, rather than taking all of them
") Figure 12. 10 A Graphical Illustration of Probability Sampling Techniques Cluster Sampling (2 -Stage) A B C D E 1 6 11 16 21 2 7 12 17 22 3 8 13 18 23 4 9 14 19 24 5 10 15 20 25 Randomly select 3 clusters, B, D and E. Within each cluster, randomly select one or two elements. The resulting sample consists of population elements 7, 18, 20, 21, and 23. Note, no elements are selected from clusters A and C.
Figure 12. 10 A Graphical Illustration of Probability Sampling Techniques Cluster Sampling (2 -Stage) A B C D E 1 6 11 16 21 2 7 12 17 22 3 8 13 18 23 4 9 14 19 24 5 10 15 20 25 Randomly select 3 clusters, B, D and E. Within each cluster, randomly select one or two elements. The resulting sample consists of population elements 7, 18, 20, 21, and 23. Note, no elements are selected from clusters A and C.
 Figure 12. 11 Types of Cluster Sampling Divide Population into Cluster Randomly Sample Clusters One Stage Include All Elements from Each Selected Cluster Two-Stage Randomly Sample Elements from Each Selected Cluster
 Choosing Nonprobability Vs. Probability Sampling
 A Classification of Internet Sampling Online Intercept Sampling Recruited Online Sampling Nonrandom Recruited Panels Panel Opt-in Panels Other Techniques Nonpanel Opt-in List Rentals
 Procedures for Drawing Probability Samples Exhibit 11. 1 Simple Random Sampling 1. Select a suitable sampling frame 2. Each element is assigned a number from 1 to N (pop. size) 3. Generate n (sample size) different random numbers between 1 and N 4. The numbers generated denote the elements that should be included in the sample
 Procedures for Drawing Probability Samples Exhibit 11. 1, cont. Systematic Sampling 1. Select a suitable sampling frame 2. Each element is assigned a number from 1 to N (pop. size) 3. Determine the sampling interval i: i=N/n. If i is a fraction, round to the nearest integer 4. Select a random number, r, between 1 and i, as explained in simple random sampling 5. The elements with the following numbers will comprise the systematic random sample: r, r+i, r+2 i, r+3 i, r+4 i, . . . , r+(n-1)i
 Procedures for Drawing Probability Samples Stratified Sampling Exhibit 11. 1, cont. 1. Select a suitable frame 2. Select the stratification variable(s) and the number of strata, H 3. Divide the entire population into H strata. Based on the classification variable, each element of the population is assigned to one of the H strata 4. In each stratum, number the elements from 1 to Nh (the pop. size of stratum h) 5. Determine the sample size of each stratum, nh, based on proportionate or disproportionate stratified sampling, where H h=1 nh = n 6. In each stratum, select a simple random sample of size n h
 Procedures for Drawing Cluster Probability Samples Sampling Exhibit 11. 1, cont. 1. Assign a number from 1 to N to each element in the population 2. Divide the population into C clusters of which c will be included in the sample 3. Calculate the sampling interval i, i=N/c (round to nearest integer) 4. Select a random number r between 1 and i, as explained in simple random sampling 5. Identify elements with the following numbers: r, r+i, r+2 i, . . . r+(c-1)i 6. Select the clusters that contain the identified elements 7. Select sampling units within each selected cluster based on SRS or systematic sampling 8. Remove clusters exceeding sampling interval i. Calculate new population size N*, number of clusters to be selected C*= C-1, and new sampling interval i*.
 Procedures for Drawing Probability Samples Exhibit 11. 1, cont. Cluster Sampling Repeat the process until each of the remaining clusters has a population less than the sampling interval. If b clusters have been selected with certainty, select the remaining c-b clusters according to steps 1 through 7. The fraction of units to be sampled with certainty is the overall sampling fraction = n/N. Thus, for clusters selected with certainty, we would select ns=(n/N)(N 1+N 2+. . . +Nb) units. The units selected from clusters selected under two-stage sampling will therefore be n*=n- ns.
 Strengths and Weaknesses of Basic Sampling Techniques Technique Strengths Weaknesses Nonprobability Sampling Convenience sampling Least expensive, least time-consuming, most convenient Low cost, convenient, not time-consuming Sample can be controlled for certain characteristics Can estimate rare characteristics Selection bias, sample not representative, not recommended for descriptive or causal research Does not allow generalization, subjective Selection bias, no assurance of representativeness Time-consuming Easily understood, results projectable Difficult to construct sampling frame, expensive, lower precision, no assurance of representativeness. Can decrease representativeness Judgmental sampling Quota sampling Snowball sampling Probability sampling Simple random sampling (SRS) Systematic sampling Stratified sampling Cluster sampling Can increase representativeness, easier to implement than SRS, sampling frame not necessary Include all important subpopulations, precision Easy to implement, cost effective Difficult to select relevant stratification variables, not feasible to stratify on many variables, expensive Imprecise, difficult to compute and interpret results
 Homework • Chapter 11 • Start design your team project’s questionnaire • Quiz 6, ch. 11 (5 True/False Questions + 5 Multiple Choice Questions + 3 Short answer Questions)
 Thank you!