

709ef612ce87736de42fe396419ccb1a.ppt
- Количество слайдов: 54


 of various species") Fig. 6 -1. The range of population density (biomass per hectare) of various species of mammals.
Fig. 6 -1. The range of population density (biomass per hectare) of various species of mammals.


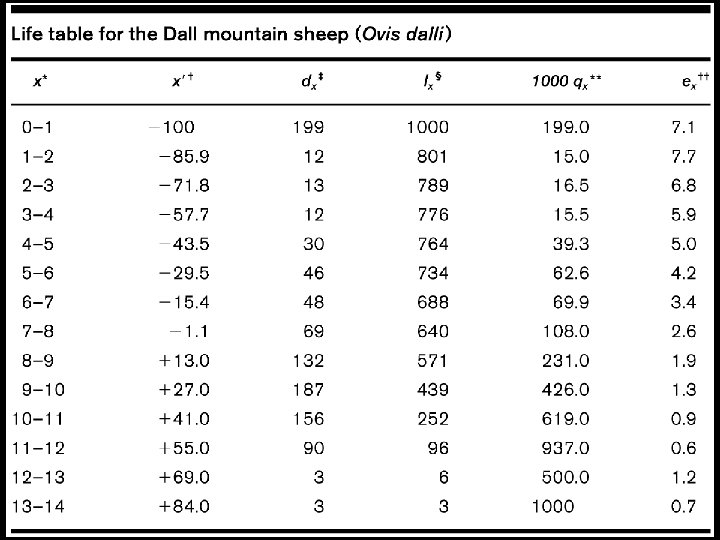
 Fig. 6 -2. Survivorship curve for the data tabulated in Table 6 -1 for Dall mountain sheep,
 Fig. 6 -3. types of survivorship curves.
 Fig. 6 -4 Survivorship curves for two stable mule deer populations.
 three types of age pyramids.") Fig. 6 -5. Age pyramids (A) three types of age pyramids.
Fig. 6 -5. Age pyramids (A) three types of age pyramids.
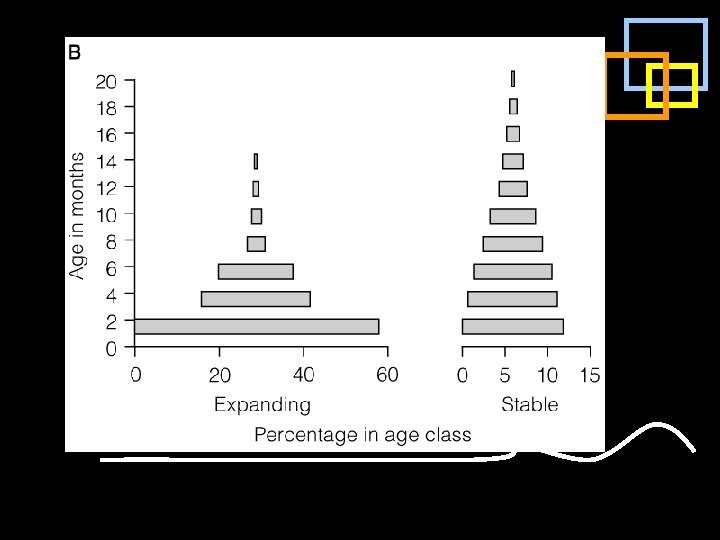
 Fig. 6 -6. Population age pyramids for different human populations.
 Fig. 6 -7. Age distribution in the commercial catch of herring in the North /sea between 1907 and 1919, illustrating the dominant age class phenomenon.

 population growth curve") Fig. 6 -8. (A) population growth curve
Fig. 6 -8. (A) population growth curve
 rate of increase growth curve for the same hypothetical population") Fig. 6 -8. (B) rate of increase growth curve for the same hypothetical population during the same interval of time.
Fig. 6 -8. (B) rate of increase growth curve for the same hypothetical population during the same interval of time.


 J-shaped growth curves.") Fig. 6 -9. hypothetical examples of (A) J-shaped growth curves.
Fig. 6 -9. hypothetical examples of (A) J-shaped growth curves.
 Sshaped growth curves.") Fig. 6 -9. hypothetical examples of (A) Sshaped growth curves.
Fig. 6 -9. hypothetical examples of (A) Sshaped growth curves.
 Fig. 6 -10. Curves showing theoretical upper and lower growth forms for any population.
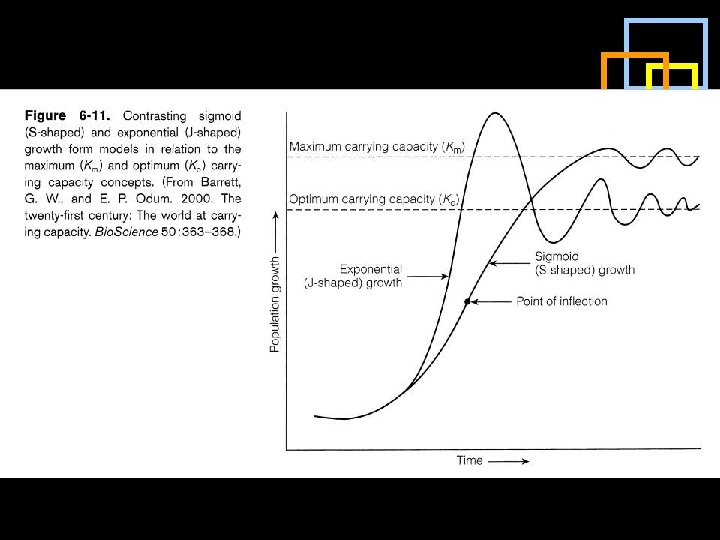
 Fig. 6 -12. Graph depicting the various phases of the modified sigmoid growth curve.

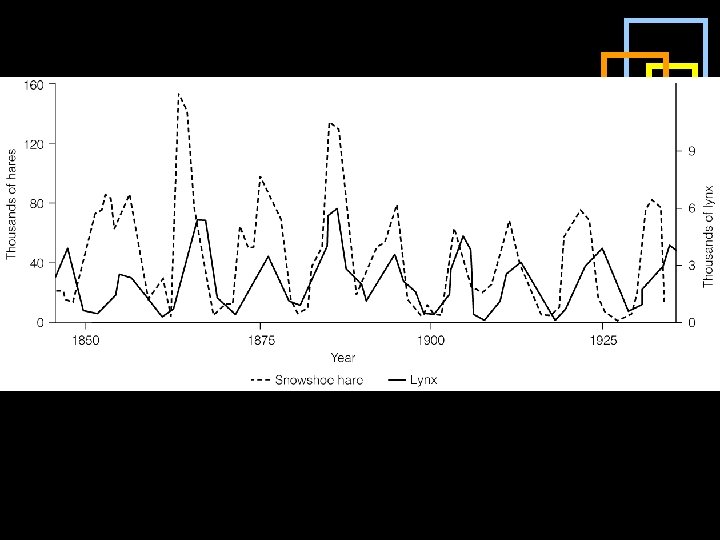
, with (A) summer and (B) winter") Fig. 6 -15. the snaowshoe hare (Lepus americanus), with (A) summer and (B) winter pelage.
Fig. 6 -15. the snaowshoe hare (Lepus americanus), with (A) summer and (B) winter pelage.

 hypotheses to") Fig. 6 -18. Modified version of the Chitty. Krebs genetic feedback (A) hypotheses to explain population pulses in microtine rodents.
Fig. 6 -18. Modified version of the Chitty. Krebs genetic feedback (A) hypotheses to explain population pulses in microtine rodents.
 hypotheses to") Fig. 6 -18. Modified version of the Chitty. Krebs food quality (B) hypotheses to explain population pulses in microtine rodents.
Fig. 6 -18. Modified version of the Chitty. Krebs food quality (B) hypotheses to explain population pulses in microtine rodents.
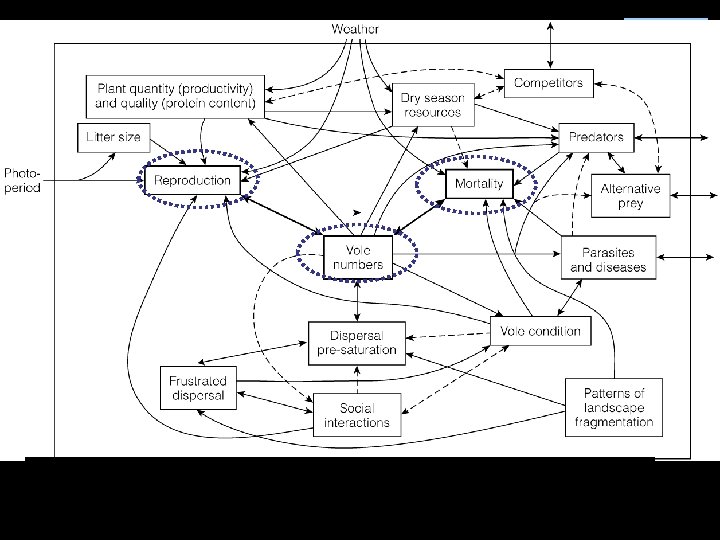
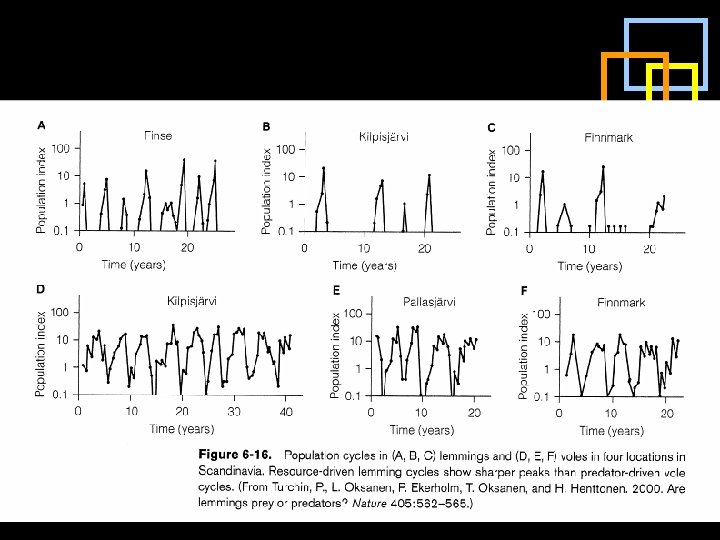
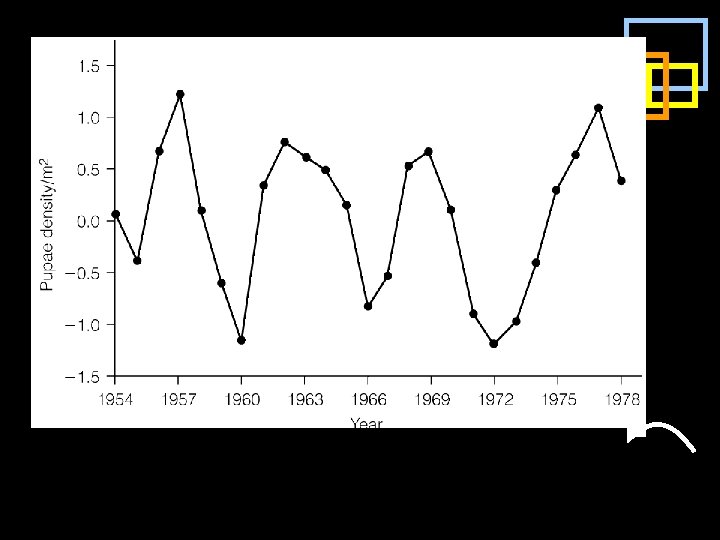
 Fig. 6 -20. Three types of population-level pulsing

 Japalura@hotmail. com