5ba0a8f5462e2975c59a5df334b5cce6.ppt
- Количество слайдов: 22
 FDI, Firm Heterogeneity and Exports: An examination of evidence in India Maitri Ghosh Assistant Professor Bethune College, Kolkata, India & Saikat Sinha. Roy Associate Professor Jadavpur University, Kolkata, India
 brings in a bundle of") Why is FDI important? • Foreign Direct Investment (FDI) brings in a bundle of tangible and intangible assets such as new technology, skill, marketing and managerial know-how which are relatively scarce in the developing countries but are indispensable for export. • As MNEs form the major channel which brings in FDI, access to foreign markets becomes easier which can lead to the expansion of manufactured exports. • Export activities of foreign firms have a prospective chance of spillovers which might increase the productivity of the domestic firms and their global competitiveness.
Why is FDI important? • Foreign Direct Investment (FDI) brings in a bundle of tangible and intangible assets such as new technology, skill, marketing and managerial know-how which are relatively scarce in the developing countries but are indispensable for export. • As MNEs form the major channel which brings in FDI, access to foreign markets becomes easier which can lead to the expansion of manufactured exports. • Export activities of foreign firms have a prospective chance of spillovers which might increase the productivity of the domestic firms and their global competitiveness.
 for some export oriented firms of South Korea, Taiwan and") Literature • Cohen (1975) for some export oriented firms of South Korea, Taiwan and Singapore, Reidel(1975) &Jenkins (1979) for Mexican industries, Kirim (1986) on Turkish Pharmaceutical industries Roberts &Tybout(1997)for Columbian manufacturing industries……. . • Subrahmanian &Pillai (1979), Singh(1986), Kumar(1989), Aggarwal(2002)……. • Aitken, Hanson &Harrison (1997), Gorg &Greenaway(2004), Greenaway, Sousa, Wakelin(2004)…
Literature • Cohen (1975) for some export oriented firms of South Korea, Taiwan and Singapore, Reidel(1975) &Jenkins (1979) for Mexican industries, Kirim (1986) on Turkish Pharmaceutical industries Roberts &Tybout(1997)for Columbian manufacturing industries……. . • Subrahmanian &Pillai (1979), Singh(1986), Kumar(1989), Aggarwal(2002)……. • Aitken, Hanson &Harrison (1997), Gorg &Greenaway(2004), Greenaway, Sousa, Wakelin(2004)…
 Emerging literature relating to heterogeneity of firms Heterogeneity of firms is explained in terms of : Ø Sunk costs ( Roberts & Tybout, 1997, Schmitt & Yu, 2001) Ø Productivity of firms (Melitz, 2003; Melitz &Yeaple, 2004; Melitz &Octaviano, 2005; Yeaple , 2005) Literature on credit availability… Chaney, 2005; Helpman, Melitz & Rubenstein, 2006; Mirabelle, 2008; Kapoor, Ranjan &Raychaudhuri, 2011……
 This paper investigates into: § Firm-level export performance across sectors in India over the period 1991 -2010 and identifies the factors that determine export performance. § In specific we explore whether FDI has a role in determining performance. § Whether the presence of the foreign enterprises has any spillover effect on the export performance of the domestic firms.
 Manufacturing Industries • • • Chemical Food and Beverages Textiles Metal and metal products Machinery Transport Equipments DATABASE: PROWESS OF CMIE PERIOD: 1991 -2010
 Average Export intensity Year Chemical Food and beverages Textile Electrical machinery Electronics 1990 s 0. 09 0. 24 0. 22 0. 06 0. 07 2000 s 0. 18 0. 29 0. 07 0. 01
 Weighted Average Export intensity Year Non electrical machinery Ferrous metals Non ferrous metals Transport Equipment 1990 s 0. 07 0. 04 0. 13 0. 10 2000 s 0. 12 0. 04 0. 26 0. 11
 Difference in the average export intensity of the domestic firms and the foreign firms tested at 5% level of significance Industry Mean export intensity of the domestic firms foreign firms t value Implication Chemical . 13 . 12 2. 03 Significant difference Food and Beverages 2. 49 . 32 1. 2 No significant difference Textiles . 23 . 16 6. 9 Significant difference Machinery . 08 . 12 5. 4 Significant difference Metals . 41 . 10 4. 5 Significant difference Transport Equipments . 15 . 05 1. 24 No Significant difference
, Journal of International Economics, The") The theoretical structure Following Aitken, Hanson and Harrison (1997), Journal of International Economics, The choice of a firm to serve the domestic market, to export or to do both is to maximize its profit: Max Pdqd + Pfqf- h(qd + qf)- md(qd)- mf (qf)-s , s. t. qd, qf≥ 0, Subscripts d and f refer to domestic and foreign markets respectively. Aitken’s Cost structure: h(qd+qf)= a/2*(qd+qf)2+g (qd+qf)and, Mi(qi)=1/2*biqi 2 +ciqi , i=f, d where a, g, b, c are scalar parameters.
The theoretical structure Following Aitken, Hanson and Harrison (1997), Journal of International Economics, The choice of a firm to serve the domestic market, to export or to do both is to maximize its profit: Max Pdqd + Pfqf- h(qd + qf)- md(qd)- mf (qf)-s , s. t. qd, qf≥ 0, Subscripts d and f refer to domestic and foreign markets respectively. Aitken’s Cost structure: h(qd+qf)= a/2*(qd+qf)2+g (qd+qf)and, Mi(qi)=1/2*biqi 2 +ciqi , i=f, d where a, g, b, c are scalar parameters.
 (-/+) (+/-) α") Equations in the estimable forms The export performance equation is: (+/-) (-/+) (+/-) α 1(SIZE)+α 2(SIZE)2+ EXPI=α 0 + α 3(IMPR)+ α 4(IMPR)2+ α 5(KI)+ α 6(KI)2+ α 7(FPTR) (-/+) (+/-) (-/+) 2+α (MKTCOST)2+α (PDTIVITY)2 +α 8(FPTR) 10 11 12 9 (+/-) (-/+ ) (+/-) 2+ α (RDI) α 13(CRDT)+α 14(CRDT) 15 (-/+) (+/-) (-/+) 2+α (AGE)+ α (AGE)2+u + α 16(RDI) 17 18 i+ The export spillover equation is: (+/-) (-/+) (+/-) (-/+) (+/-) (-/+) (+/-) DOMX=α 0 + α 1(SIZE)+α 2(SIZE)2+ α 3(IMPR)+ α 4(IMPR)2+ α 5(KI)+ α 6(KI)2+ α 7(FPTR) (-/+) (+/-) (-/+) 2 +α (MKTCOST)2+α (PDTIVITY)2 + α 8(FPTR) 10 11 12 9 (+/-) (-/+ ) (+/-) 2 α (RDI)+ α 13(CRDT)+α 14(CRDT) 15 (-/+) (+/-) 2+ α (AGE) α 16(RDI) 17 (-/+) + α 18(AGE)2+ α 19 (FOR) +uit
Equations in the estimable forms The export performance equation is: (+/-) (-/+) (+/-) α 1(SIZE)+α 2(SIZE)2+ EXPI=α 0 + α 3(IMPR)+ α 4(IMPR)2+ α 5(KI)+ α 6(KI)2+ α 7(FPTR) (-/+) (+/-) (-/+) 2+α (MKTCOST)2+α (PDTIVITY)2 +α 8(FPTR) 10 11 12 9 (+/-) (-/+ ) (+/-) 2+ α (RDI) α 13(CRDT)+α 14(CRDT) 15 (-/+) (+/-) (-/+) 2+α (AGE)+ α (AGE)2+u + α 16(RDI) 17 18 i+ The export spillover equation is: (+/-) (-/+) (+/-) (-/+) (+/-) (-/+) (+/-) DOMX=α 0 + α 1(SIZE)+α 2(SIZE)2+ α 3(IMPR)+ α 4(IMPR)2+ α 5(KI)+ α 6(KI)2+ α 7(FPTR) (-/+) (+/-) (-/+) 2 +α (MKTCOST)2+α (PDTIVITY)2 + α 8(FPTR) 10 11 12 9 (+/-) (-/+ ) (+/-) 2 α (RDI)+ α 13(CRDT)+α 14(CRDT) 15 (-/+) (+/-) 2+ α (AGE) α 16(RDI) 17 (-/+) + α 18(AGE)2+ α 19 (FOR) +uit
 Determinants of export performance & spillovers SIZE: Ratio of firm sales to Industry Sales. IMPR: Ratio of imports of raw materials to Sales. KI: Ratio of imports of capital goods to Sales. FPTR: Ratio of technical fees and royalties paid abroad to Sales. MKTCOST: Ratio of the sum of advertising expenditure, marketing expenditure and distribution expenditure to Sales. PDTIVITY: Ratio value of output to salaries and wages. CRDT: Ratio of Total borrowing to value of output. RDI: Ratio of R&D expenditure to Sales. FOR: Average Export intensity of foreign firms.
 Methodology • Panel structure for the six industries are constructed. • Panel data estimation technique has been used. • Fixed effect and Random effect specifications are considered. • Hausman Specification test is taken into consideration.
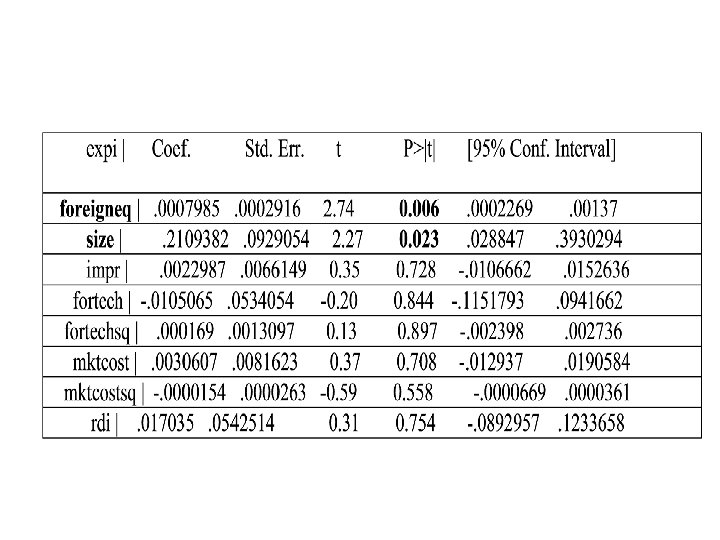
 Results Ø SIZE & AGE turns out to be positively significant for the high tech industries like Chemical, Metals and transport equipments. Ø IMPR is significant for most of the industries. Ø KI is significant for most of the industries. Ø FPTR is significant for the transport equipment industry. Ø As far as the sunk costs are concerned in terms of advertising, marketing and distribution costs MKTCOST significantly explain exporting behavior for most of the industries. Ø PDTIVITY is important only for the Machinery industry. Ø CRDT turns out to be positively significant for the transport equipment industry.
") Estimation Results Table (Export performance)
Estimation Results Table (Export performance)
 Continued…
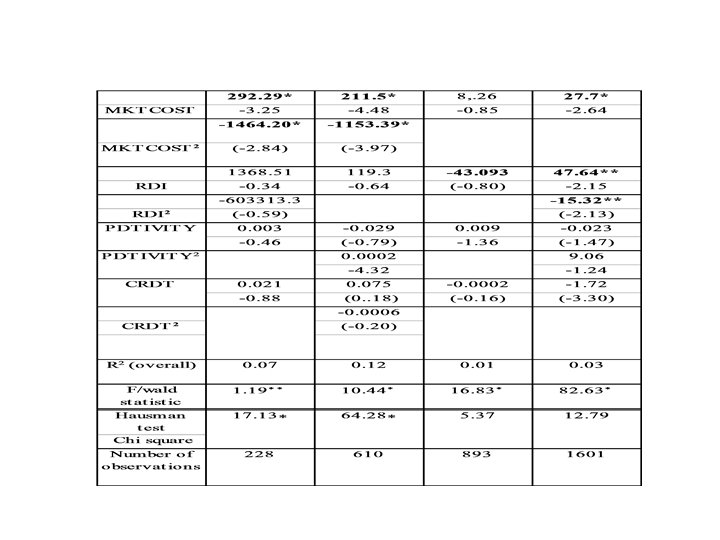
 Export Spillovers § FOR turns out to be positive & significant for the Chemical industry. §In case of the other industries the relationship is positive though not significant.
") Estimation Results (Export spillovers)
Estimation Results (Export spillovers)
 Conclusion • The average export intensity of the Indian manufacturing show a rising trend in the post reforms period, in particular after 2000. • Estimation results show that with liberalization the manufacturing industries have grown competitive with import of raw materials, foreign capital good and technical know-how. • There has been huge dependence on the ability to bear sunk costs of marketing & distribution. Productivity is not much important excepting the machinery industry. • Size & Age of a firm plays an important role. • With an exception to the machinery industry the domestic firms are better performers and there is evidence of export spillovers for the Chemical industry.
 THANK YOU