

3738a2a0c813783f760b574ee1a1e550.ppt
- Количество слайдов: 152
 EXPLORATION TECHNIQUES Virginia Mc. Lemore
 WHAT ARE THE OBJECTIVES IN EXPLORATION?
 WHAT ARE THE OBJECTIVES IN EXPLORATION? u u u u u Establish baseline/background conditions Find alteration zones Find ore body Determine if ore can be mined or leached Determine if ore can be processed Determine ore reserves Locate areas for infrastructure/operations Environmental assessment Further understand uranium deposits Refine exploration models
 STEPS Define uranium deposit model u Select area u Collect and interpret regional data u Define local target area u Field reconnaissance u Reconnaissance drilling u Bracket drilling u Ore discovery u
 Select Area u How do we select an area to look for uranium?
 Select Area u How do we select an area to look for uranium? • Areas of known production • Areas of known uranium occurrences • Favorable conditions for uranium
 COLLECT DATA Historical data u State, federal surveys u University research programs u Archives u Company reports u Web sites u Published literature u Prospectors u
, electromagnetic u") Methods u u u u u Magnetic surveys u Electromagnetic (EM, EMI), electromagnetic u sounding u Direct current (DC) u GPR (Ground penetrating u radar potential) Seismic Time-domain u electromagnetic (TEM) u Controlled source audio- u magnetotellurics (CSAMT) u Radiometric surveys u Induced polarization (IP) u Spontaneous potential (SP) Borehole geophysics Satellite imagery Imagery spectrometry ASTER (Advanced spaceborne thermal emissions reflection radiometer) AVIRIS PIMA SFSI LIBS SWIR Multispectral
Methods u u u u u Magnetic surveys u Electromagnetic (EM, EMI), electromagnetic u sounding u Direct current (DC) u GPR (Ground penetrating u radar potential) Seismic Time-domain u electromagnetic (TEM) u Controlled source audio- u magnetotellurics (CSAMT) u Radiometric surveys u Induced polarization (IP) u Spontaneous potential (SP) Borehole geophysics Satellite imagery Imagery spectrometry ASTER (Advanced spaceborne thermal emissions reflection radiometer) AVIRIS PIMA SFSI LIBS SWIR Multispectral
 REMOTE SENSING
 Landsat Thematic Mapper (TM)") Remote Sensing Techniques u u u Digital elevation model (DEM) Landsat Thematic Mapper (TM) ASTER (Advanced Spaceborne Thermal Emission and Reflection Radiometer) Hyperspectral remote sensing (spectral bands, 14 and >100 bands) NOAA-AVHRR (National Oceanic and Atmospheric Administration - Advanced Very High Resolution Radiometer
Remote Sensing Techniques u u u Digital elevation model (DEM) Landsat Thematic Mapper (TM) ASTER (Advanced Spaceborne Thermal Emission and Reflection Radiometer) Hyperspectral remote sensing (spectral bands, 14 and >100 bands) NOAA-AVHRR (National Oceanic and Atmospheric Administration - Advanced Very High Resolution Radiometer
 SATELLITE LANDSAT Remote sensing is the science of remotely acquiring, processing and interpreting spectral information about the earth’s surface and recording interactions between matter and electromagnetic energy. AIRBORNE HYPERSPECTRAL GROUND Field Spectrometer Alumbrera, Ar Data is collected from satellite and airborne sensors. It is then calibrated and verified using a field spectrometer. CUPRITE, NV Goldfield, NV
 Sunlight Interaction with the Atmosphere and the Earth’s Surface Data is collected in contiguous channels by special detector arrays. Collection is done at different spectral and spatial resolutions depending on the type of sensor. ELECTROMAGNETIC SPECTRUM Each spatial element is called a pixel. Pixel size varies from 1/2 meters in some hyperspectral sensors to 30 meters in Landsat and ASTER, which are multispectral. Sensor spatial differences and band configurations are shown below. The electromagnetic spectrum is a distribution of energy over specific wavelengths. When this energy is emitted by a luminous object, it can be detected over great distances. Through the use of instrumentation, the technique detects this energy reflected and emitted from the earth’s surface materials such as minerals, vegetation, soils, ice, water and rocks, in selected wavelengths. A proportion of the energy is reflected directly from the earth’s surface. Natural objects are generally not perfect reflectors, and therefore the intensity of the reflection varies as some of the energy is absorbed by the earth and not reflected back to the sensor. These interactions of absorption and reflection form the basis of spectroscopy and hyperspectral analysis. Source: Bob Agars
 HYPERSPECTRAL IMAGING SPECTROSCOPY Imaging spectroscopy is a technique for obtaining a spectrum in each position of a large array of spatial positions so that any one spectral wavelength can be used to make a coherent image (data cube). Imaging spectroscopy for remote sensing involves the acquisition of image data in many contiguous spectral bands with an ultimate goal of producing laboratory quality reflectance spectra for each pixel in an image (Goetz, 1992 b). The latter part of this goal has not yet been reached. The major difference from Landsat is the ability to detect individual mineral species and differentiate vegetation species. Source: CSIRO This "image cube" from JPL's Airborne Visible/Infrared Imaging Spectrometer (AVIRIS) shows the volume of data returned by the instrument. AVIRIS acquired the data on August 20, 1992 when it was flown on a NASA ER-2 plane at an altitude of 20, 000 meters (65, 000 feet) over Moffett Field, California, at the southern end of the San Francisco Bay. The top of the cube is a false-color image made to accentuate the structure in the water and evaporation ponds on the right. Also visible on the top of the cube is the Moffett Field airport. The sides of the cube are slices showing the edges of the top in all 224 of the AVIRIS spectral channels. The tops of the sides are in the visible part of the spectrum (wavelength of 400 nanometers), and the bottoms are in the infrared (2, 500 nanometers). The sides are pseudo-color, ranging from black and blue (low response) to red (high response). Of particular interest is the small region of high response in the upper right corner of the larger side. This response is in the red part of the visible spectrum (about 700 nanometers), and is due to the presence of 1 -centimeter-long (half-inch) red brine shrimp in the evaporation pond.
 Exploration Techniques: Geologic Mapping Leann M. Giese February 7, 2008
 In the mine life cycle, geologic mapping falls under") Mining Life Cycle (Spiral? ) In the mine life cycle, geologic mapping falls under Exploration, but it effects all of the life cycles Closure Ongoing Operations Post-Closure u Temporary Closure Operations Exploration Future Land Use Mine Development (Mc. Lemore, 2008) ? ? ?
Mining Life Cycle (Spiral? ) In the mine life cycle, geologic mapping falls under Exploration, but it effects all of the life cycles Closure Ongoing Operations Post-Closure u Temporary Closure Operations Exploration Future Land Use Mine Development (Mc. Lemore, 2008) ? ? ?
") What is geologic mapping? A way to gather & present geologic data. (Peters, 1978) u Shows how rock & soil on the earths surface is distributed. (USGS) u Are used to make decisions on how to use our water, land, and resources. u (USGS) u Help to come up with a model for an ore body. (Peters, 1978)
What is geologic mapping? A way to gather & present geologic data. (Peters, 1978) u Shows how rock & soil on the earths surface is distributed. (USGS) u Are used to make decisions on how to use our water, land, and resources. u (USGS) u Help to come up with a model for an ore body. (Peters, 1978)
 • To better understand the geological features of an") What is Geologic Mapping? (continued) • To better understand the geological features of an area • Predict what is below the earth’s surface • Show other features such as faults and strike and dips. (USGS (a)) Figure 1. Graphic representation of typical information in a general purpose geologic map that can be used to identify geologic hazards, locate natural resources, and facilitate land-use planning. (After R. L. Bernknopf et al. , 1993)
What is Geologic Mapping? (continued) • To better understand the geological features of an area • Predict what is below the earth’s surface • Show other features such as faults and strike and dips. (USGS (a)) Figure 1. Graphic representation of typical information in a general purpose geologic map that can be used to identify geologic hazards, locate natural resources, and facilitate land-use planning. (After R. L. Bernknopf et al. , 1993)
 Simplified Geologic Map of New Mexico Topographic Map of the Valle Grande in the Jamez Mountains (from NMBGMR).
 Geologic Mapping Equipment Field notebooks Rock hammer u u Hand Lens (10 x or Hastings triplet) u Pocket knife u Magnet u Clip board u Pencils (2 H-4 H) and Colored Pencils u Rapidograph-type pens and Markers u Scale-protractor (10 and 50 or 1: 1000 and 1: 4000) u Belt pouches or field vest u 30 meter tape measurer u Brunton pocket transit u GPS/Altimeters u Camera u (Compton, 1985)
 Mapping types u Aerial photographs u Topographical bases u Pace and Compass u Chains (Compton, 1985)
 Map scales A ratio that relates a unit of measure on a map to some number of the same units of measure on the earth's surface. A map scale of 1: 25, 000 tells us that 1 unit of measure represents 25, 000 of the same units on the earth's surface. One inch on the map represents 25, 000 inches on the earth's surface. One meter or one yard or one kilometer or one mile on a map would represent 25, 000 meters or yards or kilometers or (from USGS (b)) miles, respectively, on the earth's surface.
 Map Scale One cm on the map represents One km on") Map scales (continued) Map Scale One cm on the map represents One km on One inch on One mile on the Earth is the map the Earth represented represents represented on the map by by 1: 2, 000 20 meters 50 centimeters 166. 67 feet 31. 68 inches 1: 25, 000 250 meters 4 centimeters 2, 083. 33 feet 2. 53 inches 1: 100, 000 1, 000 meters 1 centimeter 1. 58 miles 0. 634 inches 0. 02 centimeters 0. 013 inches 1: 5, 000 50, 000 meters (from USGS (b)) 78. 91 miles
Map scales (continued) Map Scale One cm on the map represents One km on One inch on One mile on the Earth is the map the Earth represented represents represented on the map by by 1: 2, 000 20 meters 50 centimeters 166. 67 feet 31. 68 inches 1: 25, 000 250 meters 4 centimeters 2, 083. 33 feet 2. 53 inches 1: 100, 000 1, 000 meters 1 centimeter 1. 58 miles 0. 634 inches 0. 02 centimeters 0. 013 inches 1: 5, 000 50, 000 meters (from USGS (b)) 78. 91 miles
 What to do first? u u Most mineral deposits are found in districts where there has been mining before, an earlier geologist has noticed something of importance there, or a prospector has filed a mineral claim Literature Search: • Library (University, Government, Engineering, or Interlibrary loans) • State and National bureaus of mines and geological surveys (may have drill core, well cuttings, or rock samples available to inspect) • Mining company information • Maps and aerial photographs u (Peters, 1978) Is the information creditable? Is it worth
 Where to go from here? u u u Mapping is costly and time consuming, so an area of interest needs to be defined Reconnaissance helps narrows a region to a smaller area of specific interest Reconnaissace in the U. S. usually begins at 1: 250, 000 -scale This large scale mapping can zone-in on areas of interest that can then be geologically mapped in detail (this is usually done on a 1: 10, 000 or 1: 12, 000 -scale). Individual mineral deposits can be mapped at a 1: 2, 000 or 1: 2, 400 -scale to catch its smaller significant features.
 Detailed Geological Mapping When mapping, we want to be quick, because time is money, but not too quick as to make a mistake or miss something. u Along with mapping occurs drilling, trenching, geophysics, and geochemistry u Samples can be analyzed for Uranium concentrations. This gives a better idea of where to explore more u
 below") Uranium Deposit Types u Unconformity-related deposits • Metasedimentary rocks (mineralisation, fauletd, and brecciated) below and Proterozoic SS. Above (pitchblende) u Breccia complex deposits • Hematite-rich breccia complex (iron, copper, gold, silver, & REE) u Sandstone deposits • Rollfront deposits, tabular deposits, tectonic/lithologic deposits u Surficial deposits • Young, near-surface uranium concentrations in sediments or soils (calcite, gypsum, dolomite, ferric oxide, and halite) u Volcanic deposits • Acid volcanic rocks and related to faults and shear zones within the volcanics (molybdenum & fluorine) u Intrusive deposits • Associated with intrusive rocks (alaskite, granite, pegmatite, and monzonites) u Metasomatite deposits • In structurally-deformed rocks altered by metasomatic processes (sodium, potassium or calcium introduction) (Lambert et al. , 1996)
Uranium Deposit Types u Unconformity-related deposits • Metasedimentary rocks (mineralisation, fauletd, and brecciated) below and Proterozoic SS. Above (pitchblende) u Breccia complex deposits • Hematite-rich breccia complex (iron, copper, gold, silver, & REE) u Sandstone deposits • Rollfront deposits, tabular deposits, tectonic/lithologic deposits u Surficial deposits • Young, near-surface uranium concentrations in sediments or soils (calcite, gypsum, dolomite, ferric oxide, and halite) u Volcanic deposits • Acid volcanic rocks and related to faults and shear zones within the volcanics (molybdenum & fluorine) u Intrusive deposits • Associated with intrusive rocks (alaskite, granite, pegmatite, and monzonites) u Metasomatite deposits • In structurally-deformed rocks altered by metasomatic processes (sodium, potassium or calcium introduction) (Lambert et al. , 1996)
 u Metamorphic deposits • Ore body occurs in a calcium-rich") Uranium Deposit Types (continued) u Metamorphic deposits • Ore body occurs in a calcium-rich alteration zone within Proterozoic metamoprphic rocks u Quartz-pebble conglomerate deposits • Uranium recovered as a by-product of gold mining u Vein deposits • Spatially related to granite, crosscuts metamorphic or sedimentary rocks (coffinite, pitchblende) u Phosphorite deposits • Fine-grained apatie in phosphorite horizons; mud, shale, carbonates and SS. interbedded u Collapse breccia deposits • Vertical tubular-like deposits filled with coarse and fine fragments u u Lignite Black shale deposits Calcrete deposits Uranium-rich granites deeply weathered, valley-type Other
Uranium Deposit Types (continued) u Metamorphic deposits • Ore body occurs in a calcium-rich alteration zone within Proterozoic metamoprphic rocks u Quartz-pebble conglomerate deposits • Uranium recovered as a by-product of gold mining u Vein deposits • Spatially related to granite, crosscuts metamorphic or sedimentary rocks (coffinite, pitchblende) u Phosphorite deposits • Fine-grained apatie in phosphorite horizons; mud, shale, carbonates and SS. interbedded u Collapse breccia deposits • Vertical tubular-like deposits filled with coarse and fine fragments u u Lignite Black shale deposits Calcrete deposits Uranium-rich granites deeply weathered, valley-type Other
 Pitchblende (U 2") Some Minerals Associated with Uranium u u u Uraninite (UO 2) Pitchblende (U 2 O 5. UO 3 or U 3 O 8) Carnotite (uranium potassium vanadate) Davidite-brannerite-absite type uranium titanates Euxenite-fergusonite-smarskite group Secondary Minerals: • • Gummite Autunite Saleeite Torbernite Coffinite Uranophane Sklodowskite (Lambert et al. , 1996)
Some Minerals Associated with Uranium u u u Uraninite (UO 2) Pitchblende (U 2 O 5. UO 3 or U 3 O 8) Carnotite (uranium potassium vanadate) Davidite-brannerite-absite type uranium titanates Euxenite-fergusonite-smarskite group Secondary Minerals: • • Gummite Autunite Saleeite Torbernite Coffinite Uranophane Sklodowskite (Lambert et al. , 1996)
 Example of exploring a sandstone Uranium deposit u u When looking for a sandstone-type uranium deposit in an area that has had a radiometric survey, our first place to focus in on the areas where radioactivity appears to be associated with SS. Beds. (We will disregard potassium anomalies, below-threshold readings, unexplained areas, and radioactive “noise”. ) We will then map the radioactive SS. units and other associations with our model of a SS. uranium deposit. We will look for poorly sorted, medium to coarse grained SS. beds that are associated with mudstones or shales. Detailed mapping of outcrops on a smaller scale is now appropriate. Stratigraphic sections can be measured and projected to covered areas. (Peters, 1978)
. Geology in the Field.") References u u u u u Compton, R. R. (1985). Geology in the Field. United States of America and Canada: John Wiley & Sons, Inc. Bernknopf, R. L. , et al. , 1993 Societal Value of Geologic Maps, USGS Circular 1111. Lambert, I. , Mc. Kay, A. , and Miezitis, Y. (1996) Australia's uranium resources: trends, global comparisons and new developments , Bureau of Resource Sciences, Canberra, with their later paper: Australia's Uranium Resources and Production in a World Context, ANA Conference October 2001. http: //www. uic. com. au/nip 34. htm (accessed February 6, 2008). Mc. Lemore, V. T. Geology and Mining of Sediment-Hosted Uranium Deposits: What is Uranium? . Lecture, January 30, 2008; pp. 1 -26. New Mexico Bureau of Geology and Mineral Resources. http: //geoinfo. nmt. edu/publications/maps/home. html (accessed February 1, 2008). Peters, W. C. (1978). Exploration and Mining Geology. United States of America and Canada: John Wiley & Sons, Inc. U. S. Geological Survey (a). http: //ncgmp. usgs. gov/ncgmpgeomaps (accessed February 1, 2008). U. S. Geological Survey (b). http: //id. water. usgs. gov/reference/map_scales. html (accessed February 6, 2008).
References u u u u u Compton, R. R. (1985). Geology in the Field. United States of America and Canada: John Wiley & Sons, Inc. Bernknopf, R. L. , et al. , 1993 Societal Value of Geologic Maps, USGS Circular 1111. Lambert, I. , Mc. Kay, A. , and Miezitis, Y. (1996) Australia's uranium resources: trends, global comparisons and new developments , Bureau of Resource Sciences, Canberra, with their later paper: Australia's Uranium Resources and Production in a World Context, ANA Conference October 2001. http: //www. uic. com. au/nip 34. htm (accessed February 6, 2008). Mc. Lemore, V. T. Geology and Mining of Sediment-Hosted Uranium Deposits: What is Uranium? . Lecture, January 30, 2008; pp. 1 -26. New Mexico Bureau of Geology and Mineral Resources. http: //geoinfo. nmt. edu/publications/maps/home. html (accessed February 1, 2008). Peters, W. C. (1978). Exploration and Mining Geology. United States of America and Canada: John Wiley & Sons, Inc. U. S. Geological Survey (a). http: //ncgmp. usgs. gov/ncgmpgeomaps (accessed February 1, 2008). U. S. Geological Survey (b). http: //id. water. usgs. gov/reference/map_scales. html (accessed February 6, 2008).
 GEOPHYSICAL TECHNIQUES
 Gravity and magnetic exploration Pedram Rostami
 Gravity Techniques Introduction Lateral density changes in the subsurface cause a change in the force of gravity at the surface. u u u The intensity of the force of gravity due to a buried mass difference (concentration or void) is superimposed on the larger force of gravity due to the total mass of the earth. Thus, two components of gravity forces
 Applications u u By very precise measurement of gravity and by careful correction for variations in the larger component due to the whole earth, a gravity survey can sometimes detect natural or man-made voids, variations in the depth to bedrock, and geologic structures of engineering interest. For engineering and environmental applications, the scale of the problem is generally small (targets are often from 1 -10 m in size)
 u u u Gravity surveys are limited by ambiguity and the assumption of homogeneity A distribution of small masses at a shallow depth can produce the same effect as a large mass at depth. External control of the density contrast or the specific geometry is required to resolve ambiguity questions. This external control may be in the form of geologic plausibility, drill-hole information, or measured densities. The first question to ask when considering a gravity survey is “For the current subsurface
 Rock Properties u u u Values for the density of shallow materials are determined from laboratory tests of boring and bag samples. Density estimates may also be obtained from geophysical well logging Table 5 -1 lists the densities of representative rocks. Densities of a specific rock type on a specific site will not have more than a few percent variability as a rule (vuggy limestones being one exception). However, unconsolidated materials such
 Field Work General Up to 50 percent of the work in a microgravity survey is consumed in the surveying. u relative elevations for all stations need to be stablished to ± 1 to 2 cm. A firmly fixed stake or mark should be used to allow the gravity meter reader to recover the exact elevation. u Satellite surveying, GPS, can achieve the required accuracy, especially the vertical accuracy, only with the best equipment under ideal conditions. u
 Field Work General After elevation and position surveying, actual measurement of the gravity readings is often accomplished by one person in areas where solo work is allowed. u t is necessary to improve the precision of the station readings by repetition. u u The most commonly used survey technique is to choose one of the stations as a base and to reoccupy that base periodically throughout the
 Interpretation u u Software packages for the interpretation of gravity data are plentiful and powerful. The geophysicist can then begin varying parameters in order to bring the calculated and observed values closer together.
 Magnetic Methods Introduction u u u The earth possesses a magnetic field caused primarily by sources in the core. The form of the field is roughly the same, as would be caused by a dipole or bar magnet located near the earth’s center and aligned sub parallel to the geographic axis. The intensity of the earth’s field is customarily expressed in S. I. units as nanoteslas (n. T) or in an older unit,
 u u u Many rocks and minerals are weakly magnetic or are magnetized by induction in the earth’s field, and cause spatial perturbations or “anomalies” in the earth’s main field. Man-made objects containing iron or steel are often highly magnetized and locally can cause large anomalies up to several thousands of n. T. Magnetic methods are generally used to map the location and size of ferrous objects. Determination of the applicability of the magnetics method
 Theory u u u The earth’s magnetic field dominates most measurementsz on the surface of the earth. Most materials except for permanent magnets, exhibit an induced magnetic field due to the behavior of the material when the material is in a strong field such as the earth’s. Induced magnetization (sometimes called magnetic polarization) refers to the action of the field on the material wherein the ambient field is enhanced causing the material itself to act as a magnet.
 I=k. F u k = volume magnetic susceptibility (unitless) u I = induced") Theory(continue) I=k. F u k = volume magnetic susceptibility (unitless) u I = induced magnetization per unit volume u F = field intensity in tesla (T) u For most materials k is much less than 1 and, in fact, is usually of the order of 10^-6 for most rock materials. u The most important exception is magnetite whose susceptibility is about 0. 3. From a geologic standpoint, magnetite and its distribution determine the magnetic properties of most rocks. u There are other important magnetic minerals in mining prospecting, but the amount and form of magnetite within a rock determines u
Theory(continue) I=k. F u k = volume magnetic susceptibility (unitless) u I = induced magnetization per unit volume u F = field intensity in tesla (T) u For most materials k is much less than 1 and, in fact, is usually of the order of 10^-6 for most rock materials. u The most important exception is magnetite whose susceptibility is about 0. 3. From a geologic standpoint, magnetite and its distribution determine the magnetic properties of most rocks. u There are other important magnetic minerals in mining prospecting, but the amount and form of magnetite within a rock determines u
 The importance of magnetite cannot be exaggerated. Some tests on rock materials have shown that a rock containing 1 percent magnetite may have a susceptibility as large as 10 -3, or 1, 000 times larger than most rock materials. u Table 6 -1 provides u
 u u Thus it can be seen that in most engineering and environmental") Theory(continue) u u Thus it can be seen that in most engineering and environmental scale investigations, the sedimentary and alluvial sections will not show sufficient contrast such that magnetic measurements will be of use in mapping the geology. However, the presence of ferrous materials in ordinary municipal trash and in most industrial waste does allow the magnetometer to be effective in direct detection of landfills.
Theory(continue) u u Thus it can be seen that in most engineering and environmental scale investigations, the sedimentary and alluvial sections will not show sufficient contrast such that magnetic measurements will be of use in mapping the geology. However, the presence of ferrous materials in ordinary municipal trash and in most industrial waste does allow the magnetometer to be effective in direct detection of landfills.
 Field Work Ground magnetic measurements are usually made with portable instruments at regular intervals along more or less straight and parallel lines which cover the survey area. u Often the interval between measurement locations (stations) along the lines is less than the spacing between lines. u
 u u u The magnetometer is a sensitive instrument which is used to map spatial variations in the earth’s magnetic field. In the proton magnetometer, a magnetic field which is not parallel to the earth’s field is applied to a fluid rich in protons causing them to partly align with this artificial field. When the controlled field is removed, the protons precess toward realignment with the earth’s field at a frequency which depends on the intensity of the earth’s field. By measuring this precession frequency, the total intensity of the field
 u u The incorporation of computers and non-volatile memory in magnetometers has greatly increased the ease of use and data handling capability of magnetometers. The instruments typically will keep track of position, prompt for inputs, and internally store the data for an entire day of work.
 u u To make accurate anomaly maps, temporal changes in the earth’s field during the period of the survey must be considered. Normal changes during a day, sometimes called diurnal drift, are a few tens of n. T but changes of hundreds or thousands of n. T may occur over a few hours during magnetic storms. During severe magnetic storms, which occur infrequently, magnetic surveys should not be made. The
 u u The base-station memory magnetometer, when used, is set up every day prior to collection of the magnetic data. The base station ideally is placed at least 100 m from any large metal objects or travelled roads and at least 500 m from any power lines when feasible.
 u u The value of the magnetic field at the base station must be asserted (usually a value close to its reading on the first day) and each day’s data corrected for the difference between the asserted value and the base value read at the beginning of the day. As the base may vary by 10 -25 n. T or more from day to day, this correction ensures that another person using
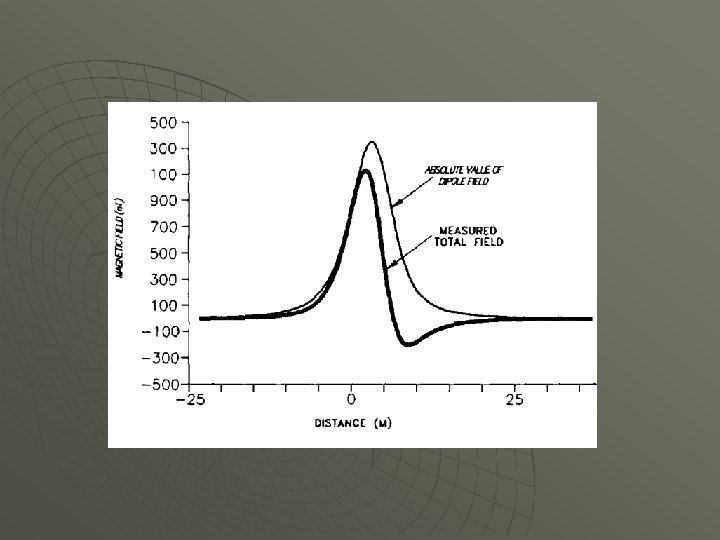
 Interpretation. u u u Total magnetic disturbances or anomalies are highly variable in shape and amplitude; they are almost always asymmetrical, sometimes appear complex even from simple sources One confusing issue is the fact that most magnetometers measure the total field of the earth: no oriented system is recorded for the total field amplitude. The consequence of this fact is that only the component of an anomalous field in the direction of earth’s main field is
 u u Additionally, the induced nature of the measured field makes even large bodies act as dipoles; that is, like a large bar magnet. If the (usual) dipolar nature of the anomalous field is combined with the measurement system that measures only the component in the direction of the earth’s field, the confusing nature of most magnetic
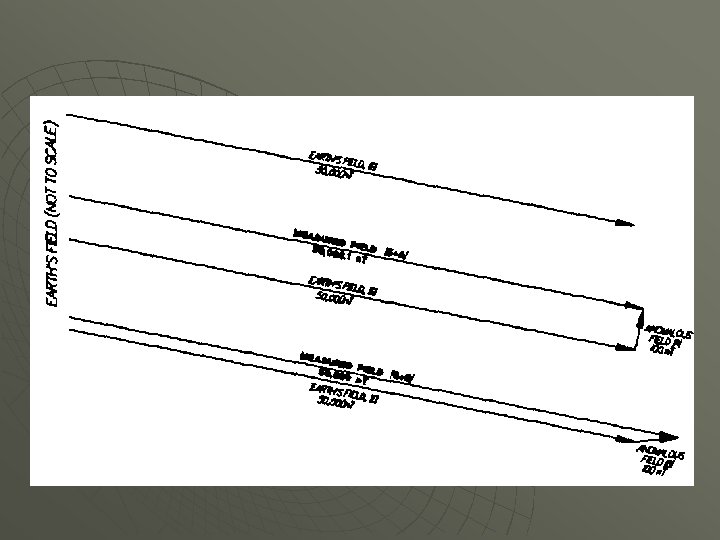
 u To achieve a qualitative understanding of what is occurring, consider Figure in the next page. Within the contiguous United States, the magnetic inclination, that is the angle the main field makes with the surface, varies from 55 - 70 deg. u The figure illustrates the field associated with the main field, the anomalous field induced in a narrow body oriented parallel to that field, and the combined field that will be u
 Uranium Exploration
 anomalies may be defined if high-resolution surveys") Magnetic. Palaeochannel magnetic (either positive or negative) anomalies may be defined if high-resolution surveys are used and if there are sufficient magnetic minerals in the channels or measurable magnetic contrast between the channel sediments and bedrock. u Cainozoic palaeochannels are not u
Magnetic. Palaeochannel magnetic (either positive or negative) anomalies may be defined if high-resolution surveys are used and if there are sufficient magnetic minerals in the channels or measurable magnetic contrast between the channel sediments and bedrock. u Cainozoic palaeochannels are not u
 Gravity u Gravity anomalies in the earth’s gravitational field can in some cases be used to define thickness and extent of the fluvial sediments, and hence palaeochannels, due to the contrast in density between the sediments and fresh bedrock. For example, the density of sand clay is ~1. 8 g/cc and granitic basement is 2. 7 g/cc (Berkman 1995).
") Hoover et al. (1992)
Hoover et al. (1992)
") Hoover et al. (1992)
Hoover et al. (1992)
 GEOCHEMICAL SAMPLING Ground water u Surface water u Stream sediments u Soils u Biological u Ore samples u Radon u Track etch (identify radiaoactivity) u
 Surface Sampling in Exploration u u u u u Introduction Sample? Sampling Programs Bias and Error in Sampling Quality Control Surface Sampling Methods Sample Handling Documentation Requirements Conclusion References
 Introduction Sampling methods vary from simple grab samples on existing exposures to sophisticated drilling methods. u As a rule, the surface of the mineralization is obscured by various types of overburden, or it is weathered and leached to some depth, thereby obscuring the nature of the mineralization. " u
 What is a sample? What is sampling? u u A sample is a finite part of a statistical population whose properties are studied to gain information about the whole (Webster, 1985). Sampling is the act, process, or technique of selecting a suitable sample, or a representative part of a population for the purpose of determining parameters or characteristics of the whole population. u Why Sample?
 check status of land ownership, (2) physical characteristics of area,") Sampling Programs Reconnaissance: (1) check status of land ownership, (2) physical characteristics of area, (3) mining history of the area. u Field inspection: surface grab sampling over all exposures of gravel, few seismic cross section, geobotanical study, and survey for old workings. u Sampling Plan u Special Problems Associated with Sampling: u Sample Processing or Washing: u Data Processing Data processing consists of record keeping, reporting values, and assay procedures. u
Sampling Programs Reconnaissance: (1) check status of land ownership, (2) physical characteristics of area, (3) mining history of the area. u Field inspection: surface grab sampling over all exposures of gravel, few seismic cross section, geobotanical study, and survey for old workings. u Sampling Plan u Special Problems Associated with Sampling: u Sample Processing or Washing: u Data Processing Data processing consists of record keeping, reporting values, and assay procedures. u
 Sampling Plan u u u u Defining the population of concern Specifying a sampling frame, a set of items or events possible to measure Specifying a sampling method for selecting items or events from the frame Determining the sample size Implementing the sampling plan Sampling and data collecting Reviewing the sampling process
 Sample Size u u u The question of how large a sample should be is a difficult one. Sample size can be determined by various constraints such as Cost. nature of the analysis to be performed the desired precision of the estimates one wishes to achieve the kind and number of comparisons that will be made, the number of variables that have to be examined simultaneously
 Bias and Error in Sampling A sample is expected to mirror the population from which it comes, however, there is no guarantee that any sample will be precisely representative of the population from which it comes. biased: u when the selected sample is systematically different to the population. u The sample must be a fair representation of the population we are interested in. Random errors u The sample size may be too small to produce a reliable estimate. There may be variability in the population, the greater u the variability the larger the sample size needed.
 Quality Control u u Responsibility for maintaining consistency and ensuring collection of data of acceptable and verifiable quality through the implementation of a QA/QC program. All personnel involved in data collection activities must have the necessary education, experience, and skills to perform their duties.
 Selecting Methods and Equipment Soil and sediment samples may be collected using a variety of methods and equipment depending on the following: u u u u type of sample required site accessibility, nature of the material, depth of sampling, budget for the project, sample size/volume requirement, project objectives
 Surface Sampling Methods Near-surface samples can be collected with a spade, scoop, or trowel. u Sampling at greater depths or below a water column may require a hand auger, coring device, or dredge. u As the sampling depth increases, the use of a powered device may be necessary to push the sampler into the soil or sediment layers. u
 Sampling Equipments u u u u u Tube Sampler Churn Drills Tube Corers Hand Driven Split-Spoon Core Sampler Hand-Dug Excavations Backhoe Trenches; Bulldozer Trenches Other Machine-Dug Excavations Augers Bucket or Clamshell Type Excavators
. Figure 13. Wet") Surface Sampling Floodplain sampling in southwestern Finland (Photo: Reijo Salminen, GTK). Figure 13. Wet sieving of a stream sediment sample in the UK (Photo: Fiona Fordyce, BGS from Salminen and Tarvainen et al. 1998,
Surface Sampling Floodplain sampling in southwestern Finland (Photo: Reijo Salminen, GTK). Figure 13. Wet sieving of a stream sediment sample in the UK (Photo: Fiona Fordyce, BGS from Salminen and Tarvainen et al. 1998,
 Surface Sampling Figure 16. Humus sampling in Finland using cylindrical sampler, and the final humus sample. (Photographs: Timo Tarvainen, GTK).
 Surface Sampling The soil sample pit at the site 41 E 10 T 3, Finland. The alluvial horizons at the floodplain sediment sampling site 29 E 05 F 3, France.
 Sample Handling u Samples should be preserved to minimize chemical or biological changes from the time of collection to the time of analysis. Keep samples in air tight containers. Sediment samples should also be stored in such a way that the anaerobic condition is preserved by minimizing headspace. u If several sub samples are collected, soil and sediment samples should be placed in a clean stainless steel mixing pan or bowl and thoroughly homogenized to obtain a representative composite
 Sample Handling Sample Label Information – u u u Label or tag each sample container with a unique field identification code. If the samples are core sections, include the sample depth in the identification. Write the project name or project identification number on the label. Write the collection date and time on the label. Attach the label or tag so that it does not contact any portion of the sample that will be removed or poured from the container. Record the unique field identification code on all other documentation associated with the specific sample container. Ensure all necessary information is transmitted to the laboratory.
 Documentation u u Thorough documentation of all field sample collection and processing activities is necessary for proper interpretation of results. All sample identification, chain-ofcustody records, receipts for sample forms, and field records should be recorded using waterproof, non-erasable ink in a bound waterproof notebook. All Procedures must be documented.
 Sample Data u From Sampling to Production Pyramid 3 FLOOR RD R_ MODEL & PRODUCTION 2 ND FLOOR 1 ST FLOOR FOUNDATION CHEMICAL ANALYSIS & GEOLOGICAL INTERPRETATION SAMPLE PREPARATION & GEOLOGICAL CLASSIFICATION SAMPLING & GEOLOGICAL OBSERVATION
 Conclusion u There are many ways to sample and many methods to calculate the value of a deposit. It is important to remember to use care in sampling and to select the method that best suits the type of occurrence that is being sampled.
 References u u u Journal of the Mississippi Academy of Sciences, v. 47, no. 1, p. 42. http: //www. evergladesplan. org/pm/pm_d ocs/qasr_ch_07. pdf http: //www. gtk. fi/publ/foregsatlas/article. php? id=10 http: //www. socialresearchmethods. net/tut orial/Mugo/tutorial. htm http: //www. policyhub. gov. uk/evaluating_ policy/magenta_book/chapter 5. asp
 Thank you
 Radiometric Survey Shantanu Tiwari Mineral Engineering Feb 07, 2008
 Outline 1. 2. 3. 4. 5. 6. 7. Introduction to Radiometric Survey Radioactivity Use of Radiometric Survey Process Case Study Conclusion Refrences
 Introduction 1. Radiometrics : Measure of natural radiation in the Earth’s surface. 2. Also Known as Gamma- Ray Spectrometry (why? ). 3. Who uses it? - Geologists and Geophysicists. 4. Also useful for studying geomorphology and soils.
 Radioactivity 1. Process in which, unstable atom becomes stable through the process of decay of its nucleus. 2. Energy is released in the form of radiation; (a) Alpha Particle (or helium nuclei) - Least Energy- Travels few cm of air. (b) Beta Particle (or electrons)- Higher Energy- Travels upto a meter in air (c) Gamma Rays- Highest Energy- Travels upto 300 meters in air.
 3. Energy of Gamma Ray is characteristic of the radioactive element") Radioactivity (Contd. ) 3. Energy of Gamma Ray is characteristic of the radioactive element it came from. 4. Gamma Rays are stopped by water and other molecules (soil & Rock). 5. A radiometric survey measures the spatial distribution of three radioactive elements; (a) Potassium (b)Thorium (c) Uranium 6. The abundance of these elements are measured by gamma ray detection.
Radioactivity (Contd. ) 3. Energy of Gamma Ray is characteristic of the radioactive element it came from. 4. Gamma Rays are stopped by water and other molecules (soil & Rock). 5. A radiometric survey measures the spatial distribution of three radioactive elements; (a) Potassium (b)Thorium (c) Uranium 6. The abundance of these elements are measured by gamma ray detection.
 Use of Radiometric Survey 1. Radioactive elements occur naturally in some minerals. 2. Energy of Gamma Rays is the characteristic of the element. 3. Measure the energy of Gamma Ray- Abundance.
 Process 1. How we do radiometric survey? - By measuring the energy of Gamma Rays. 2. Can be measure on the ground or by a low flying aircraft. 3. Gamma Rays are detected by Spectrometer. 4. Spectrometer- Counts the number of times each Gamma Ray of particular energy intersects it.
 Process
 Process 5. The energy spectrum measured by a spectrometer is in Me. V. 6. Range- 0 to 3 Me. V. 7. The number of Gamma Ray counts across the whole spectrum is referred as the total count (TC).
 Process Energy of Gamma Rays") Number of Gamma Rays (per second) Process Energy of Gamma Rays
Number of Gamma Rays (per second) Process Energy of Gamma Rays
 Process High Low
- Bear Head Uranium Project- Red Lake Mining Camp(north-west") Case Study Gold Canyon Inc. (USA)- Bear Head Uranium Project- Red Lake Mining Camp(north-west Ontario) Covers a 23 km strike-length of Bear Head Fault Zone 0. 05% U 3 O 8
Case Study Gold Canyon Inc. (USA)- Bear Head Uranium Project- Red Lake Mining Camp(north-west Ontario) Covers a 23 km strike-length of Bear Head Fault Zone 0. 05% U 3 O 8
 Conclusion 1. Good Technique 2. Large Area. 3. Better for plane areas.
 References 1. http: //www. goldcanyon. ca/ 2. Suzanne Haydon from the Geological Survey of Victoria (Aus).
 Thank you
 GROUND GEOPHYSICS
 EXPLORATION TECHNIQUES BY GERTRUDE AYAKWAH METALLURGICAL MINERAL ENGINEERING DEPARTMENT NEW MEXICO INSTITUTE OF MINING AND TECHNOLOGY SAMPLING LEROY PLACE SOCORRO NM February, 7 th, 2008
 Outline Introduction u Purpose u Sampling u Sample Preparation u Types of Metallurgical Sampling a. Geochemical Analysis b. Assay Techniques u Conclusion u References u
 Introduction u u u Exploration geology is the process and science of locating valuable mineral or petroleum which has a commercial value. Mineral deposits of commercial value are called ore bodies The goal of exploration is to prove the existence of an ore body which can be mined at a profit This process occurs in stages, with early stages focusing on gathering surface data which is easier to acquire and later stages focusing on gathering subsurface data which includes drilling data, detailed geophysical survey data and metallurgical analysis
 Purpose The purpose of this presentation is to discuss metallurgical sampling in exploration geology
 Soil and Stream Sample Preparation u u u Samples are reduced and homogenized into a form which can easily be handled by analytical personnel Soil and stream sediment samples are usually sieved so that particles larger than fine sand are removed. The fine particles are mixed and a portion is removed for chemical analysis
 Rock Sample Preparation u Rock samples are treated in a multi-step procedure u Rocks, cuttings, or core are first crushed to about pea-size in a jaw crusher, then passed through a secondary crusher to reduce the size further usually 1/10 inch u This crushed sample is mixed, split in a riffle splitter and reduced to about one-half pound or
 Metallurgical Sampling Types • Geochemical Analysis • Assay Techniques
 Geochemical Analysis u Involves dissolution of approximately one gram of sample by a strong acid u The solution which contains most of the base metals is aspirated into a flame as in atomic absorption spectroscopy (AAS) or into an inductively coupled (ICP) u AAS measures one element at a time to a normal
 u u Whilst ICP 20 measure more elements at a time") Geochemical Analysis (Cont’d) u u Whilst ICP 20 measure more elements at a time to ppm levels The technique is low-cost, rapid, reasonably precise and can be more accurate if the method is controlled by standards. However accuracy is minor importance in geochemistry as the exploration geologist seeks patterns rather than absolute concentration Hence making geochemical analysis methods are considered to be indicators of mineralization rather
Geochemical Analysis (Cont’d) u u Whilst ICP 20 measure more elements at a time to ppm levels The technique is low-cost, rapid, reasonably precise and can be more accurate if the method is controlled by standards. However accuracy is minor importance in geochemistry as the exploration geologist seeks patterns rather than absolute concentration Hence making geochemical analysis methods are considered to be indicators of mineralization rather
 Assay Techniques u Wet Chemistry u Fire Assay u Aqua Regia Acid Digestion
 Assay Techniques Assay procedures uses accurate representation of the mass of the sample being analyzed than in geochemical analytical techniques.
 Wet Chemistry u u u “It's just an informal term referring to chemistry done in a liquid phase. When chemists talk about doing "wet chemistry, " they mean stuff in a lab with solvents, test tubes, beakers, and flasks” (Richard E. Barrans Jr. , Ph. D) It utilizes a physical measurement, either the color of a solution, the weight or volume of a reagent, or the conductivity of a solution after a specific reaction It is a preferred technique to determine element concentration in ore samples
 u Fire Assayin rock or soil It is used to analyzed precious metals Assay ton portion of the sample is put into a crucible and mixed with variety of chemical (lead oxide) u u The mixture is fused at high temperature During fusion, beads of metallic lead are released into the molten mixture u
 Fire Assay u u u The lead particles scavenge the precious metals and sink to the bottom of the crucible due to the difference in density between lead and the siliceous component of the sample known as slag. On completion, the molten mixture is poured into a mold and left to solidify After cooling, the slag is removed from the lead and the lead bottom is transferred into a small crucible known as cupel and placed back into a furnace
 Fire Assay u u The lead is absorbed by the cupel leaving a bead of the precious metals at the bottom of the cupel Gold and silver is measured by weighing the bead on a balance Silver is dissolved in nitric acid and the bead is weighed again to determine the undissolved gold Silver is calculated by the difference
 Aqua Regia Acid Digestion u u u The same procedure is used as in fire assay but different method of measuring gold and silver Atomic absorption is used to measure gold and silver Other forms of measurement include neutron activation analysis and flameless atomic absorption
 Conclusion u u u Geochemical analysis is considered to be indicators of mineralization during the earlier stages of exploration Assay techniques is used to determine absolute measurement of mineralization It also determines if the ore deposit can be processed by conventional milling or in situ leaching or some other way
 References u u u http: //www. alsglobal. com/Mineral/ALSContent. aspx? key=31# metallics http: //www. amebc. ca/primer 3. htm#sampling http: //www. newton. dep. anl. gov/askasci/chem 00868. ht m
 DRILLING
 DRILLING Samuel Nunoo New Mexico Bureau of Geology and Mineral Resources New Mexico Institute of Mining and Technology, Socorro, NM 7 TH FEBRUARY 2008
 Outline u Introduction u Purpose u Types
 Introduction
 • Drilling is the process whereby rigs or hand operated tools are used to make holes to intercept an ore body. • Drilling is the ultimate stage in exploration.
 Purpose
 The purpose of drilling is; • To define ore body at depth • To access ground stability (geotechnical) • To estimate the tonnage and grade of a discovered mineral deposit • To determine absence or presence of ore bodies, veins or other type of mineral deposit
 Types
Types
 Drilling is generally categorized into 2 types: • Percussion Drilling This type of drilling is whereby a hammer beats the surface of the rock, breaks it into chips. -Reverse Circulation Drilling (RC) • Rotary Drilling This is the type of drilling where samples are recovered by rotation of the drill rod without percussion of a hammer. - Diamond Drilling - Rotary Air Blast (RAB) - Auger Drilling
 1. This type of drilling involves the use") Percussion Drilling Reverse Circulation Drilling (RC) 1. This type of drilling involves the use of high pressure compressors, percussion hammers that recover samples even after the water table. 2. The end of the hammer is a tungsten carbide bit that breaks the rock with both percussion and rotary movement. This mostly follows a RAB intercept of an ore body. 3. The air pressure of a RC rig can be increased by the use of a booster. This allows for deeper drilling. 4. Samples are split by special sample splitter that is believed to pulverize the samples. This is done to avoid metal concentrations at only section of the sample. Contamination is checked by cleaning the splitter after every rod change either by brush or high air pressure from rig’s air hose. 5. RC drilling is mostly followed by diamond drilling to confirm some of the RC drilling ore intercept. 6. This type of drilling is faster and cheaper than diamond drilling
Percussion Drilling Reverse Circulation Drilling (RC) 1. This type of drilling involves the use of high pressure compressors, percussion hammers that recover samples even after the water table. 2. The end of the hammer is a tungsten carbide bit that breaks the rock with both percussion and rotary movement. This mostly follows a RAB intercept of an ore body. 3. The air pressure of a RC rig can be increased by the use of a booster. This allows for deeper drilling. 4. Samples are split by special sample splitter that is believed to pulverize the samples. This is done to avoid metal concentrations at only section of the sample. Contamination is checked by cleaning the splitter after every rod change either by brush or high air pressure from rig’s air hose. 5. RC drilling is mostly followed by diamond drilling to confirm some of the RC drilling ore intercept. 6. This type of drilling is faster and cheaper than diamond drilling
 http: //www. midnightsundrilling. com/rev erse_circulation. html reverse_circulation. html
 1. This type of drilling is common") Rotary Drilling Rotary Air Blast Drilling (RAB) 1. This type of drilling is common in green-field exploration and in mining pits. 2. This drilling mostly confirms soil, trench or pit anomalies. 3. It involves an air pressure drilling and ends as soon as it comes into contact with the water table because the hydrostatic pressure is more than the air pressure. 4. Samples cannot be recovered after the water table is reached. 5. Mostly a 4 meter composite sampling is conducted. Every 25 th sample is replicated to check accuracy of the laboratory analysis. 6. RAB drilling in the mine is mostly done for blast holes.
Rotary Drilling Rotary Air Blast Drilling (RAB) 1. This type of drilling is common in green-field exploration and in mining pits. 2. This drilling mostly confirms soil, trench or pit anomalies. 3. It involves an air pressure drilling and ends as soon as it comes into contact with the water table because the hydrostatic pressure is more than the air pressure. 4. Samples cannot be recovered after the water table is reached. 5. Mostly a 4 meter composite sampling is conducted. Every 25 th sample is replicated to check accuracy of the laboratory analysis. 6. RAB drilling in the mine is mostly done for blast holes.
 Diamond Drilling 1. This type of drilling uses a diamond impregnated") Rotary Drilling (Cont’d) Diamond Drilling 1. This type of drilling uses a diamond impregnated bit that cuts the rock by rotation with the aid of slimy chemicals in solution such as; 2. - DD 200, expan-coarse, expan-fine, betonite and sometimes mapac A and B for holes stability. 2. Drill sample are recovered as cores sometimes oriented for the purpose of attitude measurement such as dip and dip directions of joints, foliation, lineation, veins. 3. Sampling involves splitting the core into 2 equal halves along the point of curvature of foliations or along orientation lines. One half is submitted to the lab for analysis and the other left in the core yard for future sampling if necessary. 4. Standards of known assay values are inserted in the samples to check laboratory accuracy. Mostly high grade standards are inserted at portions of low mineralization and low grade standards into portions of high mineralization. 5. Diamond drilling is usually the last stage of exploration or when the structural behavior of an ore body is to be properly understood. http: //www. almadenminerals. com/geoskool/drilling. html http: //en. gtk. fi/Exploration. Finland/images/ritakallio_diamond_drilling. jpg http: //www. istockphoto. com/file_closeup/
Rotary Drilling (Cont’d) Diamond Drilling 1. This type of drilling uses a diamond impregnated bit that cuts the rock by rotation with the aid of slimy chemicals in solution such as; 2. - DD 200, expan-coarse, expan-fine, betonite and sometimes mapac A and B for holes stability. 2. Drill sample are recovered as cores sometimes oriented for the purpose of attitude measurement such as dip and dip directions of joints, foliation, lineation, veins. 3. Sampling involves splitting the core into 2 equal halves along the point of curvature of foliations or along orientation lines. One half is submitted to the lab for analysis and the other left in the core yard for future sampling if necessary. 4. Standards of known assay values are inserted in the samples to check laboratory accuracy. Mostly high grade standards are inserted at portions of low mineralization and low grade standards into portions of high mineralization. 5. Diamond drilling is usually the last stage of exploration or when the structural behavior of an ore body is to be properly understood. http: //www. almadenminerals. com/geoskool/drilling. html http: //en. gtk. fi/Exploration. Finland/images/ritakallio_diamond_drilling. jpg http: //www. istockphoto. com/file_closeup/
 Auger Drilling 1. This is a type of superficial drilling in") Rotary Drilling (Cont’d) Auger Drilling 1. This is a type of superficial drilling in soils and sediments. It could machine powered auger or hand powered (manual). 2. It is mostly conducted at the very initial stage of exploration. That is after streams sediments, soils or laterite sampling. http: //www. geology. sdsu. edu/classes/geol 552/sedsampling. htm
Rotary Drilling (Cont’d) Auger Drilling 1. This is a type of superficial drilling in soils and sediments. It could machine powered auger or hand powered (manual). 2. It is mostly conducted at the very initial stage of exploration. That is after streams sediments, soils or laterite sampling. http: //www. geology. sdsu. edu/classes/geol 552/sedsampling. htm
 Thank You !!!!
 GEOPHYSICAL LOGGING Frederick Ennin Department of Environmental Engineering
 INTRODUCTION u u u Geophysical logging is the use of physical, radiogenic or electromagnetic instruments lowered into a borehole to gather information about the borehole, and about the physical and chemical properties of rock, sediment, and fluids in and near the borehole Logging: “make record” of something First developed for the petroleum industry by Marcel and Conrad Schlumberger in 1972. Schlumberger brothers first developed a resistivity tool to detect differences in the porosity of sandstones of the oilfield at Merkwiller-Perchelbrom, eastern France. Following the first electrical logging tools designed for basic permeability and porosity analysis other logging methods were developed to obtain accurate porosity and permeability calculations and estimations (sonic, density and neutron logs) and also basic geological characterization (natural radioactivity)
 THE BOREHOLE ENVIRONMENT Different physical properties used to characterized the geology surrounding a borehole-drilling Physical properties: porosity of gravel bed, density, sonic velocity and natural gamma signal Drilling can perturb the physical properties of the rock Factors influencing properties of rocks: Porosity and water content Water chemistry Rock chemistry and minerology Degree of rock alteration and mineralisation Amount of evaporites Amount of humic acid Temperature
 APPLICATIONS Became and is a key technology in the petroleum industry. In Mineral industry: Exploration and monitoring grade control in working mines. Ground water exploration: delineation of aquifers and producing zones In regolith studies: provides unique insights into the composition, structure and variability of the subsurface Airborne electromagnetics used for ground truthing airborne geophysical data sets.
 GEOPHYSICAL LOGGING METHODS MECHANICAL METHODS caliper logging sonic logging u ELECTRICAL METHODS resistivity logging conductivity logging spontaneous potential logging induced polarisation u RADIOATIVE METHODS natural gamma rays logging neutron porosity logging u
 MECHANICAL METHODS Caliper logging caliper used to measure the diameter of a borehole and its variability with depth. motion in and out from the borehole wall is recorded electrically and transmitted to surface recording equipment Sonic logging works by transmitting a sound through the rocks of the borehole wall Consists of two parts: transmitter and receivers separated by rubber connector to reduce the amount of direct transmission of acoustic energy along the tool from transmitter to receiver Crosshole Sonic Logging method with various kinds of defects. (Blackhawk Geo. Services, Inc. )
 ELECTRICAL METHODS Used in hard rock drilling Resistivity probes measure voltage drop by passing current through rocks Conductivity measurements induction probes via electromagnetic induction either in filled or dry holes Spontaneous potential (SP) - oldest E-method Measures small potential differences between down hole movable electrode and the surface earth connection Uses wide range of electrochemical and electrokinetic processes Induced polarisation (IP) Commonly used in surface prospecting for minerals and downhole applications. Uses transmitter loop to charge the ground with high current Transmitter loop turned off and voltage change with time is recorded.
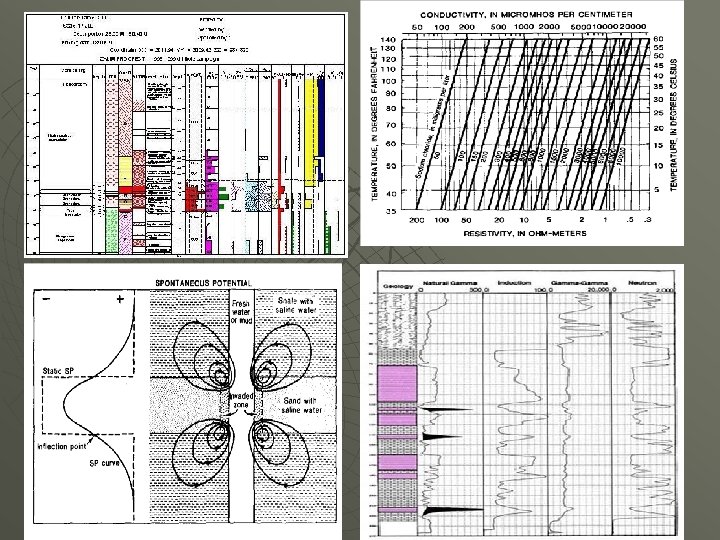
") Natural Gamma logging RADIOATIVE METHODS simplest, high penetration distance through rocks (1 -2 m) Depends on initial energy level and rock density Records levels of naturally occurring gamma rays from rocks around borehole Signals from isotopes: K-40, Th-232, U 238 and daughter products- provides geologic information Sophisticated tools records emission from Bi-214 and Tl-208 instead of U-238 and Th-232 provides detailed chemistry of rocks in borehole Secondary uranium minerals associated with Gulcheru quartzite from Gandi area, Andhra Successfully used to search for roll front uranium deposit in regolith Gamma-ray Borehoole Logging Probe (Lead Shielded)/System for measurement of high-grade ore in borehole
Natural Gamma logging RADIOATIVE METHODS simplest, high penetration distance through rocks (1 -2 m) Depends on initial energy level and rock density Records levels of naturally occurring gamma rays from rocks around borehole Signals from isotopes: K-40, Th-232, U 238 and daughter products- provides geologic information Sophisticated tools records emission from Bi-214 and Tl-208 instead of U-238 and Th-232 provides detailed chemistry of rocks in borehole Secondary uranium minerals associated with Gulcheru quartzite from Gandi area, Andhra Successfully used to search for roll front uranium deposit in regolith Gamma-ray Borehoole Logging Probe (Lead Shielded)/System for measurement of high-grade ore in borehole
 Neutron Porosity Logging u u RADIOATIVE METHODS Measures properties of the rock close to the borehole Very useful tool for measuring “porosity” u free neutrons almost unknown in the Earth Neutron emission source u u u Active source emits into rocks around a borehole Flux of neutrons recorded at the detector is used as indicator of conditions around surrounding rocks. Neutron logging provides data under a variety of conditions in cased and uncased boreholes. .
 RADIOATIVE METHODS Effects: Hydrogen Exception: neutrons rapidly loose energy due to collision with hydrogen nuclei (thermal neutron”-like diffusing gas) u Changes in Diameter of boreholes affects results u Calibrated with limestone samples of differing water-filled porosities (equivalent limestone porosities) u Used in conjunction with other logging methods in mineral geophysical logging in hard rock (lower u
") PROBLEMS AND LIMITATION Problems Biggest is the need for a “well” (ie. a borehole) to operate High cost of drilling meaning boreholes are always not available hence GWL will not be possible for a particular study. Colapse of holes in regolith systems while wireline logs are running solved with foam drilling or plastic casing insertion. Limitations Recognition that each method has weaknesses and strengths. PVC casing- prevents electrical logging & neutron logging (hydrogen)
PROBLEMS AND LIMITATION Problems Biggest is the need for a “well” (ie. a borehole) to operate High cost of drilling meaning boreholes are always not available hence GWL will not be possible for a particular study. Colapse of holes in regolith systems while wireline logs are running solved with foam drilling or plastic casing insertion. Limitations Recognition that each method has weaknesses and strengths. PVC casing- prevents electrical logging & neutron logging (hydrogen)
 CONCLUSIONS u u Geophysical well logging provides many different opportunities to investigate the material making up the wall of a borehole, be it regolith or crystalline rock. A widen range of different sensors provide information which complementary in nature. Best results are obtained by running a suite of logs and analyzing their similarities and differences.
 REFERENCES u u u u Hallenburg, J. K. , 1984. Geophysical logging for mineral and engineering applications. Penn. Well Books, Tulsa, Oklahoma, 254 pp. Keys, W. S. , 1988. Borehole geophysics applied groundwater investigations. U. S Geol. Surv. Open File Report 87 -539, Denver. Mc. Neill, J. D. , Hunter, J. A and Bosnar, M. , 1996. Application of a borehole induction magnetic susceptibility logger to shallow lithological mapping. Journal of Environmental and Engineering Geophysics 2: 77 -90 Schlumberger, 2000. Beginnings. A brief history of Schlumberger wireline and testing, www site: http: //www. 1. slb. com/recr/library/wireline/brochure/beginnings. h tml Sheriff, R. E. , 1991. Encyclopedic Dictionary of Exploration Geophysics, Society of Exploration Geophysicists, Tulsa, Oklahoma, 376 pp. Keys, Scott, Mac. Cary, L. M. , 1971 Application of Borehole Geophysics to Water-Resources Investigations, Techniques of Water-Resources Investigations Book 2, Chapter E 1, http: //pubs. er. usgs. gov/usgspubs/twri 02 E 1 Keys, W. S. , 1990, Techniques of Water-Resources Investigations, Book 2, Chapter E-2, U. S. Geological Survey, http: //pubs. er. usgs. gov/usgspubs/twri 02 E 2
 REFERENCES u u u Stevens, H. H. Jr. , Ficke, J. F. , and Smoot, G. F. , 1976, Techniques of Water. Resources Investigations Book 1, Chapter D 1, Water Temperature—Influential Factors, Field Measurement, and Data Presentation, U. S. Geological Survey, http: //pubs. er. usgs. gov/usgspubs/twri 01 D 1 http: //images. google. com/imgres? imgurl=http: //id. water. usgs. gov/projects/INL/ima ges/therm_1. gif&imgrefurl=http: //id. water. usgs. gov/projects/INL/geophys. html&h=4 72&w=474&sz=11&hl=en&start=13&um=1&tbnid=U 3 z 2 Z 4 Oh. RFxj 5 M: &tbnh=128&tb nw=129&prev=/images%3 Fq%3 DPICTURES%2 BOF%2 BGEOPHYSICAL%2 BLOGGING %26 um%3 D 1%26 hl%3 Den%26 rls%3 Dcom. microsoft: *: IESearch. Box%26 rlz%3 D 1 I 7 GGIC http: //images. google. com/imgres? imgurl=http: //www. nga. com/graphics/Geo_ser_Bo rehole_logging(sketch). gif&imgrefurl=http: //www. nga. com/Geo_ser_Borehole_loggin g_tech. htm&h=292&w=350&sz=11&hl=en&start=1&um=1&tbnid=ynxod 1 Zg. Fgn 3 M: &tbnh=100&tbnw=120&prev=/images%3 Fq%3 DPICTURES%2 BOF%2 BGEOPHYSICAL%2 BLOGGING%26 um%3 D 1%26 hl%3 Den%26 rls%3 Dcom. microsoft: *: IE-Search. Box%26 rlz%3 D 1 I 7 GGIC
 METALURGICAL SAMPLING
, electromagnetic u") Methods u u u u u Magnetic surveys u Electromagnetic (EM, EMI), electromagnetic u sounding u Direct current (DC) u GPR (Ground penetrating u radar potential) Seismic Time-domain u electromagnetic (TEM) u Controlled source audio- u magnetotellurics (CSAMT) u Radiometric surveys u Induced polarization (IP) u Spontaneous potential (SP) Borehole geophysics Satellite imagery Imagery spectrometry ASTER (Advanced spaceborne thermal emissions reflection radiometer) AVIRIS PIMA SFSI LIBS SWIR Multispectral
Methods u u u u u Magnetic surveys u Electromagnetic (EM, EMI), electromagnetic u sounding u Direct current (DC) u GPR (Ground penetrating u radar potential) Seismic Time-domain u electromagnetic (TEM) u Controlled source audio- u magnetotellurics (CSAMT) u Radiometric surveys u Induced polarization (IP) u Spontaneous potential (SP) Borehole geophysics Satellite imagery Imagery spectrometry ASTER (Advanced spaceborne thermal emissions reflection radiometer) AVIRIS PIMA SFSI LIBS SWIR Multispectral
 OTHER TECHNIQUES Fluid inclusion analyses u Stable and radiometric isotopes u Computer modeling u
 STEPS Define uranium deposit model u Select area u Collect and interpret regional data u Define local target area u Field reconnaissance u Reconnaissance drilling u Bracket drilling u Ore discovery u