d9d35531cf581d5b4a91333ef24bb0aa.ppt
- Количество слайдов: 29


Example One CVE-2006 -3747 was identified on web server • Internet is allowed to access the web server through HTTP protocol and port

Exploit post-condition Exploit pre-condition Exploit post-condition

Pre- and Post-conditions can be used in constructing an attack graph web. Server is network-accessible to an attacker The web service is running The vulnerability exists This attack is possible The consequence is that web. Server is compromised
. Firewall/netw ork analyzer")
This process is completely automated What are your threats? attacker. Located(internet). Firewall/netw ork analyzer hacl( internet, web. Server, http. Protocol, http. Port ). hacl( H, H, _, _). Vulnerability scanner network. Service. Info( web. Server, httpd, http. Protocol, http. Port, apache ). vul. Exists( web. Server, cve_apache, httpd ). vul. Property( cve_apache, remote. Exploit, priv. Escalation ). NVD
 : vul. Exists(H, Vul.")
But you do need a knowledge base exec. Code(H, Perm) : vul. Exists(H, Vul. ID, Software, remote. Exploit, priv. Escalation), network. Service. Info(H, Software, Protocol, Port, Perm), net. Access(H, Protocol, Port) The knowledge is completely independent of any site-specific settings.

Combining attack graphs and CVSS • Attack graph presents a qualitative view of security problems – It shows what attacks are possible, but does not tell you how bad the problem is. – It captures the interactions among all attack possibilities in your system. • CVSS provides a quantitative property of individual vulnerabilities – It tells you how bad an individual vulnerability could be. – But it does not tell you how bad it may be in your system.

Our Approach • Use CVSS to produce a component metric --- a numeric measure on the conditional probability of success of an attack step. Suppose an attacker needs c 1 (network access) to launch an attack on the vulnerability, and c 2 (host compromised) is the consequence of a successful attack. the component metric means Pr[c 2 = T|c 1 = T] This measure does not consider any attacker behavior

High => 0. 2 Medium=> 0. 6 Low => 0. 9

Our Approach • Aggregate the probabilities over the attack-graph structure to provide a cumulative metric --- the probability of attacker success in your system. Suppose there is a “dedicated attacker” who will try all possible ways to attack your system. If one path fails, he will try another. The cumulative metric is the probability that he can succeed in at least one path.
![Calculation of the cumulative metrics c 1 Pr[c 1]=? Pr[c 1]=1 c 2 Pr[c](https://present5.com/presentation/d9d35531cf581d5b4a91333ef24bb0aa/image-10.jpg "Calculation of the cumulative metrics c 1 Pr[c 1]=? Pr[c 1]=1 c 2 Pr[c")
Calculation of the cumulative metrics c 1 Pr[c 1]=? Pr[c 1]=1 c 2 Pr[c 2]=0. 2 Pr[c 2]=? Pr[c 2|c 1]=0. 2 Pr[exec. Code(web. Server, apache)]=0. 2

Example Two • Internet is allowed to access the web server through HTTP protocol and port • Web server is allowed to access the My. SQL database service on the dbase server CVE-2006 -3747 was identified on web server CVE-2009 -2446 was identified on db server

Exploit pre-condition Medium=> 0. 6 Exploit post-condition
 0. 2 x 0. 6=0. 12 2: remote exploit")
1: exec. Code(db. Server, root) 0. 2 x 0. 6=0. 12 2: remote exploit of a server program 3: net. Access(db. Server, db. Protocol, db. Port) 4: multi-hop access 5: hacl(web. Server, db. Protocol, db. Port) 6: exec. Code(web. Server, apache) 0. 2 7: remote exploit of a server program 8: net. Access(web. Server, http. Protocol, http. Port) 9: direct network access 10: hacl(internet, web. Server, http. Protocol, http. Port) 11: attacker. Located(internet) 12: network. Service. Info(web. Server, httpd, http. Protocol, http. Port, apache) 13: vul. Exists(web. Server, cve_apache, httpd, remote. Exploit, priv. Escalation) 14: network. Service. Info(db. Server, my. SQL, db. Protocol, db. Port, root) 15: vul. Exists(db. Server, cve_my. SQL, remote. Exploit, priv. Escalation)

Example Three CVE-2006 -3747 was identified on web server CVE-2009 -2446 was identified on db server • Internet is allowed to access the web server through HTTP protocol and port • Web server is allowed to access the My. SQL database service on the db server • User workstations are allowed to access anywhere CVE-2009 -1918 was identified on user workstations

Exploit pre-condition Low=> 0. 9 Exploit post-condition

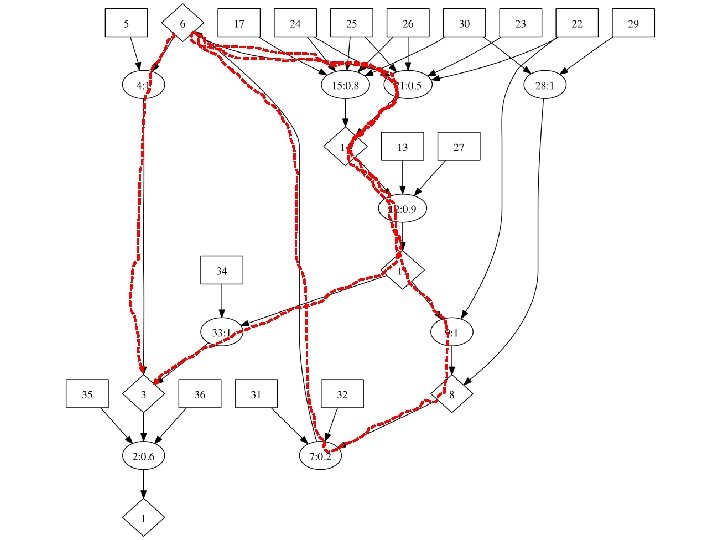
Possible attack paths
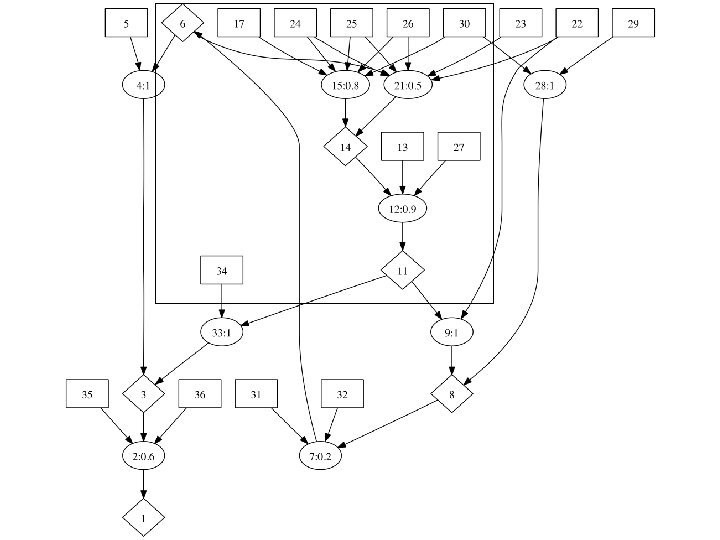
 11: exec. Code(work. Station, normal. Account) 12: remote exploit")
6: exec. Code(web. Server, apache) 11: exec. Code(work. Station, normal. Account) 12: remote exploit of a client program 13: has. Account(secretary, work. Station, norma l. Account) 14: can. Access. Malicious. Input(work. Station, se cretary, internet. Explorer) 15: Browsing a malicious website 17: hacl(work. Station, internet, http. Protocol, htt p. Port) 21: Browsing a compromised website 27: vul. Exists(work. Station, cve_IE, internet. Explorer, remote. Exploit, priv. Escalation) 30: attacker. Located(internet) 34: hacl(work. Station, db. Server, db. Protocol, db. Port) 24: is. User. Machine(work. Station) 25: is. Web. Browser(internet. Explorer) 26: in. Competent(secretary)

Challenge • How to calculate probabilities in an attack graph with shared dependencies and cycles. – Bayesian Network • Frigault, et al. , 2008, does not allow cycles – Assuming independence among attack paths • Wang, et al. , 2008 – Customized data-flow algorithm with dynamic programming • Homer, et al. , 2009
: 0. 47 exec. Code(web. Server, apache): 0. 2 exec.")
Result exec. Code(db. Server, root): 0. 47 exec. Code(web. Server, apache): 0. 2 exec. Code(work. Station, normal. Account): 0. 74 Before: exec. Code(db. Server, root): 0. 12 exec. Code(web. Server, apache): 0. 2

Prioritization • Given three hardening options: – Patching the web server – Patching the db server – Patching the workstation • Which one would you patch first?
: 0. 47 exec.")
Suppose we patch the web server Before: exec. Code(db. Server, root): 0. 47 exec. Code(web. Server, apache): 0. 2 exec. Code(work. Station, normal. Account): 0. 74 After: exec. Code(db. Server, root): 0. 43 exec. Code(web. Server, apache): 0 exec. Code(work. Station, normal. Account): 0. 72
: 0. 47 exec.")
Now let’s patch the db server Before: exec. Code(db. Server, root): 0. 47 exec. Code(web. Server, apache): 0. 2 exec. Code(work. Station, normal. Account): 0. 74 After: exec. Code(db. Server, root): 0 exec. Code(web. Server, apache): 0. 2 exec. Code(work. Station, normal. Account): 0. 74

What if we block network access from Group 2 to Internal? Before: exec. Code(db. Server, root): 0. 47 exec. Code(web. Server, apache): 0. 2 exec. Code(work. Station, normal. Account): 0. 74 After: exec. Code(db. Server, root): 0. 12 exec. Code(web. Server, apache): 0. 2 exec. Code(work. Station, normal. Account): 0. 74
![Optimizing Security Hardening Let Pr[exec. Code(db. Server, root)]=p 1 Pr[exec. Code(web. Server, apache)]=p 2](https://present5.com/presentation/d9d35531cf581d5b4a91333ef24bb0aa/image-26.jpg "Optimizing Security Hardening Let Pr[exec. Code(db. Server, root)]=p 1 Pr[exec. Code(web. Server, apache)]=p 2")
Optimizing Security Hardening Let Pr[exec. Code(db. Server, root)]=p 1 Pr[exec. Code(web. Server, apache)]=p 2 Pr[exec. Code(work. Station, normal. Account)]=p 3 If C 1, C 2, C 3 are the “cost” for the compromise of these three hosts respectively. Then your expected loss will be LE=C 1*p 1+C 2*p 2+C 3*p 3 All the hardening measures H 1, H 2, …Hn have costs as well. If you have a maximum dollar amount H to spend on hardening, and you want to minimize your LE, what would you do?

Challenges • Scalability of metric calculation – Heavily depends on the connectivity of attack graphs – Exponential in the worst case • Imprecise input problem – How sensitive is the outcome to the input component metrics? – Approximation algorithms to trade precision for scalability? • Optimization techniques

Summary • Quantitative security risk metrics are important in making sensible decisions in security hardening – People are already doing it in an ad-hoc way without any scientific basis – We want to transform it from a “black art” to a science

If you cannot measure it, you cannot improve it. ---Lord Kelvin
d9d35531cf581d5b4a91333ef24bb0aa.ppt