585ff4c9d2490ae624d1df0bb2fe7912.ppt
- Количество слайдов: 32


Estimating Water Optical Properties, Water Depth and Bottom Albedo Using High Resolution Satellite Imagery for Coastal Habitat Mapping S. C. Liew#, P. Chen, B. Saengtuksin, C. W. Chang Centre for Remote Imaging, Sensing and Processing National University of Singapore #Corresponding Author (scliew@nus. edu. sg)

World. View-2 High resolution with 8 spectral bands Launched: 8 October 2009 0. 46 m panchromatic 1. 84 m multispectral 8 spectral bands: Band 1: Band 2: Band 3: Band 4: Band 5: Band 6: Band 7: Band 8: Effective wavelength 429. 3 nm (47. 3) 478. 8 nm (54. 3) 547. 5 nm (63. 0) 607. 8 nm (37. 4) 658. 5 nm (57. 4) 723. 5 nm (39. 3) 825. 0 nm (98. 9) 919. 4 nm (99. 6) Bandwidth “Coastal” Blue Green Yellow Red “Red edge” NIR 1 NIR 2

WV 2 Spectral Response Tropical Atmosphere, 4 cm precipitable water Note the high water vapor absorption in band 6 (“red-edge” band), humid tropical atmosphere
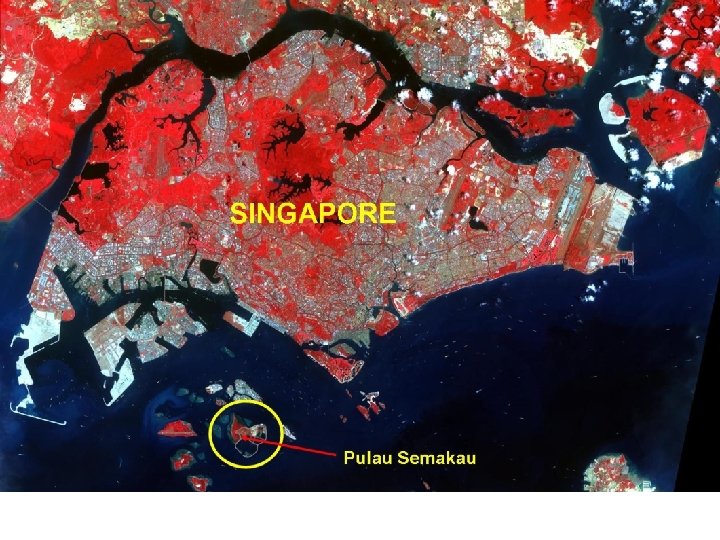

Submerged reefs Seagrass World. View-2 Image Semakau, 2010 -03 -24

• The intertidal zone of Semakau has a rich seagrass habitat of several hundred meters in length. • Such an extensive seagrass habitat is rare in Singapore coastal area. The seagrass habitats in other areas of Singapore mostly occur in patches. • There also live corals on the reefs near Semakau.

seagrass Classification Map Semi-automatic classification Based on 8 -bands WV-2 image and field survey.

Seagrass

Coral rubble with algae/seagrass/coral

Classification of submerged features • The previous classification map shown was obtained by automatic clustering followed by manual editing guided by extensive ground truth observations. • Time consuming, requiring visual interpretation • Visual interpretation complicated by effects of water column – Scattering by suspended particles – Absorption by water and colored dissolved organic matter – Different water depth

• We attempt to retrieve the water depth, bottom albedo and intrinsic optical properties of coastal sea water over submerged areas using a spectral matching algorithm.

Pre-processing of World. View-2 Image • Calibrate to radiance and top-of-atmosphere reflectance • Correct for Rayleigh scattering and gaseous absorptions, integrated over sensor response functions. • Glint subtraction using band 8 (NIR 2) • Convert to subsurface reflectance S. C. Liew, B. Saengtuksin, and L. K. Kwoh, IEEE 2009 International Geoscience and Remote Sensing Symposium (IGARSS'09), 13 - 17 July 2009, Cape Town, South Africa. S. C. Liew and J. He, IEEE Geoscience and Remote Sensing Letters 5(4), 701 -704, 2008.
 Image Note the presence of various surface features")
Band 8 (NIR 2) Image Note the presence of various surface features
 Image Similar surface features are visible")
Band 7 (NIR 1) Image Similar surface features are visible
 after subtracting Band 8 More homogeneous surface")
Band 7 (NIR 1) after subtracting Band 8 More homogeneous surface

Automatic Isodata clustering of submerged pixels into 50 classes Above-water land surface masked out by thresholding the NIR 2 band Mean reflectance spectrum of each class is collected and matched with model reflectance

Shallow water reflectance Deep Water
 from water column Reflection (scattering) from")
Model of Subsurface shallow water reflectance Reflection (scattering) from water column Reflection (scattering) from sea bottom
 = Absorption coefficient bb(l) = Backscattering coefficient g 0, g")
Deep water reflectance a(l) = Absorption coefficient bb(l) = Backscattering coefficient g 0, g 1 = parameters dependent on scattering characteristics of suspended particles

Absorption and Backscattering Models

Sea bottom reflectance is modeled as a linear combination of typical sand vegetation reflectance spectra. sand vegetation (Sea bottom NDVI, corrected for water column effects)

Example of spectral matching: Deep water Class 3: Deep water X = 0. 25 m-1 , G = 0. 096 m-1 P = 0 Water depth set to a large value H = 25 m during spectral fitting (actual value doesn’t matter)

Example of spectral matching: Reef edge Class 6: Fringe of coral reef X = 0. 23 m-1 , G = 0. 019 m-1 P = 0 Rb 547 = 0. 135, Rb 659 = 0. 154, Rb 825 = 0. 282, NDVI = 0. 292 H = 1. 30 m

Example of spectral matching: Submerged reef Class 41: shallow reef X = 0. 26 m-1 , G = 0. 0 m-1 P = 0. 25 m-1 Rb 547 = 0. 226, Rb 659 = 0. 267 , Rb 825 = 0. 365, NDVI = 0. 154 H = 0. 31 m

Example of spectral matching: Submerged seagrass Class 25: submerged seagrass X = 3. 21 m-1 , G = 0. 0 m-1 P = 0 m-1 Rb 547 = 0. 024, Rb 659 = 0. 020, Rb 825 = 0. 155, NDVI = 0. 776 H = 0. 12 m

Water Depth 0 m 0. 5 m 1. 0 m > 1. 5 m
 0 0. 10 0. 20 > 0. 30")
Bottom Albedo (at 547 nm) 0 0. 10 0. 20 > 0. 30
 Detection of submerged aquatic vegetation 1. 0 0. 50")
Vegetation Index (Water column corrected) Detection of submerged aquatic vegetation 1. 0 0. 50 0. 0

Concluding Remarks • We illustrated the application of a spectral matching algorithm in deriving the water depth, bottom albedo, vegetation index (for submerged aquatic vegetation) and water quality parameters from 8 -bands high resolution World. View-2 satellite images. • The satellite derived reflectance spectra can be fitted quite well to the shallow water reflectance model. • The 6 th band (“red-edge” band centered at 723 nm) always has a high deviation from the best fit value for all the classes. This band happens to coincide with a water vapour absorption band.

Concluding Remarks • Eight spectral bands of World. View-2 enable the application of a spectral matching algorithm, but implementation on the full image is not time-efficient. • Computational time efficiency is improved by clustering pixels with similar spectral values, and spectral matching is performed on the average spectrum of each class. • The water column corrected NDVI can serve to detect submerged aquatic vegetation, and to quantify the abundance. • Integrating with classification methods is on-going.
 for funding to CRISP")
Acknowledgment • Singapore Agency for Science, Technology and Research (A*STAR) for funding to CRISP • Singapore National Parks Board (Nparks) for a grant supporting the project. • S. C. Liew acknowledges support of Singapore. Delft Water Alliance (SDWA)

WV 2 Spectral Response
585ff4c9d2490ae624d1df0bb2fe7912.ppt