

a295a0b95a9f7e1422fba45593802ab0.ppt
- Количество слайдов: 90
 es ri nto ve In r 7 te ap t Ch c. 2014 Cengage Learning. All Rights Reserved. May not be copied, scanned, or duplicated, or posted to a publicly accessible website, in whole or in part.
 CH 1 Types of businesses: 1. Manufacturing Business e. g. Ford. 2. Merchandising Business e. g. Debenhams 3. Servicing Business e. g. Saudi Airlines
 CH 6 Inventory: The raw materials, work-in-process goods and completely finished goods that are considered to be the portion of a business's assets that are ready or will be ready for sale
 Why is Inventory Control Important? Important üInventory is a significant asset and for many companies the largest asset. üInventory is central to the main activity of merchandising and manufacturing companies. üMistakes in determining inventory cost can cause critical errors in financial statements.
 Lear ning Obje Desc ctive ribe the i mpo ortan ce of cont over inve rol ntory. 1 c. 2014 Cengage Learning. All Rights Reserved. May not be copied, scanned, or duplicated, or posted to a publicly accessible website, in whole or in part.
 Control of Inventory o Two primary objectives of control over inventory are: Ø Safeguarding the inventory from damage or theft. Ø Reporting inventory in the financial statements.
 Safeguarding Inventory o Controls for safeguarding inventory begin as soon as the inventory is ordered, the following documents are often used for inventory control: o The purchase order authorizes the purchase of the inventory from an approved vendor. o The receiving report establishes an initial record of the receipt of the inventory. o Vendor’s Invoice o Recording inventory using a perpetual inventory system is also an effective means of control. The amount of inventory is always available in the subsidiary inventory ledger.
 Safeguarding Inventory o Controls for safeguarding inventory should include security measures to prevent damage and customer or employee theft. o examples : Ø Storing inventory in areas that are restricted to only authorized employees. Ø Locking high-priced inventory in cabinets. Ø Using two-way mirrors, cameras, security tags, and guards.
 Reporting Inventory o A physical inventory or count of inventory should be taken near year-end to make sure that the quantity of inventory reported in the financial statements is accurate.
 Lear ning Obje Desc ctive ribe assu mpt three inv v i the i ncom ons and entory c how ost fl e sta they o teme impa w nt an ct d ba lance shee t. 2 c. 2014 Cengage Learning. All Rights Reserved. May not be copied, scanned, or duplicated, or posted to a publicly accessible website, in whole or in part.
 INVENTORY COST FLOW ASSUMPTIONS
 Inventory Cost Flow Assumptions Purchased goods 4 3 Under FIFO, the first goods purchased are assumed to be the first goods sold Sold goods 2 1 3 2 1
 Inventory Cost Flow Assumptions Purchased goods Sold goods 3 2 1 1 2 3 Under LIFO, the last goods purchased are assumed to be the first goods sold
 Inventory Cost Flow Assumptions Purchased goods The cost of the units sold and the ending inventory is an average of the purchase costs. 3 2 1 Sold goods
 Inventory Cost Flow Assumptions To illustrate, assume that three identical units of merchandise are purchased during May, as follows:
 Inventory Cost Flow Assumptions o Assume that one unit is sold on May 30 for $20. Depending upon which unit was sold, the gross profit varies from $11 to $6 as shown below:
 Inventory Cost Flow Assumptions o Under the specific identification inventory cost flow method, the unit sold is identified with a specific purchase.
") INVENTORY COST FLOW ASSUMPTIONS (continued)
INVENTORY COST FLOW ASSUMPTIONS (continued)
 inventory cost flow") Inventory Cost Flow Assumptions o Under the first-in, first out (FIFO) inventory cost flow method, the first units purchased are assumed to be sold first and the ending inventory is made up of the most recent purchases. FIFO — Milk (or any perishable item). When shelves are restocked, the “older” milk is moved to the front, and the “newer” milk is placed in back to encourage customers to buy the older milk first.
Inventory Cost Flow Assumptions o Under the first-in, first out (FIFO) inventory cost flow method, the first units purchased are assumed to be sold first and the ending inventory is made up of the most recent purchases. FIFO — Milk (or any perishable item). When shelves are restocked, the “older” milk is moved to the front, and the “newer” milk is placed in back to encourage customers to buy the older milk first.
") INVENTORY COST FLOW ASSUMPTIONS (continued)
INVENTORY COST FLOW ASSUMPTIONS (continued)
 inventory cost flow") Inventory Cost Flow Assumptions o Under the last-in, first out (LIFO) inventory cost flow method, the last units purchased are assumed to be sold first and the ending inventory is made up of the first units purchased. LIFO — Packages of nails or screws at a hardware store. When shelves are restocked, the older packages are slid to the back of the shelf or rack and the newer packages placed in front. Customers buy the newest hardware first.
Inventory Cost Flow Assumptions o Under the last-in, first out (LIFO) inventory cost flow method, the last units purchased are assumed to be sold first and the ending inventory is made up of the first units purchased. LIFO — Packages of nails or screws at a hardware store. When shelves are restocked, the older packages are slid to the back of the shelf or rack and the newer packages placed in front. Customers buy the newest hardware first.
 SUMMAR Y: Method Items Sold Items in Ending Inventory First-in, first-out First items purchased Last-in, first-out Last items purchased First items purchased
") INVENTORY COST FLOW ASSUMPTIONS (concluded)
INVENTORY COST FLOW ASSUMPTIONS (concluded)
 Inventory Cost Flow Assumptions o Under the weighted average inventory cost flow method, the cost of the units sold and in ending inventory is a weighted average of the purchase costs. Average — Gasoline. When new gasoline is delivered to a gas station, it is dumped into the tank with any old gas that has not been sold. Therefore, the customer is buying a mixture of old and new gas.
 Lear ning Obje ctive Dete rmin e the unde cost r the syste of in perp m, u vent sing etua weig ory l inv the F hted ento IFO, aver ry LIFO age , and cost meth ods. 3 c. 2014 Cengage Learning. All Rights Reserved. May not be copied, scanned, or duplicated, or posted to a publicly accessible website, in whole or in part.
 Perpetual Inventory Costs Inventory cost data to demonstrate FIFO and LIFO Perpetual Systems Item 127 B Jan. 1 Inventory 4 Sale Cost of 10 Mdse. Purchase Sold 22 Sale 28 Sale 30 Purchase Units Cost 10 7 8 4 2 10 Price $20 $30 21 31 32 22

 FIFO Perpetual Inventory Account Item 127 B Purchases Date Qty. Unit Cost of Mdse. Sold Total Cost Inventory Balance Total Cost Qty. 10 Qty. Unit Cost 20 200 Jan. 1 The firm begins the year with 10 units of Item 127 B on hand at a total cost of $200. Unit Total Cost
 FIFO Perpetual Inventory Account Inventory cost data to demonstrate FIFO and LIFO Perpetual Systems Item 127 B Jan. 1 Inventory 4 Sale Cost of 10 Mdse. Purchase Sold 22 Sale 28 Sale 30 Purchase Units Cost 10 7 8 4 2 10 Price $20 $30 21 31 32 22 On January 4, 7 units of Item 127 B are sold at $30 each.
 FIFO Perpetual Inventory Account Item 127 B Purchases Qty. Total Cost Inventory Balance Qty. Unit Cost Total Cost Qty. 10 Date Unit Cost of Mdse. Sold 20 7 200 20 Unit Total Cost Jan. 1 4 20 60 The sale of 7 units leaves a balance of 3 units. On January 4, 7 units of Item 127 B are sold at $30 each. 140 3
 FIFO Perpetual Inventory Account Inventory cost data to demonstrate FIFO and LIFO Perpetual Systems Item 127 B Jan. 1 Inventory 4 Sale Cost of 10 Mdse. Purchase Sold 22 Sale 28 Sale 30 Purchase Units Cost 10 7 8 4 2 10 Price $20 $30 21 31 32 22 On January 10, the firm purchased eight units at $21 each.
 FIFO Perpetual Inventory Account Item 127 B Purchases Qty. Total Cost Inventory Balance Qty. Unit Cost Total Cost Qty. 10 Date Unit Cost of Mdse. Sold 20 7 200 20 Unit Total Cost Jan. 1 4 10 20 3 8 8 60 20 21 21 60 168 140 Because the purchase price of $21 is different than the cost of the previous 3 units on hand, the inventory balance of 11 units is accounted for separately. On January 10, the firm purchased eight units at $21 each. 3
 FIFO Perpetual Inventory Account Inventory cost data to demonstrate FIFO and LIFO Perpetual Systems Item 127 B Jan. 1 Inventory 4 Sale Cost of 10 Mdse. Purchase Sold 22 Sale 28 Sale 30 Purchase Units Cost 10 7 8 4 2 10 Price $20 $30 21 31 32 22 On January 22, the firm sold four units for $31 each.
 FIFO Perpetual Inventory Account Item 127 B Purchases Cost of Mdse. Sold On January 22, the Unit Total firm sold four units Date Qty. Cost Qty. for $31 each. Jan. 1 Inventory Balance 8 60 20 21 21 21 60 168 21 Total Cost Qty. 10 4 10 20 3 8 22 1 Unit Cost 20 7 200 20 140 3 20 60 168 7 21 Unit Total Cost 147 Of the four units sold, three are from the first units in (fifo) at a cost of $20. 3
 FIFO Perpetual Inventory Account Inventory cost data to demonstrate FIFO and LIFO Perpetual Systems Item 127 B Jan. 1 Inventory 4 Sale Cost of 10 Mdse. Purchase Sold 22 Sale 28 Sale 30 Purchase Units Cost 10 7 8 4 2 10 Price $20 $30 21 31 32 22 On January 28, the firm sold two units at $32.
 FIFO Perpetual Inventory Account Item 127 B Purchases Total Cost Qty. 20 7 200 20 140 3 Qty. Unit Cost 20 60 2 Qty. Total Cost Inventory Balance 10 Date Unit Cost of Mdse. Sold Unit Total Cost 21 42 Jan. 1 4 10 20 3 8 22 1 28 21 8 60 20 21 21 21 60 168 21 168 7 21 105 On January 28, the firm sold two units at 3 147 5
 FIFO Perpetual Inventory Account Inventory cost data to demonstrate FIFO and LIFO Perpetual Systems Item 127 B Jan. 1 Inventory 4 Sale Cost of 10 Mdse. Purchase Sold 22 Sale 28 Sale 30 Purchase Units Cost 10 7 8 4 2 10 Price $20 $30 21 31 32 22 On January 30, purchased ten additional units of Item 127 B at $22 each.
 FIFO Perpetual Inventory Account Item 127 B Purchases Date Jan. 1 Qty. Unit Cost of Mdse. Sold Total Cost On January 30, 10 8 purchased ten additional 21 168 60 20 60 units of Item 127 B at $22 21 168 each. 21 21 21 7 147 4 10 20 3 8 22 1 28 21 105 30 10 5 21 10 Totals 22 18 22 105 220 Total Cost Qty. 20 7 200 20 140 3 20 60 2 Qty. Unit Cost Inventory Balance Unit Total Cost 21 42 $263 15 3 5 220 $388 13 $325
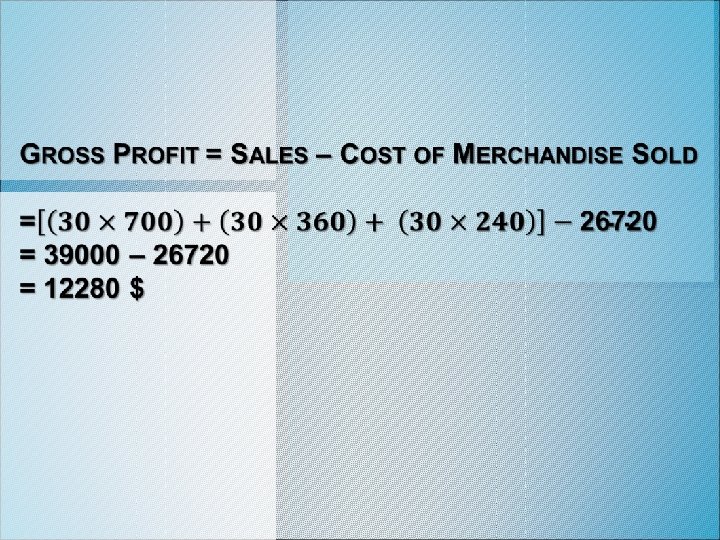
 LG 4 FIFO CMS: INCOME STATEMENT SOLD JAN UNITS COST TOTAL 4 7 20 $140 22 3 20 60 1 21 21 28 2 21 42 31 CMS $263 I/S 39
 LG 4 FIFO INVENTORY: BALANCE SHEET Ending Inventory COST TOTAL 5 21 $105 10 22 220 15 $325 B/S 40
 LG 3 EXERCISE Ending inventory is 11 units. 1/1 Inventory 2/4 Purchase 7/20 Purchase 12/30 Purchase Calculate the cost of ending inventory using FIFO. 6 units @ $28 12 units @ $30 14 units @ $32 8 units @ $33 = $360 41

 LIFO Perpetual Inventory Account Item 127 B Purchases Date Qty. Unit Cost of Mdse. Sold Total Cost Inventory Balance Total Cost Qty. 10 Qty. Unit Cost 20 200 Jan. 1 The firm begins the year with 10 units of Item 127 B on hand at a total cost of $200. Unit Total Cost
 LIFO Perpetual Inventory Account Item 127 B Purchases Date Jan. 1 4 20 Qty. Unit Cost of Mdse. Sold Total Cost Qty. Unit Cost 10 Inventory Balance Total Cost 207 60 On January 4, the firm sold 7 units at $30 each. Qty. 200 20 Unit Total Cost 140 3
 LIFO Perpetual Inventory Account Item 127 B Purchases Date Qty. Jan. 1 4 10 20 8 60 3 20 8 21 Unit Cost of Mdse. Sold Total Cost Qty. Unit Cost Total Cost 10 21 60 168 Inventory Balance 207 Qty. 200 20 Unit Total Cost 140 168 On January 10, the firm purchased eight units at $21 each. Note that a new layer is formed. 3
 LIFO Perpetual Inventory Account Item 127 B Purchases Date Jan. 1 4 20 10 3 8 22 20 Qty. Unit Cost of Mdse. Sold Total Cost Qty. Unit Cost 10 8 60 20 21 60 168 Inventory Balance Total Cost Qty. Unit Total Cost 207 200 20 140 3 4 21 84 3 168 On January sold, Of the 4 units 22, 4 all come 84 21 the firm sells most recent from the four units at $31 at a cost of $21 purchase each.
 LIFO Perpetual Inventory Account Item 127 B Purchases Date Jan. 1 4 20 10 3 8 22 20 28 20 Qty. Unit Cost of Mdse. Sold Total Cost Qty. Unit Cost 10 8 60 20 21 60 60 21 60 168 Inventory Balance Total Cost Qty. Unit Total Cost 207 200 20 140 3 4 21 84 3 2 21 21 84 42 3 168 4 2 21 On January 28, sold two units at $32 each. 42
 LIFO Perpetual Inventory Account Item 127 B Purchases Date Jan. 1 4 20 10 3 8 22 20 28 20 30 3 Qty. Unit Cost of Mdse. Sold Total Cost Qty. Unit Cost 10 8 60 20 21 60 60 10 20 Inventory Balance Total Cost Qty. Unit Total Cost 22 60 20 140 3 4 21 84 3 2 21 21 84 42 3 4 21 60 168 207 2 21 42 168 220 On January 30, purchase 10 units at $22
 LIFO Perpetual Inventory Account Item 127 B Purchases Date Jan. 1 4 20 10 3 8 22 20 28 20 30 3 Totals Qty. Unit Cost of Mdse. Sold Total Cost Qty. Unit Cost 10 8 60 20 21 60 60 10 20 18 Inventory Balance Total Cost Qty. Unit Total Cost 22 60 20 140 3 4 21 84 3 2 21 21 84 42 3 4 21 60 168 207 2 21 42 2 21 $266 42 15 168 220 $388 13 $322
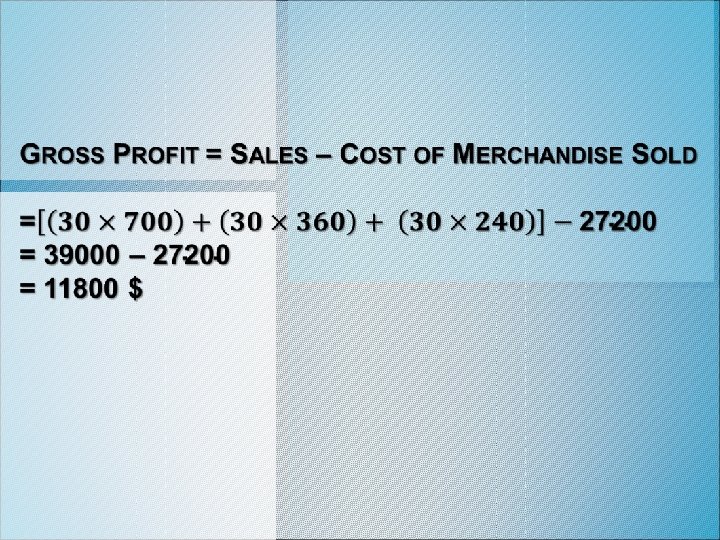
 LG 4 LIFO CMS: INCOME STATEMENT SOLD JAN UNITS COST TOTAL 4 7 20 $140 2 4 21 84 28 31 2 CMS 21 42 $266 I/S 50
 LG 4 LIFO INVENTORY: BALANCE SHEET Ending Inventory COST TOTAL 3 20 $60 2 21 42 10 22 220 15 $322 B/S 51
 LG 3 EXERCISE Ending inventory is 11 units. 1/1 Inventory 2/4 Purchase 7/20 Purchase 12/30 Purchase Calculate the cost of ending inventory using LIFO. 6 units @ $28 12 units @ $30 14 units @ $32 8 units @ $33 = $318 52
 Average Cost method Cost of Merchandise Available for Sale Units Available for Sale = Average Unit Cost With Average cost, an average unit cost for each item is computed each time a purchase is made.
 Average cost-Perpetual Inventory Account Item 127 B Purchases Date Qty. Unit Cost Jan. 1 4 20 10 8 60 21 11 20. 7 228 22 28 20. 7 103. 5 30 10 22 15 21. 6 323. 6 Totals 18 Cost of Mdse. Sold Total Cost Qty. Unit Cost Inventory Balance Total Cost 10 Unit Total Cost Qty. 207 200 20 140 3 168 4 2 20. 7 83 7 20. 7 41. 45 145 5 220 $388 13 $265 15 $323
 Inventory Costing Methods o For purposes of illustration, the data for Item 127 B are used, as shown below. We will examine the perpetual inventory system first.
") FIRST-IN, FIRSTOUT METHOD (continued)
FIRST-IN, FIRSTOUT METHOD (continued)
") FIRST-IN, FIRSTOUT METHOD (continued)
FIRST-IN, FIRSTOUT METHOD (continued)
") FIRST-IN, FIRSTOUT METHOD (continued)
FIRST-IN, FIRSTOUT METHOD (continued)
") FIRST-IN, FIRSTOUT METHOD (continued)
FIRST-IN, FIRSTOUT METHOD (continued)
") FIRST-IN, FIRSTOUT METHOD (continued)
FIRST-IN, FIRSTOUT METHOD (continued)
") FIRST-IN, FIRSTOUT METHOD (continued)
FIRST-IN, FIRSTOUT METHOD (continued)
") FIRST-IN, FIRSTOUT METHOD (continued)
FIRST-IN, FIRSTOUT METHOD (continued)
") LAST-IN, FIRSTOUT METHOD (continued)
LAST-IN, FIRSTOUT METHOD (continued)
") LAST-IN, FIRSTOUT METHOD (continued)
LAST-IN, FIRSTOUT METHOD (continued)
") LAST-IN, FIRSTOUT METHOD (continued)
LAST-IN, FIRSTOUT METHOD (continued)
") LAST-IN, FIRSTOUT METHOD (continued)
LAST-IN, FIRSTOUT METHOD (continued)
") LAST-IN, FIRSTOUT METHOD (continued)
LAST-IN, FIRSTOUT METHOD (continued)
 LAST-IN, FIRSTOUT METHOD
") LAST-IN, FIRSTOUT METHOD (continued)
LAST-IN, FIRSTOUT METHOD (continued)
 Weighted Average Cost Method o When the weighted average cost method is used in a perpetual system, an average unit cost for each item is computed each time a purchase is made. o This unit cost is then used to determine the cost of each sale until another purchase is made and a new average is computed. This averaging technique is called a moving average.
 WEIGHTED AVERAGE COST METHOD

 Lear ning Obje Com ctive pare three and con tr rast t inve he u ntory se of costi the ng m etho ds. 5 ONLY c. 2014 Cengage Learning. All Rights Reserved. May not be copied, scanned, or duplicated, or posted to a publicly accessible website, in whole or in part.
 COMPARING INVENTORY COST METHODS Inflation Deflation
 Comparing Inventory Cost Methods o When the FIFO method is used during a period of inflation or rising prices, FIFO will show a larger profit than the other two inventory costing methods.
 Comparing Inventory Cost Methods o When the LIFO method is used during a period of inflation or rising prices, LIFO will show a lower profit than the other two inventory costing methods. o During a period of rising prices, using LIFO offers an income tax savings compared to the other two inventory costing methods.
 Comparing Inventory Cost Methods o The weighted average cost method of inventory costing is a compromise between FIFO and LIFO. Net income for the weighted average cost method is somewhere between the net incomes of LIFO and FIFO.
 Lear ning Obje ctive D repo rting escribe g of m a erch nd illustr andi in th se in ate the e fin vent ancia ory l stat eme nts. 6 c. 2014 Cengage Learning. All Rights Reserved. May not be copied, scanned, or duplicated, or posted to a publicly accessible website, in whole or in part.
 Reporting Merchandise Inventory o Cost is the primary basis for valuing and reporting inventories in the financial statements. However, inventory may be valued at other than cost in the following cases: Ø The cost of replacing items in inventory is below the recorded cost. Ø The inventory cannot be sold at normal prices due to imperfections, style changes, or other causes.
 Valuation at Lower of Cost or Market o Market, as used in lower-of-cost-or-market method, is the cost to replace the merchandise on the inventory date.
 Valuation at Lower of Cost or Market o Cost and replacement cost can be determined for the following: Ø Each item in the inventory. Ø Each major class or category of inventory. Ø Total inventory as a whole.
 VALUATION AT LOWER OF COST OR MARKET > < The market decline based on individual items ($15, 520 – $15, 070) = $450
 Valuation at Net Realizable Value o Merchandise that is out of date, spoiled, or damaged should be written down to its net realizable value. This is the estimated selling price less any direct costs of disposal, such as sales commissions or special advertising.
 Valuation at Net Realizable Value o Assume the following data about an item of damaged merchandise: Original cost Estimated selling price Selling expenses $1, 000 800 150 o The merchandise should be valued at its net realizable value of $650 ($800 – $150).
 Merchandise Inventory on the Balance Sheet o Merchandise inventory is usually presented in the Current Assets section of the balance sheet, following receivables. o The method of determining the cost of the inventory (FIFO, LIFO, or weighted average) and the method of valuing the inventory (cost or the lower of cost or market) should be shown.
 MERCHANDISE INVENTORY ON THE BALANCE SHEET
 H. W: PE 7 -1 A PE 7 -1 B PE 7 -2 A PE 7 -2 B PE 7 -3 A PE 7 -3 B PE 7 -5 A PE 7 -5 B EX 7 -3 EX 7 -4 + more WAC exercises from E 25
 es ri nto d ve In En he T c. 2014 Cengage Learning. All Rights Reserved. May not be copied, scanned, or duplicated, or posted to a publicly accessible website, in whole or in part.