

c8484488f0176d217cede183a7cdc0a0.ppt
- Количество слайдов: 32
 Energy Use – Past, Present, Future
 Pollen Records C = Cereals, Shading = Woodland clearing © A New History of the Isle of Man Vol 1
 In the beginning… Celtic Round House
 noted, “I could") A History of the Isle of Man, AW Moore Blundell (1648) noted, “I could not observe one tree to be in any place but what grew in gardens – there is so great scarcity even of birch, as that the mercers in Man…when they come into England for other commodities, they buy up our birch brooms, and of them they make rods and sell them to parents to correct their children, and schoolmen to discipline their scholars. ”
A History of the Isle of Man, AW Moore Blundell (1648) noted, “I could not observe one tree to be in any place but what grew in gardens – there is so great scarcity even of birch, as that the mercers in Man…when they come into England for other commodities, they buy up our birch brooms, and of them they make rods and sell them to parents to correct their children, and schoolmen to discipline their scholars. ”
 Early Tree Legislation • 1629 “Anyone who cuts down trees, except on his own ground, should be fined 10 shillings” • 1667 “Anyone committing the same offence must plant five or ten trees, according to whether it was the first or second offence, for each tree cut by him. ” • Fines and imprisonment on this account were also imposed by the Acts of 1753, 1758 and 1817.
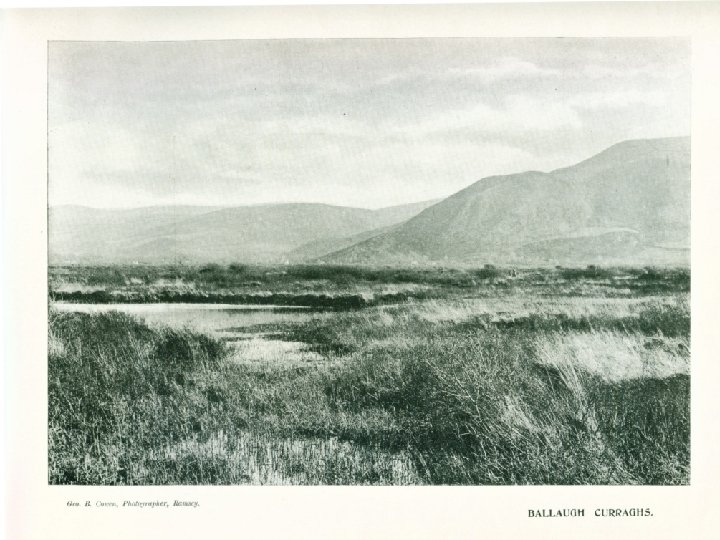
 19/20 C Curraghs Alfred Heaton Cooper Watercolour, Ballaugh Curragh published 1909 Left: Turf cutting, Ballaugh Curragh, 1880 -1890. Near Quarry Bends (? )
 1945 and recent Aerial Photo’s
 Last Remaining Turbary Plot Beinn-y-Phott
 Peak Cutting Plots 24 -30 cartloads for a cottage 40 for a farmhouse
 Glen Helen ~1880 Photographs of Glen Helen Note how young trees are
 Groudle Glen, aka Fern Glen Groudle Glen ~1893
 © F. Coakley , 2005
 Veteran Trees Block Eary Valley above the Corrany
 © MNH
© MNH
 Laxey lades Lade at Ballacowle Farm R Lade from Snaefell Mine to dam above Agneash
 Schematic of Water Use at Laxey Mines
 Laxey Wheel – 1880 Turbine
 Cronkbourne
 Cronkbourne Interior of Clucas's Laundry c. 1913 © Manx Notebook, F Coakley
 Towns Gas Initially for street lighting, then home supply • Produced in Douglas, Castletown, Port St Mary, Ramsey and Peel • Each made gas from coal • Coal gas generation finally ceased 1971 when Port St Mary closed. • UK changed to natural gas in 1970’s • IOM Supply changed to LPG/Air mixture
 Frankenstein’s Factory - Laxey • Mercury Arc Rectifier-1935 • Needed by MER when connected to Public supply • Converts AC current from the Island's supply to the DC current needed by the railway • Prior to this MER had Power Stations at Derby Castle, Laxey, Bungalow and Ballaglass. © Manx Heritage Foundation
 IOM Power Stations Late 19 th Century – private generation, eg MER. 1923 N Quay Oil PS (to 1951) – 250 k. W 1929 Pulrose Coal PS (to 1970) – Heavy Fuel Oil generation at Peel (1950) and Douglas (1959) Later changes were to convert to Diesel Most recent changes have been to connect to Nat Gas, and add Energy from Waste plant • Current Generation Capacity >180 MW (720 times 1923 level) • • •
 Pulrose Power Station, ~1933
 Observed Trends Domestic: v Domestic energy consumption has increased gradually along with the rise in the number of households. v According to the House Condition Survey (2007/2008), there have been significant improvements in domestic energy efficiency between 2002 and 2008. v Considerable scope still exists for insulation improvements including loft and wall insulation and draught-proofing. Government: v Energy use by the Government sector has increased significantly, however has recently started to level off. v Energy usage peaked in 2005/2006 reaching 171 GWh, however dropped to 164 GWh in 2008/2009. v Principal reason for growth in energy usage has been the growth in infrastructure and building ownership under Government, therefore increasing demand by Government estates. v Net government emissions are down 16. 5% since 2004/5 Commercial v Between 1996 and 2005 energy usage increased by nearly 100 GWh v Energy demand expected to remain stable for next few years, then expected to increase as the DTI will be targeting industry much more intensely, including attending some major industry trade shows to promote the Island as a base for businesses, including Clean Tech as a business sector
 Electricity Apportionment Isle of Man UK Gas Coal Nuclear Renewables Imports Oil Other CO 2 Emissions = 0. 43 kg. CO 2/k. Wh 17% cleaner than UK Grid C 02 Emissions = 0. 52 kg. CO 2/k. Wh (DUKES 2009)
 Offshore Wind Small") Cost Resource – Total Electricity Onshore Wind Anaerobic Digestion CHP (non-domestic) Offshore Wind Small Wind – public sector Small Hydro Cost of Electricity (£/GWh) Solar PV Micro CHP Small wind – domestic Tidal lagoons Wave Energy Effic, domestic Annual Electricity Production (GWh/y) A way to compare a range of options and their relative costs and outputs Current IOM Electricity demand ~400 GWh/y
Cost Resource – Total Electricity Onshore Wind Anaerobic Digestion CHP (non-domestic) Offshore Wind Small Wind – public sector Small Hydro Cost of Electricity (£/GWh) Solar PV Micro CHP Small wind – domestic Tidal lagoons Wave Energy Effic, domestic Annual Electricity Production (GWh/y) A way to compare a range of options and their relative costs and outputs Current IOM Electricity demand ~400 GWh/y
 Cost Resource – Total Heat Biomass – Large Boilers Biomass – Domestic Heat Pumps Solar Hot Water Energy Effic Commercial Cost of Heat (£/GWh) Energy Effic Domestic Annual Heat Production (GWH/y) Contributions and costs of range of Renewable Heat technologies Total IOM Gas Space heating need is ~1000 GWh/y
 Woodchip • DEFA Plantations cover 3, 000 hectares • This could supply over 10, 000 tonnes of woodchip each year • Cost effective and fully sustainable DEFA HQ Woodchip Boiler
 Take Home Messages • Mans arrival has significantly changed the landscape of IOM, from a heavily wooded landscape. • No local coal meant other sources of energy were used in its place: wood and peat, and later water • In recent decades nearly all householders have had huge lifestyle improvements – fridge, central heating, cars , foreign holidays • We now import nearly all the energy to meet our energy needs, but there a range of options to become more self-sufficient again