b3102d3a470264ec2e9d91cf3af2647d.ppt
- Количество слайдов: 152
 Emission Reduction Planning Mr Shri Prakash & Dr Ritu Mathur TERI June 19, 2013 1
 Outline • Relevance of Mitigation Assessment & Planning – Climate Change & Mitigation – Is Mitigation need driven by climate change considerations alone? • Integrating national priorities with mitigation : Energy security, efficiency, local environment & resource protection as key sustainable development considerations for developing countries – Principles, Mechanisms, Options • Mitigation options & priorities across countries – Mitigation options for India – Mitigation options in other countries • Malaysia : Case study for 40% emission intensity reduction in Malaysia 2
 Relevance of mitigation assessment & planning The Climate Change Dimension 3
 Human Induced Climate Change
 Ranges for Predicted Surface Warming Source: IPCC, 2007
 Climate Change is Unequivocal Rising atmospheric temperature Rising sea level Reductions in NH snow cover

 People at Risk Globally from Coastal Flooding Blue bars: number of people at risk without sea-level rise (only socio-economic reasons) Purple bars: number of people at risk with sea-level rise Source: IPCC, 2007
 Global Distribution of Vulnerability (with current adaptive capacity ) Source: IPCC, 2007
 Expected Impacts on Poor Regions due to Climate Variability and Change • People exposed to increased water stress by 2020: – 120 million to 1. 2 billion in Asia – 12 to 81 million in Latin America – 75 to 250 million in Africa • Possible yield reduction in agriculture: – 30% by 2050 in Central and South Asia – 30% by 2080 in Latin America – 50% by 2020 in some African countries • Crop revenues could fall by 90% by 2100 in Africa Source: IPCC, 2007
 Source: IPCC, 2007
 Global Anthropogenic GHG Emissions in 2004 Source: IPCC, 2007 CO 2 from fossil fuel is the largest contributor to GHG emissions
 Addressing Climate Change • Adaptation: The adjustment in natural or human systems in response to actual or expected climatic stimuli or their effects, which moderates harm or exploits beneficial opportunities • Mitigation: A human intervention to reduce the sources of, or enhance the sinks of greenhouse gases Source: Third assessment report of IPCC
 Long-Term Stabilization Profiles across Scenarios A 2 B 1 Source: IPCC, 2007
 Equity Issues in Climate are Multi. Dimensional • Issues of international & intra-national equity: – At what level should GHG be stabilized? – How should mitigation costs be distributed? • Issues of inter-generational equity: – How much cost to incur to limit risks and costs to future generations?
 Cumulative CO 2 Emissions (1850 -2002) Distribution of Regional Per Capita GHG Emissions (2004) The percentages in the bars indicate a region’s share in global GHG emissions Wide disparity across the world
 Equity Issue- Mitigation • Need for equitable sharing of responsibility to reduce greenhouse gas emissions among nations • Highly unequal distribution of past, present and projected future emissions among them • Common but differentiated responsibility • Transition to a low-carbon economy is necessary for all • Access to affordable energy services for the poor for poverty reduction
 Are mitigation needs driven by climate change considerations alone? - The development debate - energy security, efficiency, local envt considerations 18
 Development Issues are Closely Linked to Climate Change • Common driving factors, such as, economic growth, urbanization, investments, technological change • Vulnerability reduction and welfare enhancement (including basic human needs, equity and justice) are important for both • Natural resources and environmental impacts. • Alternative development pathways could influence GHG emissions considerably • Integrated view on development goals (millennium and national) and climate change • Institutional issues
 The Development Challenge & Energy Consumption The Human Development Index (HDI) is an index combining normalized measures of life expectancy, literacy, educational attainment, and GDP per capita - correlated with electricity
 Economic & social indicators for developing Asia Table 1. Economic and social indicators for developing Asia in context. Source: World Bank (2011), IEA 2011 a, CIA 2011. Notes: GDP is Gross Domestic Product, adjusted for purchasing power parity and measured in international dollars (see World Bank 2011 for further details). All data is current unless other-wise specified. GDP growth projections originate from the International Monetary Fund are adapted from IEA (2011 a). ‘% population <$2 a day’ indicates the percentage of a country’s population estimated to live off $2 dollars a day, adjusted for purchasing power parity. 21
 Food for a Week, Darfur Refugees, Chad © 2007 PETER MENZEL PHOTOGRAPHY
 Food for a Week, Germany © 2005 PETER MENZEL PHOTOGRAPHY
 UN Millennium Development Goals Agreed by 189 countries in 2000 to be achieved by 2015! www. betterbytheyear. org
 Summary of indicators for CO 2 emissions & energy Source: IEA (2011 a). Notes: All emissions figures are for energy-related emissions only. Mtoe refers to million tonnes of oil equivalent. k. Wh refers to kilowatt-hour. Projections are for the ‘New Policies Scenario’ from the IEA’s World Energy Outlook 2011. For further details see Box 3. *OECD Asia Oceania reports aggregate data for Japan, 25 Australia, Korea, and New Zealand.
 Increase in Energy Needs – an Inevitability ! • Economic growth and development goals • Provision of adequate and equitable access to basic amenities and services • Daily need of energy services – Cooking, – Lighting, – Space cooling, heating, etc Implying massive increase in energy requirements
 Energy import dependency of Asian economies 100% 0% 1980 2008 27
 World Energy prices: Volatile & rising Source: Howes and Dobes (2011), Data is quarterly 28
 Air Pollution, Deforestation & Land degradation Notes: The 230 Asian cities referred to in rows 1 and 2 are from China, India, Indonesia, Thailand, Malaysia, Phillipines, South Korea, and Taiwan. See CAI (2010) for further details. PM 10 refers to particulate matter <10 29 μm in diameter. SO 2 refers to sulphur dioxide, the principal cause of acid rain.
 Challenges for Energy Sector • Energy Security – Need for fuel supply diversification; efficiency improvements; harness opportunities for tapping co-benefits • Reducing GHGs from energy use: – Linked to all mitigation efforts on energy efficiency conservation; fuel substitution • Providing universal access to modern forms of energy services: Clean and sustainable – Focus on individual energy security that links directly with poverty – basically linked to progress towards meeting the Millennium development goals
 Transform CC Challenge into SD opportunities Source: Munasinghe, M, (1994) Need for integration of climate policies into development plans
 Desirable versus likely emission pathways -Where are we headed? 32
 Mitigation in Developed Economies Only will be Insufficient 14. 5 Gt 21. 7 Gt CO 2 = carbon dioxide, Gt = Giga tonne, ppm = parts per million, OECD = Organisation for Economic Co-operation and Development, PRC = People’s Republic of China. Note: Other Non-OECD Asia refers to developing Asia minus the PRC and India. In 2009, Indonesia, Thailand, and Viet Nam jointly comprised 46% of emissions from this group. Source: International Energy Agency (2011). 33
 Global emission projections: the gap between planned and required action 7 Gt 14. 5 Gt Source: IEA’s World Energy Outlook 2011. 34
 IEA Global mitigation scenarios • International Energy Agency (IEA) projections of future global emissions demonstrate the change in trajectories from anticipated, new policies (i. e. the difference between emissions in the “Current Policies” and “New Policies” scenarios) • Though future action is likely to reduce emissions substantially, twice the effort is required between “ New Policies” and “ 450 scenario”) • Under the “New Policies” scenario, emerging Asia as a whole will account for 46% of global energy emissions in 2035; China and India together will account for 38% • Even if today’s developing economies (i. e. members of the Organisation for Economic Cooperation and Development, or OECD) reduced their emissions to zero by 2035, this action would be insufficient to achieve the global target for a 450 ppm trajectory of 35 annual emissions falling to 21. 7 Gt of carbon dioxide
 Global emission reductions by source Source: IEA’s World Energy Outlook 2011. 36
 Responding to Climate Change - Principles, Mechanisms, & Options
 Objective of UNFCCC • Stabilization of greenhouse gas concentrations in the atmosphere at a level that would prevent dangerous anthropogenic interference with the climate system • Such a level should be achieved within a time-frame sufficient – to allow ecosystems to adapt naturally to CC – to ensure that food production is not threatened and – to enable economic development to proceed in a sustainable manner
 Principles • The Parties should protect the climate systems on the basis of: – Equity – Common but differentiated responsibility – Respective capabilities
 Kyoto Protocol • Adopted at Co. P 3 in Kyoto, Japan, in Dec. 1997 • Provides legally binding commitments for industrialized countries to return their GHG emissions to an average of approx. 5. 2% per cent below their 1990 levels during the 2008 -2012 • Target gases – CO 2, CH 4, N 2 O, HFCs, PFCs, SF 6
 Kyoto Protocol: Mechanisms
 Article 12: Clean Development Mechanism (CDM) • To assist parties in Annex I in achieving compliance with their quantified emission limitation and reduction commitments • To assist developing countries in achieving sustainable development • CDM will generate Certified Emission Reductions : a unit equal to 1 Tonne of CO 2 equivalent • CER = (Baseline GHG emission - Actual emission due to CDM activity)
 CDM: Project based mechanism CERs Developed countries Developing countries Resources Low costs of emission reduction High cost of domestic emission reduction Guiding principles Achieve SD, TT, Investment Meet ER targets in a cost effective way
 Principles for Developing Countries • Economic and social development and poverty eradication to be the first and overriding priorities of the developing countries • The right to development shall be adequately and effectively respected and ensured • Mitigation actions towards sustainable development path to be supported and enabled by technology, financing and capacity building from developed countries
 Bali Action Plan (BAP) • Mitigation commitments by developed countries are distinct from mitigation action by developing countries. • Bali Action Plan states the following: – (i) Measurable, reportable and verifiable nationally appropriate mitigation commitments or actions, including quantified emission limitation and reduction objectives, by all developed country Parties, while ensuring the comparability of efforts among them, taking into account differences in their national circumstances; – (ii) Nationally appropriate mitigation actions (NAMAs) by developing country Parties in the context of sustainable development, supported and enabled by technology, financing and capacity-building, in a measurable, reportable and verifiable manner;
 Proposals put forward as the actions of Developing Countries • Developing country Parties whose national circumstances reflect greater responsibility or capabilities shall formulate and submit NAMAs as low-emission strategies for long-term net emission reductions by 2050 • [All] developing country Parties consistent with their capacities and in the context of their broader sustainable development strategies shall elaborate NAMAs in the context of national low-emission development strategies
 GHG Mitigation -Technology and Policy Options • GHG emissions reduction – Power generation (incld. RE) – Industrial production – Transportation – Municipal sectors – Residential and commercial • Sequestration – Forests and agricultural lands – Geological sequestration – Oceanic sequestration
 Key Mitigation Technologies and Practices
 Factors Affecting and Influencing Choices and Change • Site specific constraints and priorities • Behavioral choices • Income and affordability • Adequate access to choices • Incentive and disincentive
 Mitigation targets & plans • 2009 UNFCC Conference in Copenhagen seemed to water-down expectations of any forward move in CC negotiations • However, in a substantial break with existing conventions, the governments of several major developing economies announced quantitative national targets for climate change mitigation. 50
 Climate change pledges & targets for major Asian economies Emissions Renewable Energy Targets Energy Efficiency China 40% to 45% ↓ emissions intensity (2005→ 2020) 17% ↓ emissions intensity (2010→ 2015) 11. 4% by 2015 15% by 2020 up from 8. 3% in 2010 16% ↓energy intensity (2010→ 2015) India 20% to 25% ↓ emissions intensity (2005→ 2020) 26% to 41% ↓ emissions below BAU 15% by 2020 up from ~ 4% (2010) 20, 000 MW solar by 2020 15% by 2025 (incl. nuclear) 10, 000 MW energy savings by 2020 30% ↓ energy emissions below BAU 20. 3% by 2022 Indonesia Thailand Vietnam Japan Australia Korea − Conditional 25% ↓emissions below 2000 levels 5% to 25% ↓ emissions below 2000 levels 30% ↓ emissions below BAU in 2030 5. 6% by 2020 9. 4% by 2030 up from 3% (2010) 16. 0 TWh by 2014 20% by 2020, up from 8% in 2007 6. 08% by 2020, up from 2. 7% in 2009 1% average annual ↓energy intensity (2005→ 2025) ↓elasticity of electricity/GDP to <1 (2025) 8% ↓energy intensity (2005→ 2015), 15% ↓ (2005→ 2020) 25% ↓ (2005→ 2030) ↓elasticity of electricity/GDP from 2 (2010) to 1. 5 (2015), to 1 (2020) 30% ↓energy intensity (2006→ 2030) − − Deforestation ↑ forest cover by 40 million ha by 2020 from 2005 level ↑ forest cover to 21. 7% by 2015, From 20. 36% in 2010 ↑ forest cover by 20 million ha by 2020 from 2010 level Forestry as net carbon sink by 2030 Forest cover to be 40% of total land mass (target introduced in 1991, 2010 level is 37%, up from 25% in 1998) ↑ forest cover to 16. 2 million ha in 2020 from 14. 3 million ha (2010) − Planned offset scheme as part of domestic carbon market − Sources: (from Howes & Wyroll): UNFCCC (2011), Howes and Dobes (2011), Chotichanathanwewong et al. (2011), R. Mathur (2011), Patunru (2011), Toan (2011), and Zhu (2011)
 Green Growth Policies and Measures Practiced or Proposed by Emerging Economies in Asia 52
 Transition/distribution grid improvements Japan Australia Singapore Republic of Korea Indonesia Thailand Viet Nam Advanced fossil generation technologies India Countries PRC Sector Feed-in tariff Efficiency labels Sales tax, energy tax, VAT reduction Mass transit goals Control of individual vehicle ownership Vehicle fuel efficiency goals Vehicle emission standards Biofuel standards Fertilizer management Crop carbon sequestration Methane mitigation Reduction of open-field burning Afforestation/reforestation programs REDD R&D Public investment and loans Agriculture Investment excise and other tax credits Transport Subsidies, grants, rebates Energy demand Renewable portfolio standards Energy supply Retiring old, inefficient plants Clean and/or energy efficiency programs Institutional capacity Demand-side energy Net metering Sustainable transport systems City level measures Climate funds Human resources development Capacity building Public awareness campaigns Financing Carbon sink programs Compact cities Low-carbon lifestyle 53 Shift of energy intensive industries Use of MBI, such as C&T
 REDD+ In December 2009, at the United Nations (UN) climate summit in Copenhagen, nations decided to pay tropically forested countries for maintaining standing forests under a new process known as the UN Collaborative Programme on Reducing Emissions from Deforestation and Forest Degradation in Developing Countries (REDD+). Up to 20% of carbon emissions globally come from deforestation—more than from cars, trucks, planes, and ships combined. This process would reward countries for preserving and enhancing their forests, offering financial incentives in return for good stewardship. This could be a good source of income for developing countries with significant forest cover. By some estimates, for example, Indonesia could earn $1 billion a year if it manages to reduce its rate of deforestation by 1 million hectares annually, with revenues calculated on the basis of the price per ton on the carbon markets. If REDD+ is agreed as part of a post-2012 climate regime, this could also open the door to carbon storage payments for other kinds of nature-based management covering ecosystems such as grasslands, pasturelands, peatlands, and mangroves; and more environmentally-friendly kinds of agriculture from agroforestry to conservation farming, as they too can store large amounts of carbon in vegetation and soils. REDD+ is being worked on under the auspices of the UN, and its final form is still evolving Basic premise that nations should be rewarded for conserving and enhancing these important carbon sinks— is widely accepted. Source: United Nations Collaborative Programme on Reducing Emissions from Deforestation and Forest Degradation in Developing Countries. 54
 REDD Plus is a financial incentive mechanism for reducing emissions from deforestation and forest degradation with the potential of sustaining livelihood of Forest Dependent Communities (FDCs), maintenance of ecosystem services and biodiversity conservation with safeguards of people living in and around forests with respect to their rights, governance and sustainable livelihood REDD Plus Pilot Sites source(FSI)
 R&D Spending Rai & Victor, 2009 56
 Components of Government Spending, Emissions, and Public Debt GDP current Public debt Population GDP per capita CO 2 emissions per capita ($ billion) (% of GDP) (million) (current $) (ton/ capita) 2008 2010 2008 1, 039. 42 14. 3 21. 5 48, 499 18. 48 4. 7 6. 0 Bangladesh 79. 55 39. 4 164. 4 497 0. 29 2. 4 Cambodia 10. 34 … 15. 1 710 0. 31 1. 6 Country Australia Education Health R&D Military Debt service Tax revenue (% of GDP) 2000– 2007 b 2008 2. 2 1. 8 … 23. 1 1. 1 … 1. 0 1. 2 8. 8 1. 7 0. 0 1. 1 0. 4 8. 2 PRC 4, 532. 79 15. 6 1, 354. 1 3, 422 4. 92 1. 9 d 1. 9 1. 5 2. 0 0. 8 9. 4 India 1, 214. 21 54. 9 1, 214. 5 1, 065 1. 25 3. 2 1. 1 0. 8 2. 6 2. 7 12. 9 510. 50 28. 3 232. 5 2, 246 1. 69 3. 5 1. 2 0. 0 1. 0 4. 8 12. 3 4, 886. 97 172. 1 127. 0 38, 268 9. 02 3. 4 6. 5 3. 4 0. 9 … … Indonesia Japan Lao PDR 5. 47 … 6. 4 882 … 2. 3 0. 8 0. 0 0. 4 3. 8 10. 1 Malaysia 221. 16 41. 5 27. 9 8, 187 6. 70 4. 5 1. 9 0. 6 2. 0 4. 1 16. 6 Mongolia 5. 26 … 2. 7 1, 991 4. 33 5. 1 3. 5 0. 2 … 1. 4 23. 2 Myanmar … … 50. 5 … 0. 24 1. 3 0. 2 … … 3. 3 Nepal 12. 61 … 29. 9 438 0. 12 3. 8 2. 0 … 2. 0 1. 3 10. 4 New Zealand 115. 45 17. 4 4. 3 27, 045 7. 74 6. 2 7. 1 1. 3 1. 1 … 31. 7 Pakistan 165. 18 51. 0 184. 8 994 0. 81 2. 9 0. 8 0. 7 2. 6 1. 8 9. 8 Philippines 167. 49 56. 9 93. 6 1, 854 0. 80 2. 6 1. 3 0. 1 0. 8 6. 6 14. 1 Singapore 193. 33 95. 9 4. 8 39, 950 9. 16 2. 8 1. 0 2. 6 4. 1 … 14. 6 Republic of Korea 931. 40 24. 4 48. 5 19, 162 10. 31 4. 2 3. 5 2. 8 … 16. 6 Sri Lanka 40. 72 81. 1 20. 4 2, 020 0. 61 7. 1 2. 0 0. 2 3. 6 3. 1 14. 2 Thailand 272. 46 38. 0 68. 1 4, 043 3. 41 4. 9 2. 7 0. 2 1. 5 6. 3 16. 5 Viet Nam 90. 64 48. 8 89. 0 1, 051 1. 19 5. 3 2. 8 0. 2 2. 4 1. 5 … 57 CO 2 = carbon dioxide, GDP = gross domestic product, Lao PDR = Lao People’s Democratic Republic, PRC = People’s Republic of China, R&D = research and development. Source: World Bank; CIA (2010); IEA; Human Development Report (2010).
 Mitigation assessment -India 58
 GHG Emissions by sector for 1994 & 2007 (million tonnes of CO 2 equivalent) Source: Mo. EF, 2004 & Mo. EF, 2010 a (INCCA) 59
 Key data for India (2005) compared to global levels Source: World Bank, 2009
 Current Energy Status • Installed generating capacity ~ 201, 637 MW • Per capita consumption of electricity ~571 k. Wh – • North America: 13167, Europe: 6065, World average: 2803 (2009 data) Suffering from huge shortages (2008/09) of – ~ 11% in energy terms – ~ 12% in peak energy • Over 400 million people with no access to electricity • 90% of rural India dependent on traditional fuels for cooking
 Reference Energy Demand Projections Concerns of: • Energy security • Climate Change Need to move away from the Reference case scenario What alternative pathways could provide? CONFIDENTIAL: NOT TO BE QUOTED
 TERI’s MARKAL Modeling Framework § Detailed bottom-up technological representation of the energy system: over 300 technologies & ~ 100, 000 variables § Multi-time period, dynamic LP model extending from 2001 -2051 § Objective function minimizes total energy system costs while incorporating various elements of sustainable development, energy access, self sufficiency, emissions reduction Economy-Energy-Environment linkages Energy economy Capital needs and technology deployment Availability of technologies Constraints on Import and mining of energy MARKAL Energy consumption Ecological effects emissions Environment Demand for energy services Economy and society
 Methodological Framework Demographic & CGE Model Population Projections Agriculture Commercial Sectoral GDP Projections Demands Indigenous Energy Resource Availability & Prices Imported Energy Resources & Prices Residential Industrial Transport MARKAL/TIMES MODEL Model outputs Resource wise final energy requirements Supply side Technology Deployment Demand Side Technology Deployment Technology Assessment Module Demand side: Techno - Economic & Performance Parameters (end use technologies) Supply side: Techno - Economic & Performance Parameters (Resources and conversion options) Investment requirements Emissions
 India’s Energy Security: New Opportunities for a Sustainable Future
 So What Shape Can The Future Take? Scenario names Storyline Reference Energy Scenario (RES) Development continues along current paths with autonomous efficiency improvements taking place where feasible and increase in use of renewable energy carrying on at the same pace; and defined policy priorities being implemented Sustainable Energy Scenario (SES) A determined effort is provided here for efficiency improvements both on the supply and demand sides; an accelerated push for renewable energy, nuclear and new technologies. Energy Security concerns are paramount in this scenario. Global Equity Scenario (GES) This scenario honours the Prime Minister of India’s commitment that India’s per capita carbon emissions would never exceed those of the developed world and it is optimistically assumed here that the developed world would be able to bring down its emissions to a level of 2 tonnes/capita by 2030 as indicated by IPCC AR 4. Stringent Mitigation Scenario (SMS) This scenario considers that India takes on an extremely aggressive approach to energy self-sufficiency also resulting in even more stringent emissions reductions.
 So What Shape Can The Future Take? Commercial energy consumption Commercial energy increases at ~7% over the modeling period (20012031) Commercial energy in 2031 decreases from 2149 Mtoe in RES to 1543 Mtoe in SES (28% decrease) & 1145 Mtoe in GES (47% reduction)
 So What Shape Can The Future Take? Primary commercial energy supply-2031 Even by 2031, coal remains the dominant fuel (>50% share) in both RES & SES scenarios, followed by oil (39% & 30% respectively) Share of coal reduces to 33% & 15% in 2031 in GES & SMS scenarios Share of renewables in 2031: SES: 6%, GES: 19%, SMS: 41%
 So What Shape Can The Future Take? Fossil import dependency By 2031, India’s energy imports could increase significantly, creating additional pressure on the economy & import infrastructure Coal import: ~1400 MT; Oil import: ~750 MT
 So What Shape Can The Future Take? Power generation capacity mix in 2031 Capacity required in 2031: RES: 794 GW; SES: 720 GW; GES: 834 GW; SMS: 1188 GW Share of solar increases to 34% in GES and 64% in SMS in 2031 as compared to 12% in SES
 National and International Policy Responses to The Carbon Budget Approach: An Indian Perspective
 20 Celsius – The Challenges Agreement at the MEF forum (L’Aquila) in 2009 (subsequently other forums) to contain global temperature increase to not more than 20 Celsius above preindustrial levels created a new momentum. Scientists responded by estimating the carbon budget that would ensure meeting this goal at different levels of probability § Limited carbon space (Global Carbon Budget) § Therefore: – Agreement on the basis of fair allocation – Agreement on the formula for effort sharing § Equity: – Entitlements – Opportunities – Capabilities
 The Story: Reduced Opportunities Original position(1850 -2050): § 2/3 rd probability of achieving 20 target means global carbon budget 750 GT § Equal entitlements per human year now reduced at 2. 23 t. CO 2 eq 1. Problem of historical emissions? 2. How to account for it? Tons of CO 2 Equal entitlements per human year 3. 44 t. CO 2 eq Actual emissions Annex 1 countries used all the excess budgets of non-annex 1 countries and borrowed 394 GT from future – more than their future entitlements of 186 GT!
 The Carbon Budget Approach § Original position scenario – All countries maintain 3. 44 t. CO 2 eq emissions per human year over 2010 -2050 – Very likely to overshoot 20 target § Debt compensated scenario: TERI’s proposal – Historical responsibility: Settle ‘climate debt’ through financial transfers; collect and disburse through ‘World Climate Debt Fund’ – Fair allocation: Allocate available carbon space among countries on equal emissions per human year basis (2. 23 t. CO 2 eq) Is it economically and politically viable?
 Carbon Budget for India GT Reduction from Reference Case § Original position : 48% § Debt compensated : 66%
 Fuel Mix in 2021 & 2051 % § Significant capacities would need to be forcibly retired towards the end § Move away from coal in longer time frame with stringent carbon constraint § Renewable is the key for achieving low carbon growth in longer term along with energy efficiency and other advanced technologies Reference Original position Debt compensated
 Power Generation Technology Mix in 2021 & 2051 GW In 2021 § Reduction in power generation capacity due to energy efficiency improvement at end uses § Move away from coal (even clean coal technology) to renewable and nuclear In 2051 § Total capacity requirement in increases from 1700 GW to 3000 GW due to large share of renewable and their lower availability factor Reference Original position Debt compensated
 Macro Inferences • Both studies indicate similar macro director • Energy efficiency is key in the short and medium term • Renewable energy is necessary and likely to play major role after 2021 • India’s window of opportunities is better now and 2021 to prevent lock in in the technology – Super critical, ultra supercritical power plants • It would require: – A substantial shift in life style patterns – A major focus on barrier removal activities
 India’s Mitigation efforts • Several development related Policies and Plans – Energy and emissions intensity decreasing • Under the Copenhagen Accord, India pledged to a 20 -25% reduction (excluding the agriculture sector) in GHG emissions intensity per unit of GDP by 2020 from a 2005 baseline (Planning Commission, 2011) • India’s National Action Plan on Climate Change launched on 30 June 2008 – 8 Missions • 12 th Plan – Inclusion of Climate Change
 Solar Mission – Several mechanisms to increase share of renewables – 1000 MW of grid connected solar power at 33 k. V and above proposed to be purchased by NTPC Vidyut Vyapar Nigam (NVVN), & NVVN to be provided with equivalent capacity of coal based thermal power plants from the central quota – The Central Electricity Regulatory Commission (CERC) has come up with Renewable Energy Certificates (REC) mechanism • RECs are generation-based ‘certificates' awarded to those generating electricity from renewable sources such as wind, biomass, hydro and solar, if they opt not to sell the electricity at a preferentially higher tariff. These certificates are tradeable on the exchanges and are bought by ‘obligated entities', which are either specified consumers or electricity distribution companies. • Trading of Renewable Energy Certificates (REC)s in India started successfully on 30 th March 2011. Gained momentum with increase in volume of REC traded & REC price. • Solar REC /non-solar REC. Power purchase tariffs are fixed annually by CERC and can be traded within a maximum/minimum price range set for both these categories. Range between Rs 80 12, 000 -Rs 17, 000 /solar REC; Rs 1500 –Rs 3900/ non-solar REC
 NMEEE • several implementation strategies planned in order to achieve a saving of 10, 000 MW by the end of the 11 th Five year plan in 2012 (Go. I 2008). – The Perform Achieve and Trade (PAT) energy certificate trading scheme. – The Market Transformation for Energy Efficiency (MTEE) – The Energy Efficiency Financing Platform (EEFP) – Framework for Energy. Efficient Economic Development (FEEED) Concept of target, compliance, ESCerts and penalty 81
 National Mission on Sustainable Habitat (NMSH) • promoting energy efficiency in residential and commercial sectors by bridging the knowledge gap on designing green infrastructure, by ensuring better implementation of government schemes, and by offering appropriate financial incentives • developing a comprehensive approach to managing water, solid waste and wastewater that takes into account potential for recycling, reuse and energy creation • refurbishing urban transportation to increase usage and energy efficiency through a combination of promotional, regulatory and fiscal measures, including mandatory fuel efficiency standards 82
 Green India Mission AIM Ø Enhancing carbon in sustainably managed forests and other ecosystems Ø Adaptation of vulnerable species /ecosystems to the changing climate Ø Adaptation of forest dependent communities Objectives: Ø Increase FTC on 5 m ha and Improve quality of forests on 5 million ha (10 m ha) Ø Improve ecosystem services including biodiversity, hydrological and carbon sequestration Ø Increase forest based livelihood of 3 million FDCs Ø Enhance annual CO 2 sequestration of 50 -60 MT by 2022 Means to achieve: Ø Decentralized forest governance; Engaging stakeholders; REDD+ Cell ; National REDD Cell in Mo. EF; National, State & Community level consultation on REDD+; Monitoring by Social audit; etc
 A schematic representation of policies, programmes and projects of Govt. of Gujarat which have direct/indirect thrust on GHG mitigation Policies & Schemes ENERGY Projects & Initiatives Policies & Schemes ENVIRONMENT Projects & Initiatives R&D Projects & Initiatives • • • Gujarat Industrial policy 2009 Solar Power Policy 2009 Wind Power Policy 2007 Port policy 2005 Gujarat Urban Transport Policy 2005 • Gujarat Electricity Industry Act 2003 • Kisan Hit Urja Shakti Yojana • Energy Conservation- HVDS • Jyoti Gram Yojana • Pragatipath Yojana • Green Solar projects • Solar projects: solar city project Gandhinagar • Smart Grid demonstration project • Promotion of energy efficient pump sets • Sardar Sarovar project for generating hydel power • Energy audits in SMEs & Govt. Build. • Promotion of Green Credit Scheme • Social Afforestation • Programmes 50% power targeted from green technologies • First State to encourage Gas as fuel, setting up integrated state- wide Gas Grids • Promoting Bus Raid Transport Systems • Urban forestry • Nirmal Gujarat Yojana • Revolving fund for R&D of green technologies • School of Solar Energy has also been set up under Pandit Deendayal Petroleum University • Setting up CNG stations on a large scale • Fiscal incentives like subsidies for promotion of bioenergy • Incentives promoting private investment in wind sector
 Mitigation Potential/Opportunities State example: Gujarat
 Mitigation Potential/Opportunities p Renewable Energy n Investment worth INR 65, 000 crore expected by 2014 p p p Energy Efficiency n p Capacity augmentation: wind energy-4000 MW, biomass energy 1000 MW, solar energy-716 MW Will generate 20, 000 million units of electricity annually Expected to offset 12. 5 million tonnes of coal Will reduce carbon emissions by 18. 4 million tonnes annually Second highest energy saving potential in the country (7, 928 Million Units per annum) (Enerco Energy Solutions) Afforestation
 Renewable Energy Potential Source Resource/Advantage Energy Generation/Saving Potential Vis-à-vis Conventional Energy Wind Longest coastal belt (1600 Km) Over 10000 MW Save 2. 72 mn tonnes of coal/annum (reduce CO 2 emissions by 3. 89 mn tonnes/annum) Solar 300 days of clear sun; solar 716 MW insolation of 5. 8 -6. 0 Kwh per sq. mt/day; arid condition, minimal sun tracking Save 1. 05 million tonnes of coal per annum (reductions in CO 2 emissions by 1. 5 million tonnes per annum) Biomass Total biomass generated : 24, 164 kt/yr 1, 014 MW(from agrowastes, wastelands, forest wastes)
 Renewable Energy Potential Source Resource/Advantage Energy Generation/Saving Potential Biogas 200 lakh cattle population (dung 5. 6 mn m 3 of biogas per day, can available at 70% collection efficiency) provide cooking gas to 2. 8 mn families, can generate 933 MW of electricity Biofuel energy 6. 7 mn hectare wastelandwhich can yield 67 mn tonnes of biomass 15000 MW Tidal energy Coastline of 1600 km and a tidal wave altitude reaching nearly 6 m Other options: MSW to electricity and geothermal energy Gulf of Kutchh (9000 MW), Gulf of Khambhat (9000 MW Kalpasar project aimed at generating 6000 MW during peak hours
 Energy Efficiency/Saving Potential of Various Sector Current Consumption EE/Saving Potential Industry ~ 36% Agriculture 21. 10% Domestic sector ~15% Commercial sector ~ 6% 7 -10%, 2. 71 BU 30 -40% (by use of efficient APS alone) Urban sector: 15 -20% Rural sector: 40 -50% 20 -30% Street lighting in municipalities and corporations 25% Water works and sewage in municipalities and corporations 20%
 Mitigation Strategies
 Mitigation Strategies: Underlying Principles p p Harnessing opportunities based on economics of low carbon growth Focus on Co-benefits n n n p p Carbon abatement, improved environment quality Induced technology innovation and change Increased energy independence/security Green jobs Health benefits Priority to upscaling current initiatives Advantage of conducive policy framework and effective governance
 Way Forward What exists…. . p p p Actions in consonance with the directives of NAPCC Very comprehensive and forward looking policies and programmes On-going path breaking initiatives and potentially scalable models Support from the highest level of administration Fairly good inter-departmental cooperation What needs strengthening…… p p p Action based and policy relevant research studies on climate change Technical capacity and infrastructure on climate science and modeling Awareness and capacity building for action at all levels, community empowerment for participatory and decentralized decision making for action on climate change Sensitizing and equipping local governance to address climate change concerns. Extensive private sector engagement and private investment flows Mainstreaming climate concerns into planning processes
 Mitigation Case Study - Malaysia
 Mitigation Case Study - Malaysia A Roadmap of Carbon Intensity Reduction in Malaysia - Mitigation Strategy in response to a 40% GHG emission intensity reduction target by 2020
 Framework • • • A comprehensive analysis directed at mitigation prospects, potential and strategies across various sectors using an integrated analytical framework – In-depth analysis based on local data and national circumstances – Secondary sources of information; expert views; stakeholder consultations through workshops, oneto-one discussions – Consistent set of drivers across study/sectors A bottom-up approach adopted to – assess changes in end-use demands and activity levels across sectors, – evaluate specific technologies and options across sectors, – develop scenarios for energy and non-energy GHG emitting sectors to assess the potential for GHG emission reduction Business-as-usual & alternative scenarios developed in each sector to examine the emission reduction possibilities and to delineate a mitigation roadmap for the Malaysian economy Optimization framework: energy sector & Accounting framework: non-energy sectors Existing/planned policies and measures reviewed – To understand the country’s policy environment, – Gauge the likelihood of activity levels/technological progress in each sector – Assess the availability of resources in the future – To understand barriers and constraints
 Bottom up Analytical Approach Screen Potential Technology Options Assemble Base-Year Data by Subsector GHG Emissions Inventory Characterize Technologies and Practices Define and Analyze Baseline and Mitigation Scenarios Bottom-up Sectoral Analysis Assess Policy Options to Achieve Goals Qualitative Assessment Project Activity Levels Key Scenario Assumptions; GDP, Population, Sectoral Policies, etc. Develop GHG Mitigation Strategy
 Key Results
 Sector 2005 2020 BAU Energy Power Transport Industry Residential & Commercial Others* Total Energy Industrial process Agriculture Waste LULUCF emissions LULUCF– sink Total without LULUCF (Case 1) Total with LULUCF (Case 2) Total with emission from LULUCF but not sink (Case 3) 2030 AMB 57. 5 45. 3 35. 5 4. 3 61. 8 204. 3 15. 6 6. 6 27. 4 25. 3 -240. 5 253. 9 38. 7 73. 7 88. 7 35. 5 9. 2 89. 8 297. 0 22. 3 7. 2 46. 6 44. 4 -410. 0 373. 0 7. 4 63. 3 70. 5 31. 5 8. 1 75. 2 248. 5 21. 4 4. 3 14. 7 44. 4 -410. 0 288. 8 -76. 8 105. 2 125. 3 49. 2 18. 0 129. 1 426. 7 33. 8 8. 3 57. 3 43. 0 -409. 2 526. 1 159. 9 70. 8 80. 5 40. 9 12. 3 88. 7 293. 3 30. 2 4. 9 17. 7 43. 0 -409. 2 346. 1 -20. 2 279. 2 417. 4 333. 2 569. 1 389. 1 GHG Emissions Projection GDP (RM million) BAU 449250 1007631 1645797 Emission Intensity (kg CO 2/RM) without LULUCF (Case 1) 0. 57 0. 37 0. 29 0. 32 0. 21 Emission Intensity (kg CO 2/RM) with LULUCF (Case 2) 0. 09 0. 01 -0. 08 0. 10 -0. 01 Emission Intensity (kg CO 2/RM) with emissions from LULUCF but not sink (Case 3) 0. 62 0. 41 0. 33 0. 35 0. 24 Reduction in Emission Intensity from 2005 level without LULUCF (%)(Case 1) 35% 49% 43% 63% Reduction in Emission Intensity from 2005 level with LULUCF (%)(Case 2) 92% 188% -13% 114% Reduction in Emission Intensity from 2005 level ) with emission from LULUCF but not sink (Case 3) 33% 47% 44% 62% *Others include emissions from Energy industries such as fugitive emissions, manufacture of solid fuel, and petroleum refining etc.
 Key results – Potential Emission Reduction • Without LULUCF Sector: – BAU scenario: Emissions would increase from 254 million tonnes of CO 2 eq. in 2005 to 373 million tonnes of CO 2 eq. in 2020 and 526 million tonnes of CO 2 eq. in 2030 – Ambitious scenario: Emissions would reduce to 289 million tonnes of CO 2 eq. and 346 million tonnes of CO 2 eq. in 2020 and 2030 respectively – In the BAU scenario, emission intensity would reduce by 35% in 2020 and by 43% in 2030 from 2005 levels. Thus, with current efforts and existing plans and policies, Malaysia would be unable to meet its commitment of 40% emission intensity reduction by 2020 – In the Ambitious scenario, emission intensity reduces by 49% in 2020 and by 63% in 2030 from 2005 levels • With LULUCF Sector: – In the BAU scenario, emission intensity decreases from 2005 levels by 92% in 2020 and actually increases to 13% in 2030, – In the Ambitious scenario, the emissions intensity decreases from 2005 levels by 188% in 2020 and 114% in 2030 respectively
 Sensitivity Analysis for GDP Growth Rate • • The analysis clearly indicates that while it is important for Malaysia to try and achieve emission reduction / increase sinks to around the levels as suggested in the Ambitious scenario presented in this report, it is equally important for the country to ensure that a high level GDP growth rate can be maintained over the next decade and beyond. There is, therefore, a need to prioritize and focus on activities and areas that could bring in high value added growth across sectors. 2005 2020 2030 BAU With 4. 2% GDP Growth GDP (RM million) Reduction in Emission Intensity from 2005 level without LULUCF (%) (Case 1) AMB BAU AMB 449250 832729 1256554 21% 51% 207% -48% 119% 36% 27% 50% Reduction in Emission Intensity from 2005 level ) with emission from LULUCF but not sink (Case 3) 26% 90% Reduction in Emission Intensity from 2005 level with LULUCF (%) (Case 2) 39%
 MARKAL Analysis and Results -Energy sector
 Total CO 2 Emissions Comparison (fuel consumption): BAU vs AMB • It is observed that the scope for emission reduction from the energy sector is around 32 MT (14%) by 2020 and 93 MT (29%) by 2030.
 Sector Wise CO 2 Emissions- BAU • Transport & electricity generation have highest share in the emissions – Transport sector : 89 MT in 2020 ; 125 MT in 2030 – Electricity generation : 74 MT in 2020 ; 105 MT in 2030
 Sector Wise CO 2 Emissions- AMB • • Transport, Electricity generation, and industry remain the main sectors accounting for around (90%) of CO 2 emissions from fuel combustion Emissions reduction – – Transport sector : 18 MT in 2020 (57% of total) ; 45 MT in 2030 (48 % of total) Electricity generation : 9 MT in 2020 (27% of total) ; 34 MT in 2030 (37% of total)
 Power Sector • Plans to increase coal & gas based capacity • Low utilization of current plants; excess capacity creation in last few years • Recent lock-ins prevent scope for major reduction in emissions by 2020.
 Power Generation Capacity- BAU • • Electricity generation capacity 2020: 23, 010 MW; 2030: 30, 512 MW Share of coal increases • Coal : 31% in 2020; 44% in 2030 ; Gas: 52% in 2020; 37% in 2030 • Renewable: 4% in both 2020 and 2030
 Ambitious Scenario for Power Sector • Renewable based power generation – RE capacity reaches 2, 080 MW by 2020 and 4, 000 MW by 2030 • Clean coal technologies – supercritical/USC • Higher use of gas in power generation as low carbon fuel • Advance gas turbine based combined cycle plant • Higher capacity of large hydro • Nuclear energy • Energy efficiency improvement at end use demand side – In both scenarios, electricity demand is derived from the bottom up analysis, and subsequently in the integrated modelling exercise, power generation fuels as well as technologies are selected based on overall optimization of the entire energy sector
 Power Generation Capacity - AMB • • Electricity generation capacity 2020: 25, 091 MW; 2030: 36, 425 MW Share of coal decreases as compared to BAU, Renewable and other increases • Coal : 22% in 2020; 20% in 2030; Gas: 53% in 2020; 38% in 2030 • Renewable: 8% in 2020; and 11% in 2030
 CO 2 Emissions Comparison: Electricity Generation BAU vs AMB • Reduction of 9 MT of CO 2 (12% reduction) in 2020 and 34 MT of CO 2 in 2030 (33% )
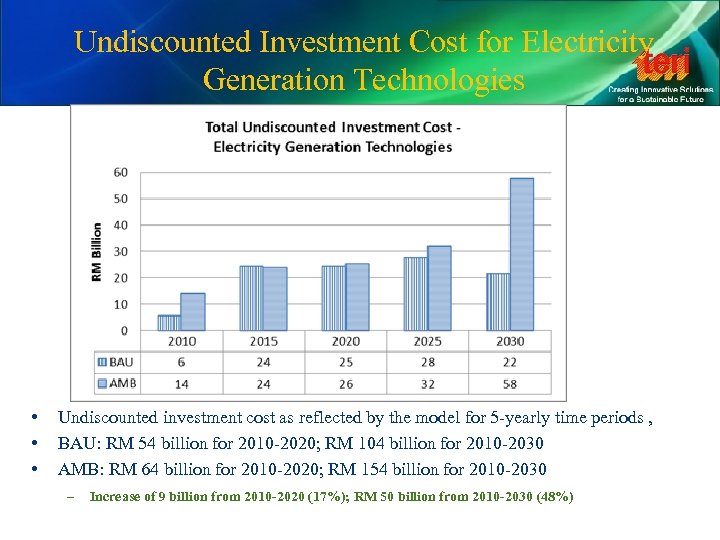 Undiscounted Investment Cost for Electricity Generation Technologies • • • Undiscounted investment cost as reflected by the model for 5 -yearly time periods , BAU: RM 54 billion for 2010 -2020; RM 104 billion for 2010 -2030 AMB: RM 64 billion for 2010 -2020; RM 154 billion for 2010 -2030 – Increase of 9 billion from 2010 -2020 (17%); RM 50 billion from 2010 -2030 (48%)
 Key recommendations- Power Sector • Key recommendations for renewable energy sector are: – Set up aggressive RE target for both grid and off-grids applications – Assess the potential of decentralized RE systems across different potential sectors and creating appropriate policy and incentive structure – Rationalize price of fossil fuel to provide level playing field for renewable energy development and – Create a manufacturing base of RE
 Transport Sector
 Activity and Energy Use in the Transport Sector * Estimated Based on data and various assumptions provided by IEPRe, UNITEN
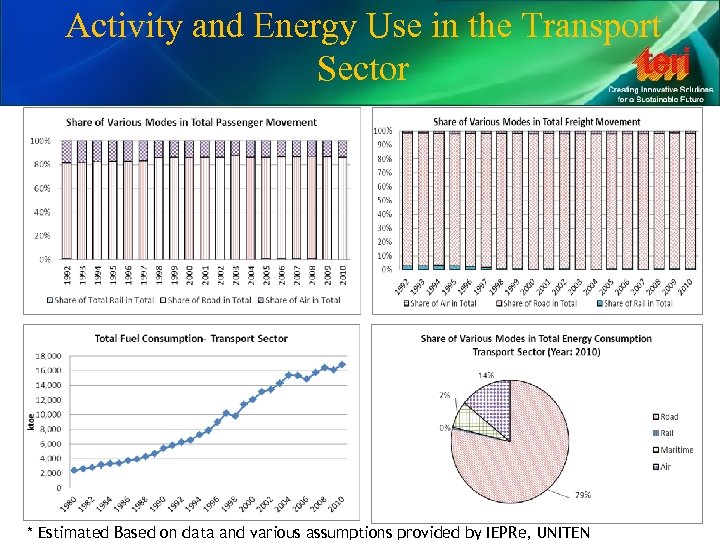
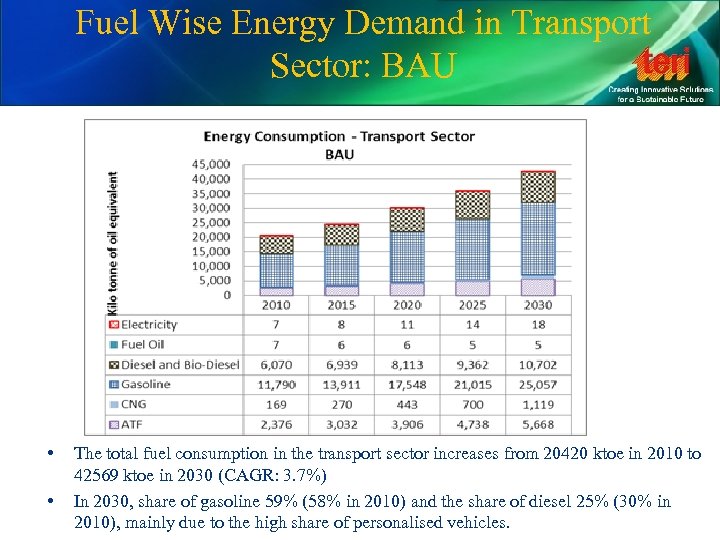 Fuel Wise Energy Demand in Transport Sector: BAU • • The total fuel consumption in the transport sector increases from 20420 ktoe in 2010 to 42569 ktoe in 2030 (CAGR: 3. 7%) In 2030, share of gasoline 59% (58% in 2010) and the share of diesel 25% (30% in 2010), mainly due to the high share of personalised vehicles.
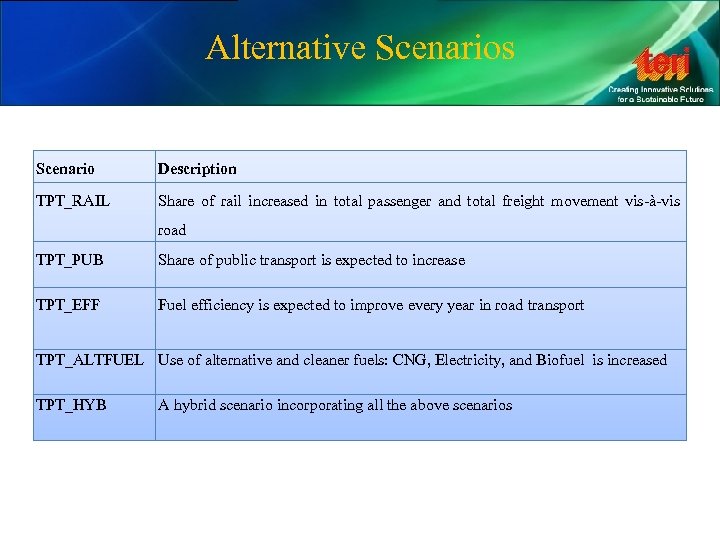 Alternative Scenarios Scenario Description TPT_RAIL Share of rail increased in total passenger and total freight movement vis-à-vis road TPT_PUB Share of public transport is expected to increase TPT_EFF Fuel efficiency is expected to improve every year in road transport TPT_ALTFUEL Use of alternative and cleaner fuels: CNG, Electricity, and Biofuel is increased TPT_HYB A hybrid scenario incorporating all the above scenarios
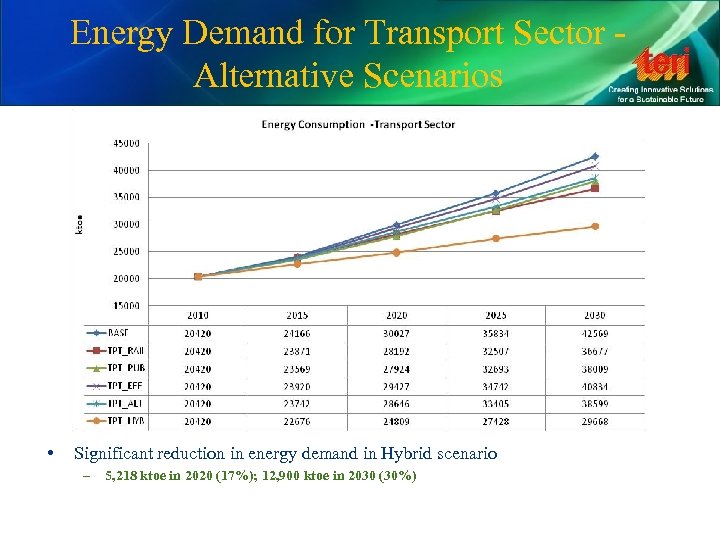 Energy Demand for Transport Sector - Alternative Scenarios • Significant reduction in energy demand in Hybrid scenario – 5, 218 ktoe in 2020 (17%); 12, 900 ktoe in 2030 (30%)
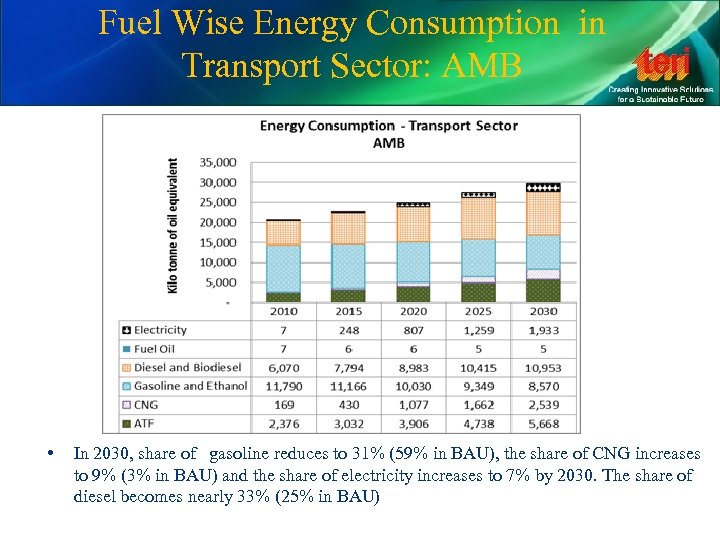 Fuel Wise Energy Consumption in Transport Sector: AMB • In 2030, share of gasoline reduces to 31% (59% in BAU), the share of CNG increases to 9% (3% in BAU) and the share of electricity increases to 7% by 2030. The share of diesel becomes nearly 33% (25% in BAU)
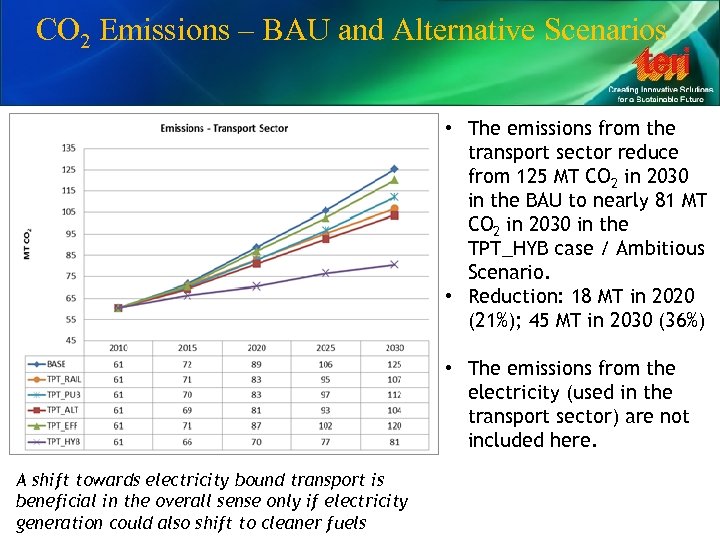 CO 2 Emissions – BAU and Alternative Scenarios • The emissions from the transport sector reduce from 125 MT CO 2 in 2030 in the BAU to nearly 81 MT CO 2 in 2030 in the TPT_HYB case / Ambitious Scenario. • Reduction: 18 MT in 2020 (21%); 45 MT in 2030 (36%) • The emissions from the electricity (used in the transport sector) are not included here. A shift towards electricity bound transport is beneficial in the overall sense only if electricity generation could also shift to cleaner fuels
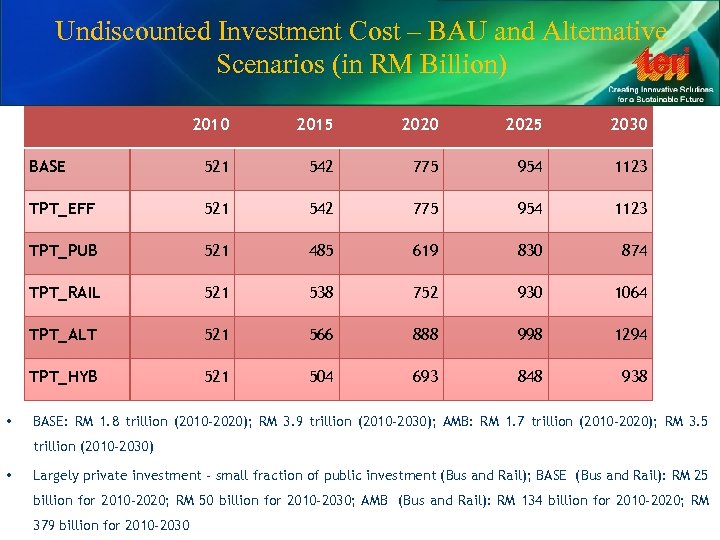 Undiscounted Investment Cost – BAU and Alternative Scenarios (in RM Billion) 2015 2020 2025 2030 BASE 521 542 775 954 1123 TPT_EFF 521 542 775 954 1123 TPT_PUB 521 485 619 830 874 TPT_RAIL 521 538 752 930 1064 TPT_ALT 521 566 888 998 1294 TPT_HYB • 2010 521 504 693 848 938 BASE: RM 1. 8 trillion (2010 -2020); RM 3. 9 trillion (2010 -2030); AMB: RM 1. 7 trillion (2010 -2020); RM 3. 5 trillion (2010 -2030) • Largely private investment - small fraction of public investment (Bus and Rail); BASE (Bus and Rail): RM 25 billion for 2010 -2020; RM 50 billion for 2010 -2030; AMB (Bus and Rail): RM 134 billion for 2010 -2020; RM 379 billion for 2010 -2030
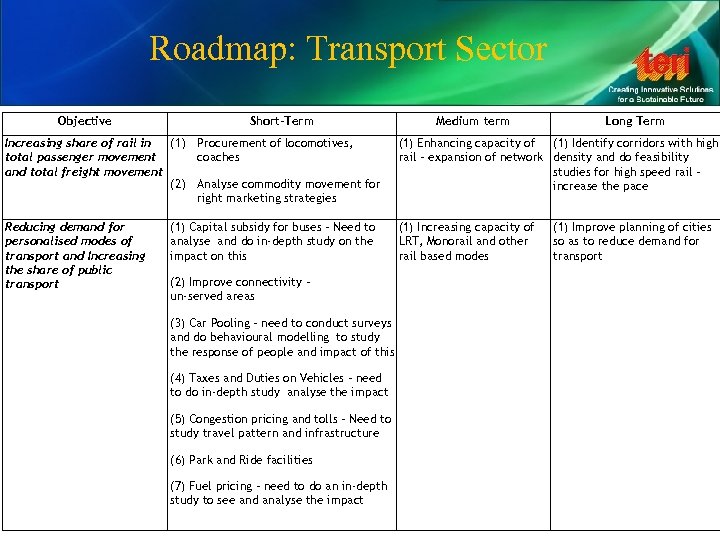 Roadmap: Transport Sector Objective Short-Term Medium term Long Term Increasing share of rail in (1) Procurement of locomotives, total passenger movement coaches and total freight movement (2) Analyse commodity movement for right marketing strategies (1) Enhancing capacity of (1) Identify corridors with high rail – expansion of network density and do feasibility studies for high speed rail – increase the pace Reducing demand for personalised modes of transport and Increasing the share of public transport (1) Increasing capacity of LRT, Monorail and other rail based modes (1) Capital subsidy for buses – Need to analyse and do in-depth study on the impact on this (2) Improve connectivity – un-served areas (3) Car Pooling – need to conduct surveys and do behavioural modelling to study the response of people and impact of this (4) Taxes and Duties on Vehicles – need to do in-depth study analyse the impact (5) Congestion pricing and tolls – Need to study travel pattern and infrastructure (6) Park and Ride facilities (7) Fuel pricing – need to do an in-depth study to see and analyse the impact (1) Improve planning of cities so as to reduce demand for transport
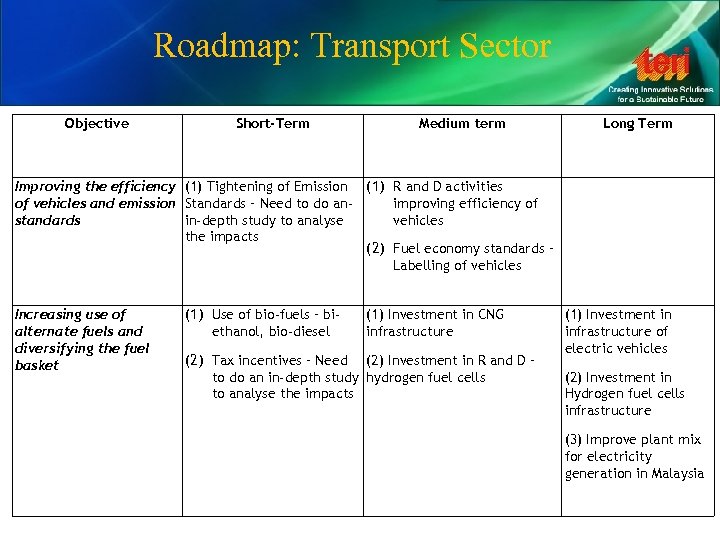 Roadmap: Transport Sector Objective Short-Term Medium term Long Term Improving the efficiency (1) Tightening of Emission (1) R and D activities of vehicles and emission Standards – Need to do animproving efficiency of standards in-depth study to analyse vehicles the impacts (2) Fuel economy standards – Labelling of vehicles Increasing use of alternate fuels and diversifying the fuel basket (1) Use of bio-fuels – biethanol, bio-diesel (1) Investment in CNG infrastructure (2) Tax incentives – Need (2) Investment in R and D – to do an in-depth study hydrogen fuel cells to analyse the impacts (1) Investment in infrastructure of electric vehicles (2) Investment in Hydrogen fuel cells infrastructure (3) Improve plant mix for electricity generation in Malaysia
 Residential and Commercial Sector • Electricity is the main fuel in both Residential & Commercial sectors • Significant potential for DSM measures : “low hanging fruits” • Mitigation options : – Green buildings: new stock from 2012 onwards • Sustainable site planning and building design – Adoption of efficient technology: In the existing stock. • Replacement of incandescent bulb with compact fluorescent lighting and adding occupancy sensors, day lighting sensors etc. in commercial sector; appliance efficiency in residential sector – Solar energy for water heating: In the existing stock.
 Residential and Commercial Sector: Policy Recommendations • Voluntary rewards program for manufacturers (Residential and Commercial) – a voluntary program that rewards those project manufacturers that want to create more energy efficiency products. – brand reliability and trustworthiness will be ensured and simultaneously allow customers to make informed purchasing decisions. • Minimum Energy Performance Standards (MEPS) and Energy Managers (Commercial) – Voluntary agreements and MEPS can be used in conjunction • can cover equipment, building design and operation and public, and private sector energy management policies and practices. • Examples include Green Lights in the EU and the Energy Star programmes in the USA • MEPS has been proposed under the Energy Efficiency Act in Malaysia – Mandatory for all commercial establishments to employ an Energy Manager who would conduct regular audits and implement energy efficiency measures
 Residential and Commercial Sector: Policy Recommendations • Energy Service Companies (ESCOs) (Residential and Commercial) – Company that offers energy services, such as energy analysis and audits, energy management, project design and implementation, maintenance and operation, monitoring and evaluation of savings, property/facility management, energy and/or equipment supply and provision of energy services (e. g. , space heating, lighting). – Guarantee the energy savings and/or the provision of a specified level of energy service at lower cost by taking responsibility for energy-efficiency investments or/ and improved maintenance and operation – They can play a central role in improving energy efficiency without burdening public budgets and regulatory intervention to markets.
 Residential and Commercial Sector: Policy Recommendations • • Redirecting and reducing subsidies – As a developing economy, some amount of subsidy can be redirected towards energyefficiency efforts. – policy of gradual decrease in subsidies and an increase in electricity tariffs at regular intervals can be followed. – “Consume more, Pay more” with a social safety net for low income households, i. e. with energy consumption below 200 k. Wh per month Associated impacts of energy efficiency on Macroeconomic and Development Goals – energy-efficient household equipment and low-energy building design can contribute to poverty alleviation through minimizing energy expenditures – sustainable development strategies aimed at improving social welfare go hand-in-hand with energy efficiency and renewable energy development. – Improved end-use energy efficiency is likely to reduce energy imports – Energy-efficiency investments will also have positive effects on employment, directly by creating new business opportunities and indirectly through the economic multiplier effects
 Waste Sector
 Overview of Malaysia’s Waste Sector • Solid waste has been increasing due to rapid growth • As much as 60% of municipal budget is spent on managing solid waste • To address the improper disposal of waste, the NSP, 2005 has suggested following strategies – – – Immediate closure of landfills in sensitive areas Upgradation of non-sanitary landfills Building new sanitary landfills Constructing incinerators to process organic waste In addition gradual targets have been set for waste recycling
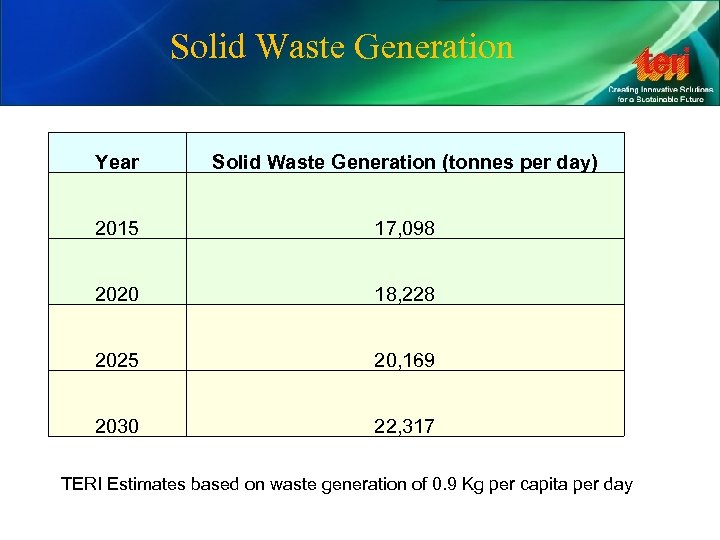 Solid Waste Generation Year Solid Waste Generation (tonnes per day) 2015 17, 098 2020 18, 228 2025 20, 169 2030 22, 317 TERI Estimates based on waste generation of 0. 9 Kg per capita per day
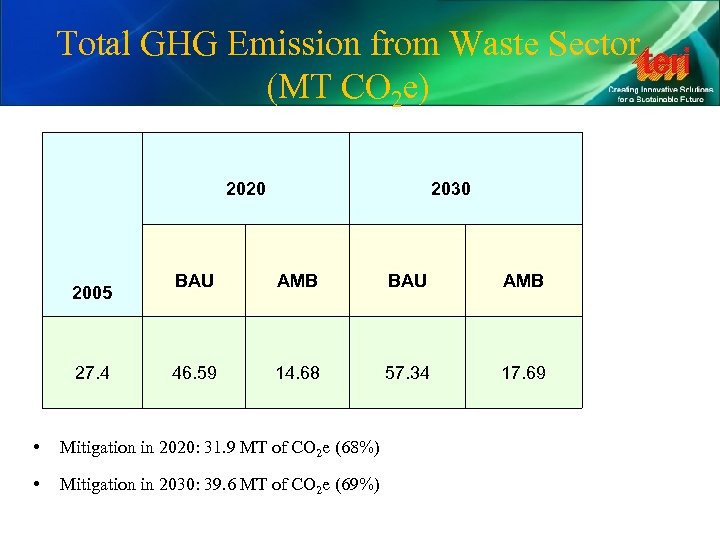 Total GHG Emission from Waste Sector (MT CO 2 e) 2020 2005 27. 4 2030 BAU AMB 46. 59 14. 68 57. 34 17. 69 • Mitigation in 2020: 31. 9 MT of CO 2 e (68%) • Mitigation in 2030: 39. 6 MT of CO 2 e (69%)
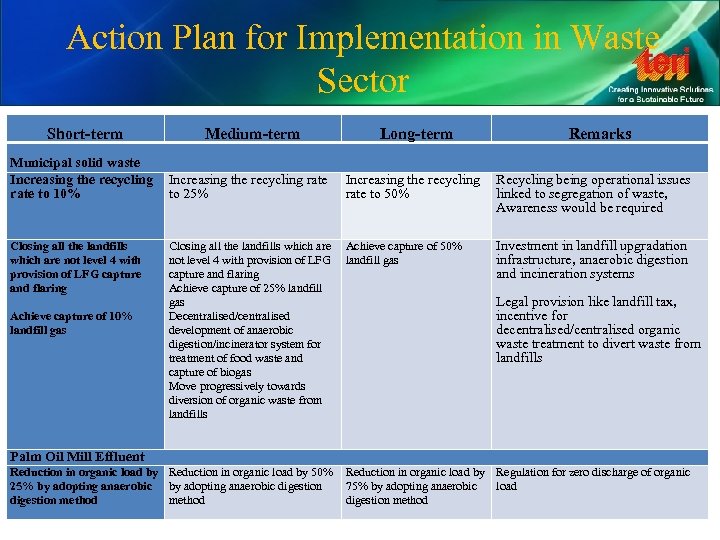 Action Plan for Implementation in Waste Sector Short-term Medium-term Municipal solid waste Increasing the recycling rate to 10% to 25% Closing all the landfills which are not level 4 with provision of LFG capture and flaring Achieve capture of 10% landfill gas Long-term Remarks Increasing the recycling Recycling being operational issues rate to 50% linked to segregation of waste, Awareness would be required Closing all the landfills which are Achieve capture of 50% not level 4 with provision of LFG landfill gas capture and flaring Achieve capture of 25% landfill gas Decentralised/centralised development of anaerobic digestion/incinerator system for treatment of food waste and capture of biogas Move progressively towards diversion of organic waste from landfills Investment in landfill upgradation infrastructure, anaerobic digestion and incineration systems Legal provision like landfill tax, incentive for decentralised/centralised organic waste treatment to divert waste from landfills Palm Oil Mill Effluent Reduction in organic load by 50% Reduction in organic load by Regulation for zero discharge of organic 25% by adopting anaerobic digestion 75% by adopting anaerobic load digestion method
 Land Use, Land-Use Change and Forestry Sector
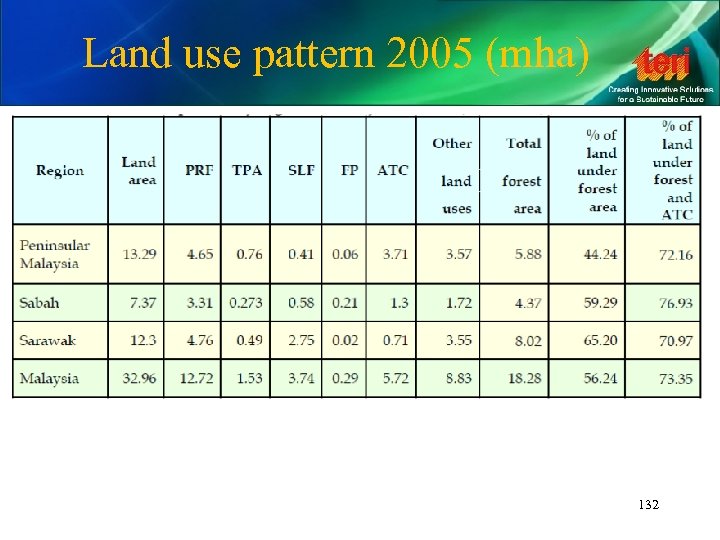 Land use pattern 2005 (mha) 132
 Peat lands • Malaysia is conserving her peat swamp forest and the South Pahang Peat Swamp forest complex is one of the only tropical peat swamp forest in the world remaining intact. • With an estimated 1. 54 million hectares of peat swamp forest still remaining, the management of peat is also crucial to regulate carbon emission levels in Malaysia in future. • Efforts to conserve peat swamps need to be 133 continued & strengthened
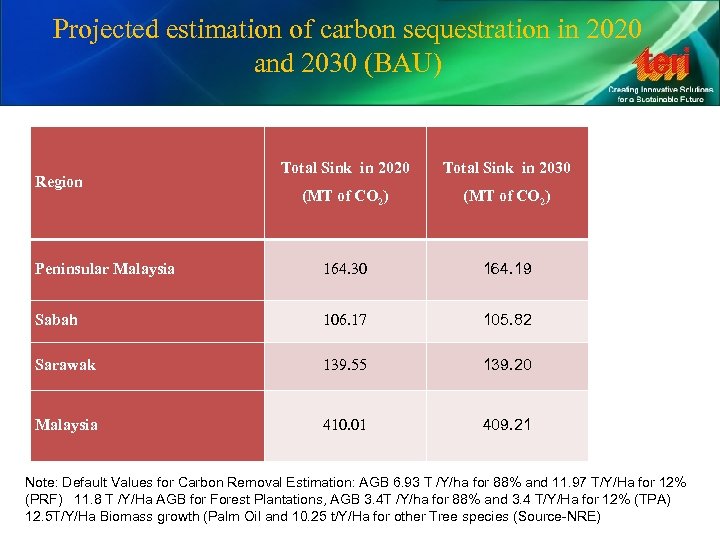 Projected estimation of carbon sequestration in 2020 and 2030 (BAU) Total Sink in 2020 Total Sink in 2030 (MT of CO 2) Peninsular Malaysia 164. 30 164. 19 Sabah 106. 17 105. 82 Sarawak 139. 55 139. 20 Malaysia 410. 01 409. 21 Region Note: Default Values for Carbon Removal Estimation: AGB 6. 93 T /Y/ha for 88% and 11. 97 T/Y/Ha for 12% (PRF) 11. 8 T /Y/Ha AGB for Forest Plantations, AGB 3. 4 T /Y/ha for 88% and 3. 4 T/Y/Ha for 12% (TPA) 12. 5 T/Y/Ha Biomass growth (Palm Oil and 10. 25 t/Y/Ha for other Tree species (Source-NRE)
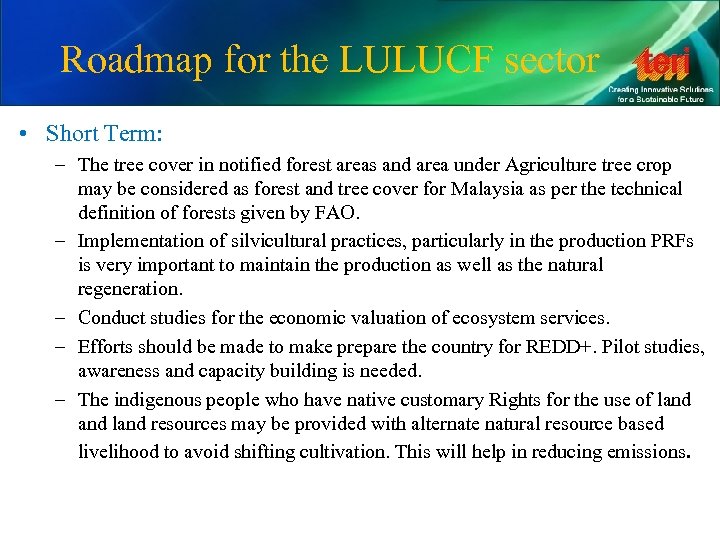 Roadmap for the LULUCF sector • Short Term: – The tree cover in notified forest areas and area under Agriculture tree crop may be considered as forest and tree cover for Malaysia as per the technical definition of forests given by FAO. – Implementation of silvicultural practices, particularly in the production PRFs is very important to maintain the production as well as the natural regeneration. – Conduct studies for the economic valuation of ecosystem services. – Efforts should be made to make prepare the country for REDD+. Pilot studies, awareness and capacity building is needed. – The indigenous people who have native customary Rights for the use of land resources may be provided with alternate natural resource based livelihood to avoid shifting cultivation. This will help in reducing emissions.
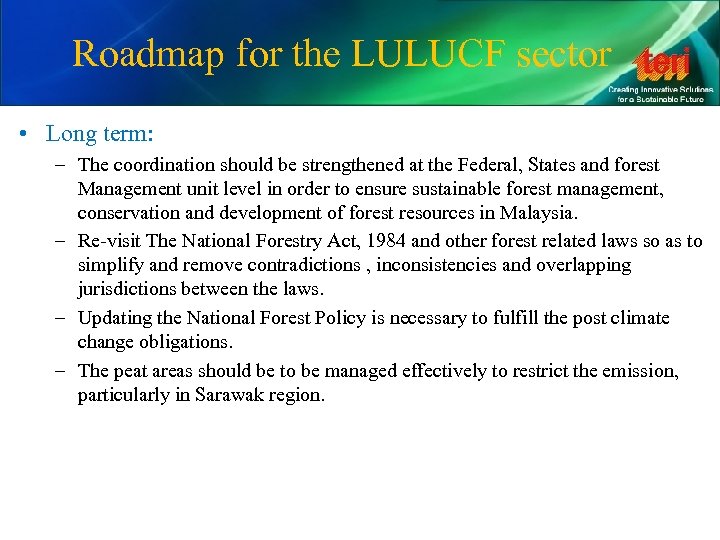 Roadmap for the LULUCF sector • Long term: – The coordination should be strengthened at the Federal, States and forest Management unit level in order to ensure sustainable forest management, conservation and development of forest resources in Malaysia. – Re-visit The National Forestry Act, 1984 and other forest related laws so as to simplify and remove contradictions , inconsistencies and overlapping jurisdictions between the laws. – Updating the National Forest Policy is necessary to fulfill the post climate change obligations. – The peat areas should be to be managed effectively to restrict the emission, particularly in Sarawak region.
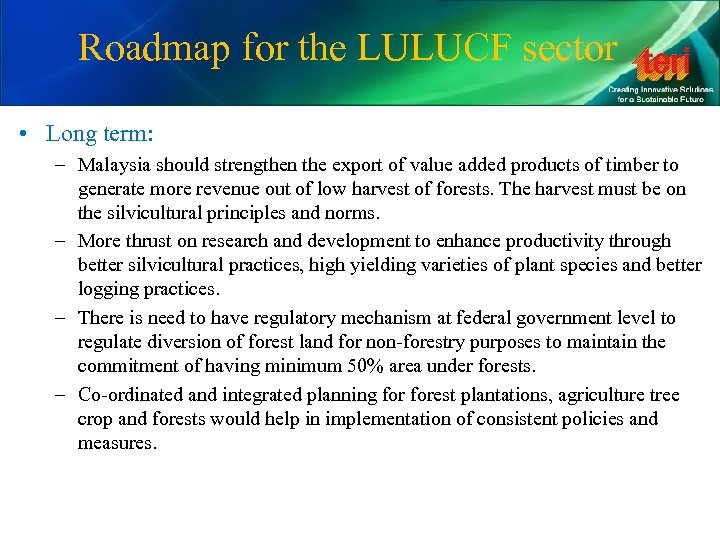 Roadmap for the LULUCF sector • Long term: – Malaysia should strengthen the export of value added products of timber to generate more revenue out of low harvest of forests. The harvest must be on the silvicultural principles and norms. – More thrust on research and development to enhance productivity through better silvicultural practices, high yielding varieties of plant species and better logging practices. – There is need to have regulatory mechanism at federal government level to regulate diversion of forest land for non-forestry purposes to maintain the commitment of having minimum 50% area under forests. – Co-ordinated and integrated planning forest plantations, agriculture tree crop and forests would help in implementation of consistent policies and measures.
 Agriculture Sector
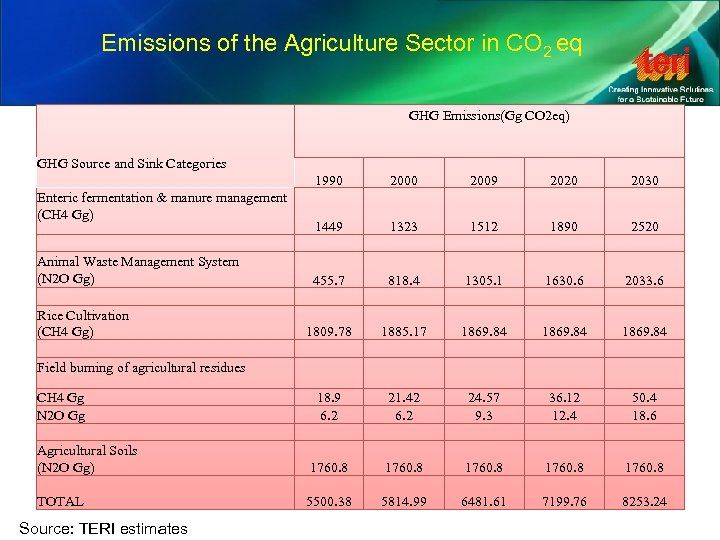 Emissions of the Agriculture Sector in CO 2 eq GHG Emissions(Gg CO 2 eq) GHG Source and Sink Categories 1990 2009 2020 2030 1449 1323 1512 1890 2520 455. 7 818. 4 1305. 1 1630. 6 2033. 6 1809. 78 1885. 17 1869. 84 CH 4 Gg N 2 O Gg Agricultural Soils (N 2 O Gg) 18. 9 6. 2 21. 42 6. 2 24. 57 9. 3 36. 12 12. 4 50. 4 18. 6 1760. 8 TOTAL 5500. 38 5814. 99 6481. 61 7199. 76 8253. 24 Enteric fermentation & manure management (CH 4 Gg) Animal Waste Management System (N 2 O Gg) Rice Cultivation (CH 4 Gg) Field burning of agricultural residues Source: TERI estimates
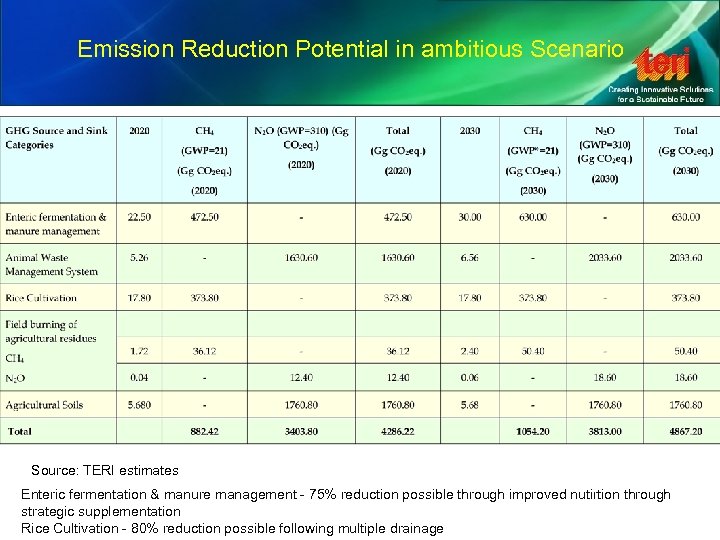 Emission Reduction Potential in ambitious Scenario Source: TERI estimates Enteric fermentation & manure management - 75% reduction possible through improved nutirtion through strategic supplementation Rice Cultivation - 80% reduction possible following multiple drainage
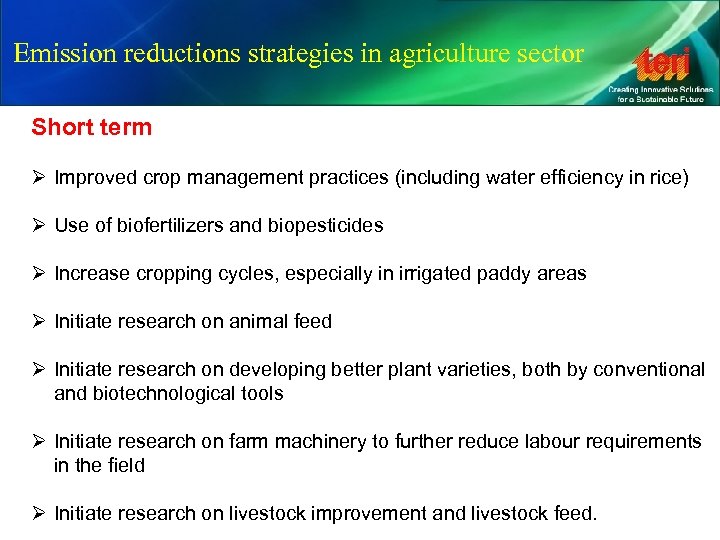 Emission reductions strategies in agriculture sector Short term Ø Improved crop management practices (including water efficiency in rice) Ø Use of biofertilizers and biopesticides Ø Increase cropping cycles, especially in irrigated paddy areas Ø Initiate research on animal feed Ø Initiate research on developing better plant varieties, both by conventional and biotechnological tools Ø Initiate research on farm machinery to further reduce labour requirements in the field Ø Initiate research on livestock improvement and livestock feed.
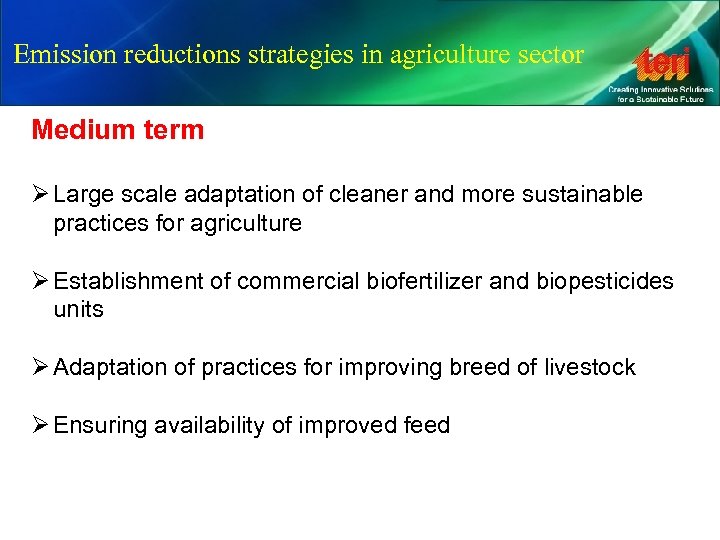 Emission reductions strategies in agriculture sector Medium term Ø Large scale adaptation of cleaner and more sustainable practices for agriculture Ø Establishment of commercial biofertilizer and biopesticides units Ø Adaptation of practices for improving breed of livestock Ø Ensuring availability of improved feed
 Emission reductions strategies in agriculture sector Long term Ø Large scale adaptation of cleaner and more sustainable practices for agriculture Ø Adaptation of crop Developing varieties which are: Ø High yielding Ø Varieties that utilizes resources (water and nutrients) more efficiently Ø Large scale adaptation of improved varieties of livestock and improved feed Ø Greater degree of farm mechanization Ø Adopting multiple cropping pattern
 Overall Roadmap
 Prioritizing Mitigation Efforts • There exist several opportunities or “low hanging fruits” especially on the energy demand side to provide a facilitative environment for efficiency improvement across sectors • On the other hand, solutions that involve changing supply side technologies or using alternative fuels involve a significant gestation period and a switch towards such options should necessarily be preceded by adequate due diligence, investment of time and resources in R&D and skill enhancement, and in setting up of appropriate supportive policy and regulatory changes • The prioritization tries to keep under consideration the goals of economic growth and development that Malaysia has envisaged and our understanding of the status of R&D, technology, finance and institutional capacities across each of the sectors • Actions in each of the sectors have been categorized across four areas: – – Research, Development and Innovation Technology Development Finance and Investment Institutions
 Research, Development and Innovation
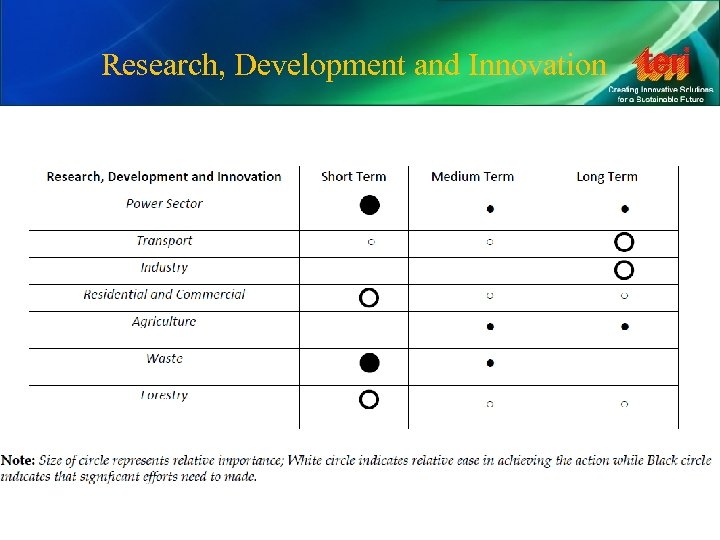
 Research, Development and Innovation • Efforts to be made with a sense of urgency in the power & waste sectors in the short term • Technologies available in the transport sector, but need to be incorporated over time – R&D /innovation relevant in the long term especially w. r. t alternative fuels • Innovative measures to be taken up in Residential and Commercial sector, especially in the use of renewable energy (solar) and • Agriculture sector as such is assigned relatively low priority from mitigation perspective /in terms of R&D needs, but efforts needed to improve practices such as livestock and manure management in medium term • Forestry – important, though solutions are known
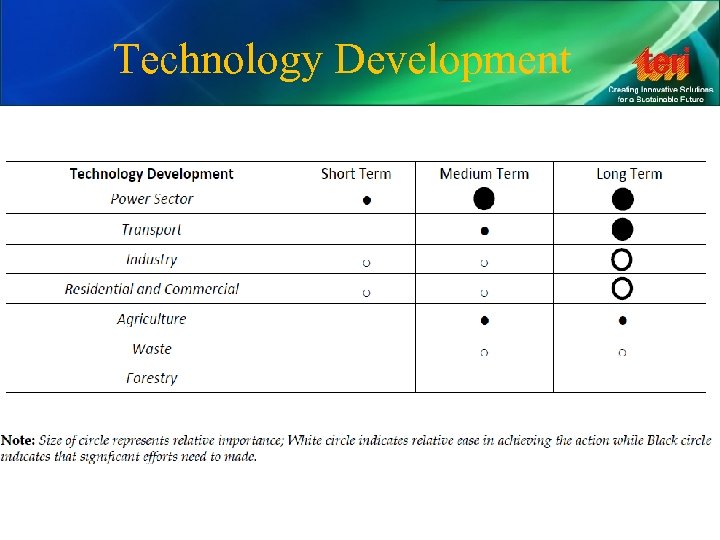 Technology Development
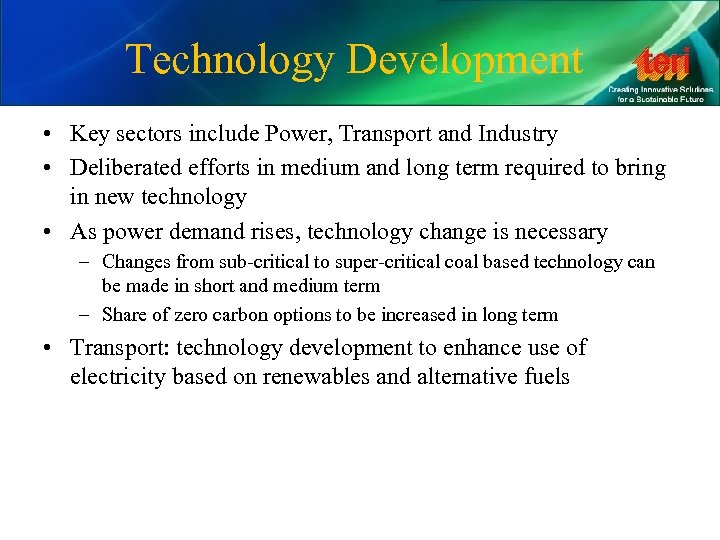 Technology Development • Key sectors include Power, Transport and Industry • Deliberated efforts in medium and long term required to bring in new technology • As power demand rises, technology change is necessary – Changes from sub-critical to super-critical coal based technology can be made in short and medium term – Share of zero carbon options to be increased in long term • Transport: technology development to enhance use of electricity based on renewables and alternative fuels
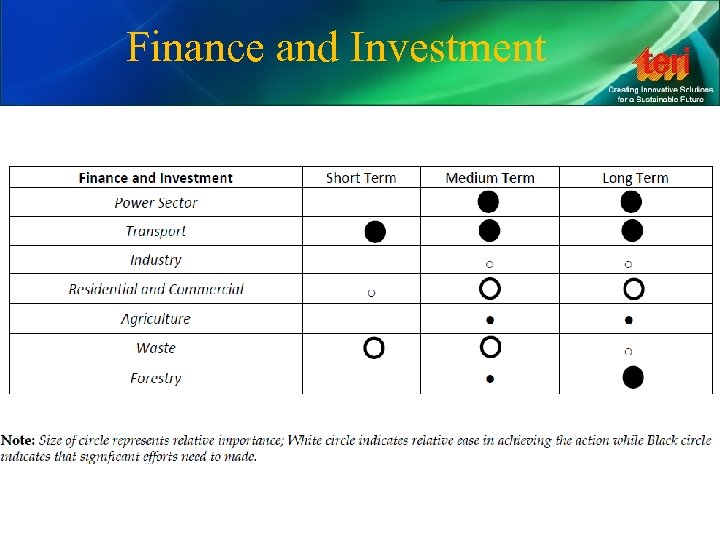 Finance and Investment
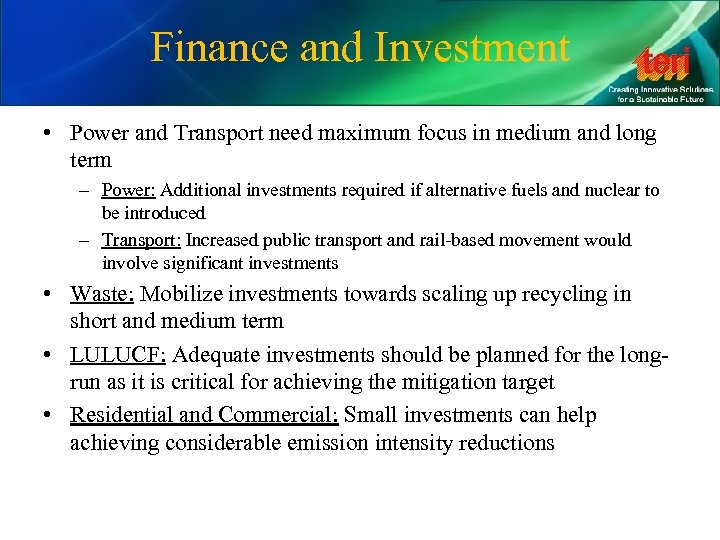 Finance and Investment • Power and Transport need maximum focus in medium and long term – Power: Additional investments required if alternative fuels and nuclear to be introduced – Transport: Increased public transport and rail-based movement would involve significant investments • Waste: Mobilize investments towards scaling up recycling in short and medium term • LULUCF: Adequate investments should be planned for the longrun as it is critical for achieving the mitigation target • Residential and Commercial: Small investments can help achieving considerable emission intensity reductions
 Thanks!


