

458de65f391828bc10c45fbb43b9fde6.ppt
- Количество слайдов: 25
 Elkhorn Slough Water quality Programs Trends and Concerns
 ESNERR WQ Monitoring Program-Volunteer Sites Sample Monthly 1989 – Present Params by Probe (DO, Temp, Sal, p. H, Turb, Chl) & Nutrients (Nitrate, Phosphate Ammoinium)
 –") ESNERR WQ Monitoring Program-NERR Sites Sample every 15 mins; 1995 (AP & SM) – Present Params by probe (Depth, DO, Temp, Sal, p. H, Turb) & Monthly Nutrients (Nitrate, Phosphate Ammoinium)
ESNERR WQ Monitoring Program-NERR Sites Sample every 15 mins; 1995 (AP & SM) – Present Params by probe (Depth, DO, Temp, Sal, p. H, Turb) & Monthly Nutrients (Nitrate, Phosphate Ammoinium)
 Even the mouth of the Estuary goes below the 5 mg/L target
 As we move up the slough DO gets worse and worse
 Azevedo Pond below 5 mg/L almost year round, hypoxic <2. 3 mg/L summer and fall
 Nitrate mg/L Nutrient pollution varies by region 5. 0 4. 0 3. 0 2. 0 1. 0 0. 0 Lower Slough Nitrate mg/L 1989 1990 1991 1992 1993 1994 1995 1996 1997 1998 1999 2000 2001 2002 2003 2004 2005 2006 2007 2008 2009 2010 2011 3. 5 3. 0 2. 5 2. 0 1. 5 1. 0 0. 5 0. 0 Reserve (Mid Slough) Nitrate mg/L 1989 1990 1991 1992 1993 1994 1995 1996 1997 1998 1999 2000 2001 2002 2003 2004 2005 2006 2007 2008 2009 2010 2011 50 40 30 20 10 0 Salinas River Nitrate mg/L 1989 1990 1991 1992 1993 1994 1995 1996 1997 1998 1999 2000 2001 2002 2003 2004 2005 2006 2007 2008 2009 2010 2011 9. 0 8. 0 7. 0 6. 0 5. 0 4. 0 3. 0 2. 0 1. 0 0. 0 Upper Slough 1989 1990 1991 1992 1993 1994 1995 1996 1997 1998 1999 2000 2001 2002 2003 2004 2005 2006 2007 2008 2009 2010 2011
 Salinas River sites Annual Average 2002 -2009 60 Nitrate mg/L 50 40 30 20 10 0 2002 2003 2004 2005 2006 2007 2008 2009
 Nitrate concentrations mg NOx/L Comparison of means of all available data by Reserve and Station, 2006– 2011 OWC takes the prize highest average nitrate NERR range. 02 – 2. 7 mg/L
 Nitrate concentrations mg NOx/L Comparison of means of all available data by Reserve and Station, 2006– 2011 Salinas River Sites Average 22 mg/L 10 X higher than Highest NERR site in Country
 Chl by YSI probe ug/L Chl by tidal exchange in the Estuary Low Moderate High Hyper 20 18 16 14 12 10 8 6 4 2 0 Full Tidal Exchange 2001 2002 2003 2004 2005 2006 2007 2008 2009 2010 2011 Muted Tidal Exchange 70 60 50 40 30 20 10 0 2001 2002 2003 2004 2005 2006 2007 Minimal Tidal Exchange 100 90 80 70 60 50 40 30 20 10 0 2001 2002 2003 2004 2005 2006 2007
 EUTROPHICATION: anoxic sediment A much narrower layer at the top of the mud is well oxygenated at muted vs. full tidal sites
 EUTROPHICATION: dissolved oxygen Greater variation with less tidal exchange b b a a b b
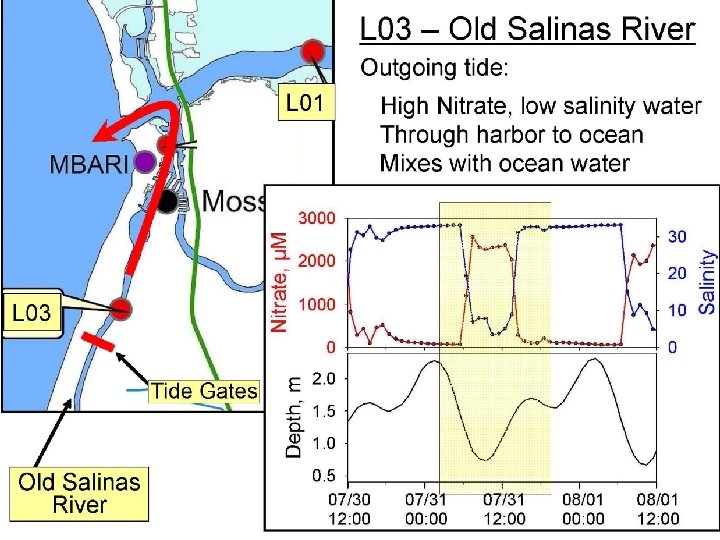
 Nitrate 900 800 700 µM 600 500 400 300 200 100 0 70 72 74 76 78 80 82 84 86 88 90 92 94 96 98
 How different are the NERR sites? Comparison of means of all available data by Reserve and Station, 2002 – 2006/7 OWC WEL DEL PDB HUD CBM WKB APA SFB TJR SOS CBV JAC GRB ELK KAC NOC WQB NIW ACE NAR GND SAP GTM RKB JOB 0. 001 http: //nerrs. noaa. gov 0. 01 0. 1 mg NOx L-1 1 10
 Annual Hypoxia from two NERR stations Azevedo Pond South Marsh AVIRIS photo, John Ryan, MBARI
 Average Hypoxia by site per month 45 40 35 Percent Hypoxic 30 APN NM 25 SM VM 20 BSW RSM 15 10 5 0 1 2 3 4 5 6 7 Month 8 9 10 11 12
 Data from Ken Johnson 2010


 Tidal range vs % time hypoxic Figure 5. Maximum tidal exchange v. % time hypoxic
 How different are the NERR sites? Comparison of means of all available data by Reserve and Station, 2002 – 2006/7 WEL WKB CBM OWC DEL WQB ACE MAR CBV TJR ELK APA SAP NIW SFB GND GRB PDB NOC HUD RKB GTM JAC SOS JOB KAC NAR http: //nerrs. noaa. gov 0. 1 1. 0 mg Chl a 10 L-1 100
 Summary take home messages