

41ce6b7ba86292eb59953517ae24bb04.ppt
- Количество слайдов: 52
 Effects of Crop Insurance and Government Payments on Annual Financial Risk Bruce A. Babcock Center for Agricultural and Rural Development www. card. iastate. edu Presented to the Boone County Marketing Club, February 10, 2005
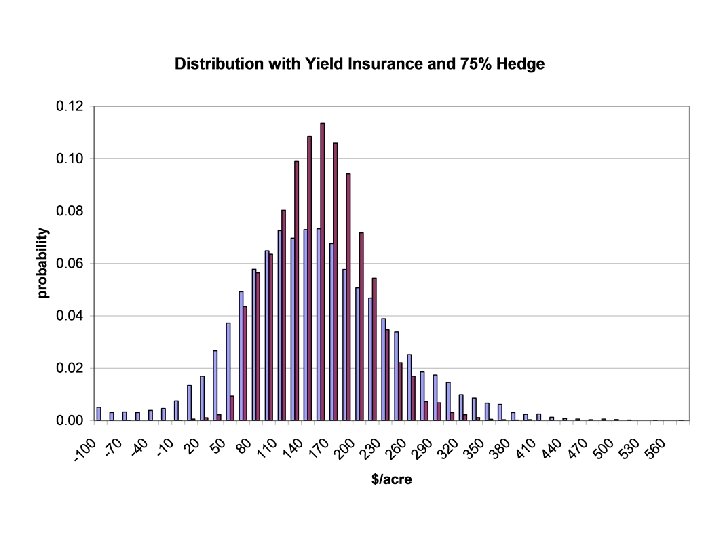
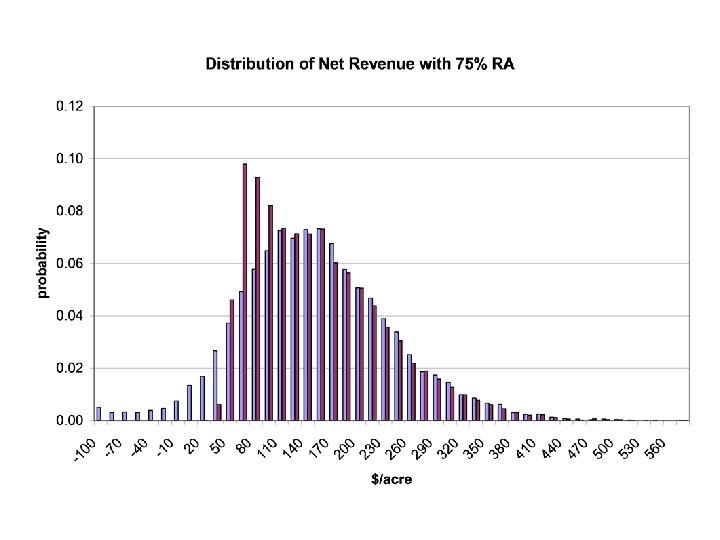
 Talk Outline • How are option premiums determined? • Effects of hedges, puts, and insurance on risk • How do commodity programs affect risk? • How much risk is left over to reward management? • Discussion
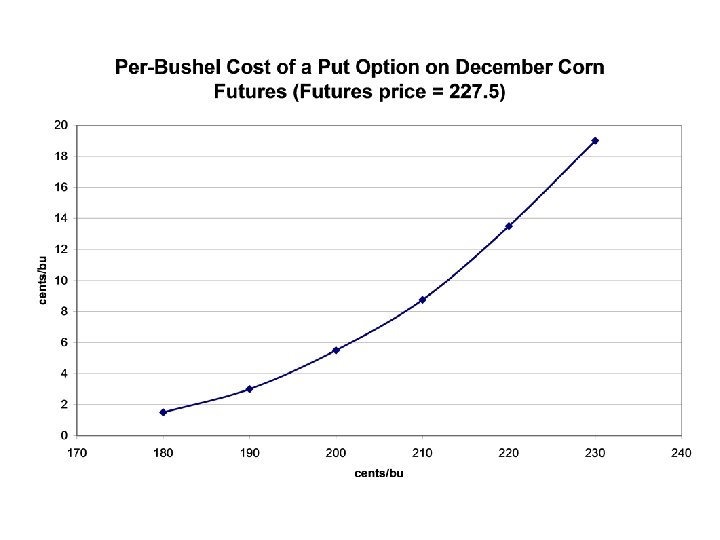
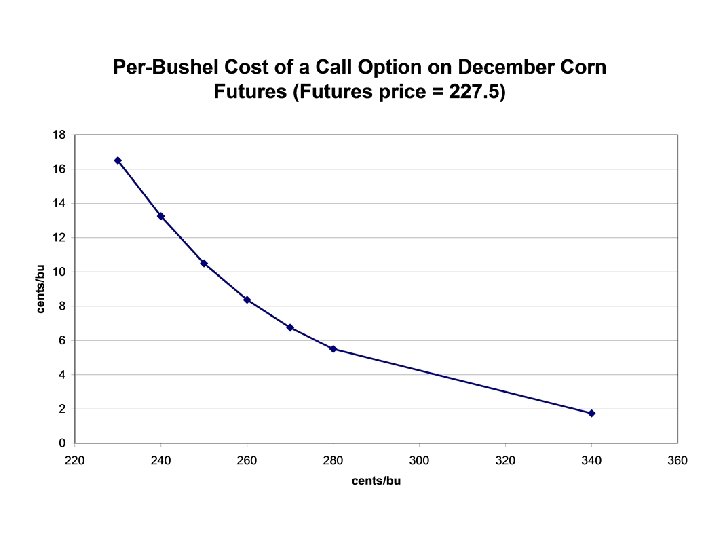
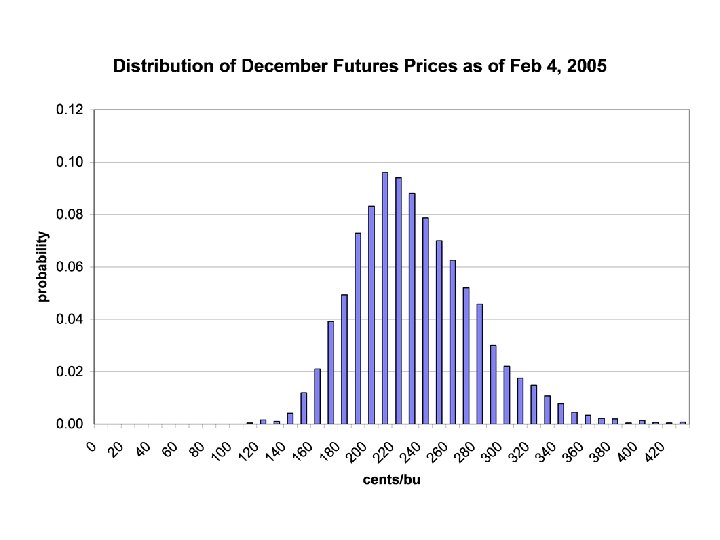
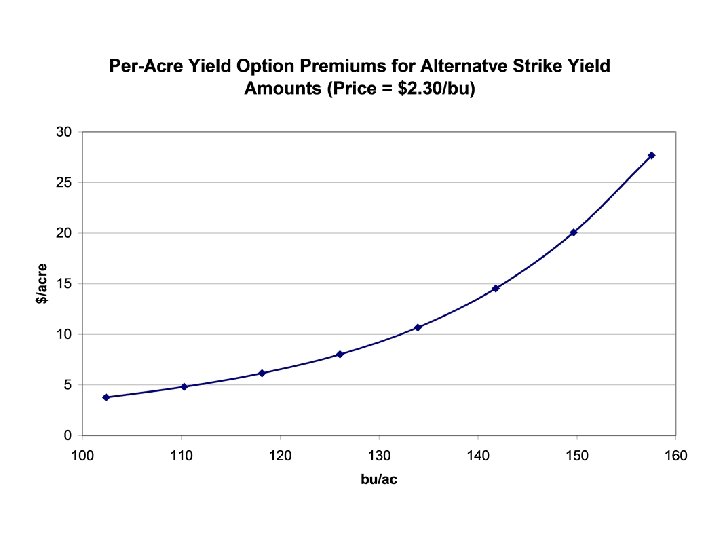
 What is the strike price? What is the probability of a particular price outcome? 5. 2% chance that price is between $1. 70 and $1. 80 What is the option payoff if that price occurs? $0. 55 $2. 30 Multiply the probability by the payoff at that price. . 052 x. 55 = $0. 0286 Repeat for all outcomes
 Summing up all outcomes: $0. 19 for a $2. 30 put option

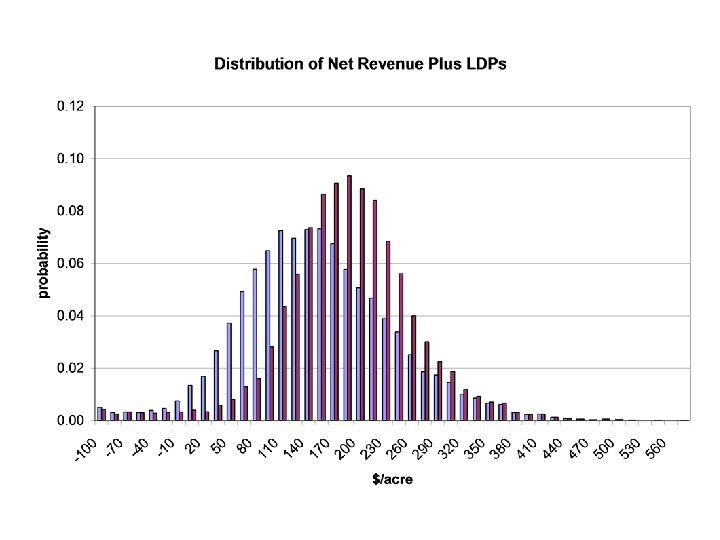
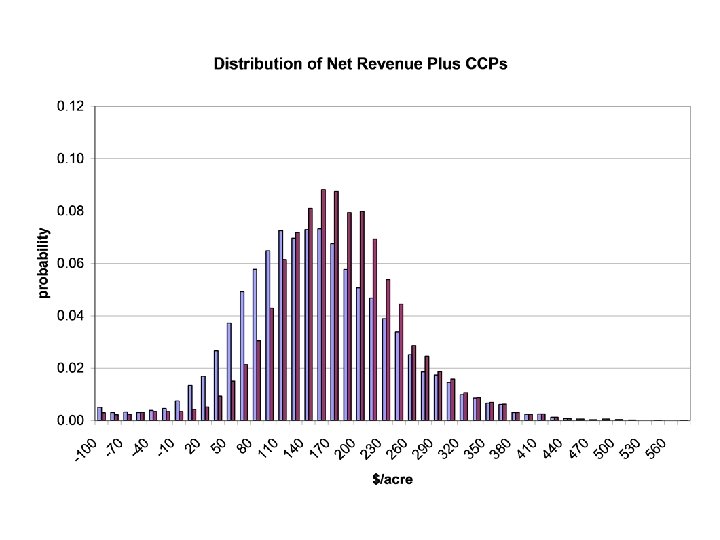
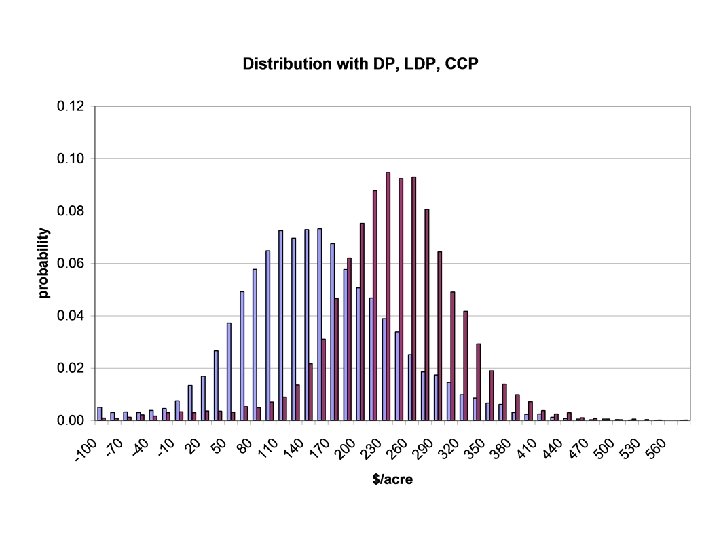
 Structure of Program Payments for Corn Target Price Not Tied To Prod Req. $2. 63 Regardless Of Market Fixed Payment Counter-Cyclical Payment Loan Rate $0. 28 $2. 35 Only If… Loan Deficiency Payment $1. 95
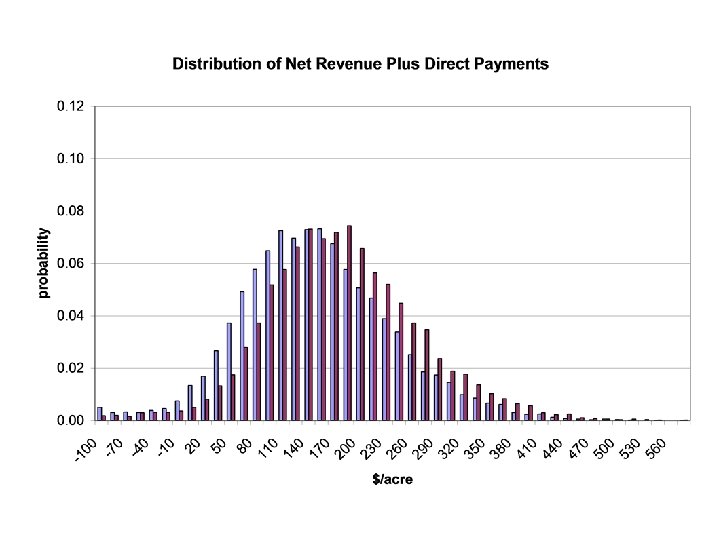
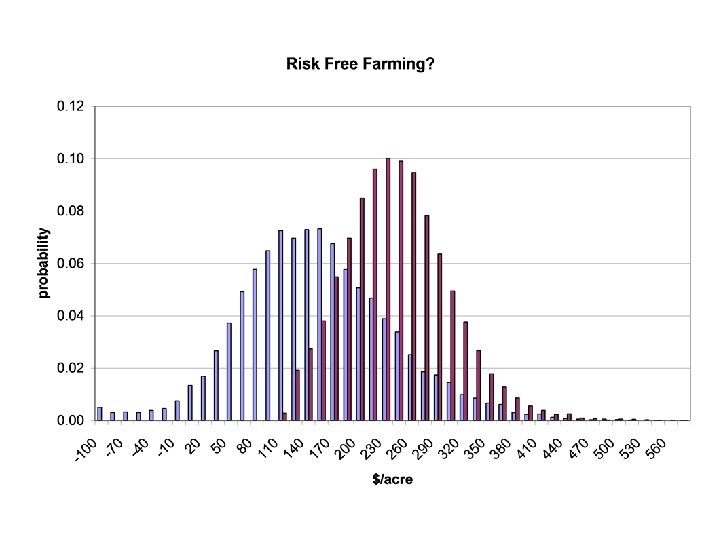
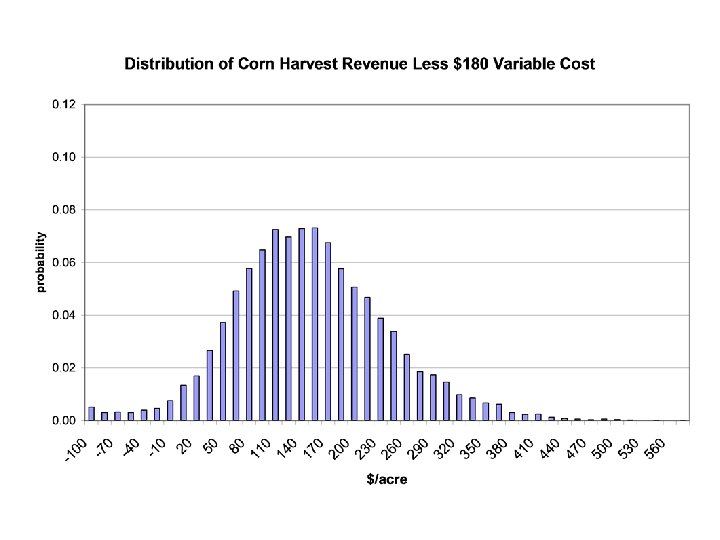
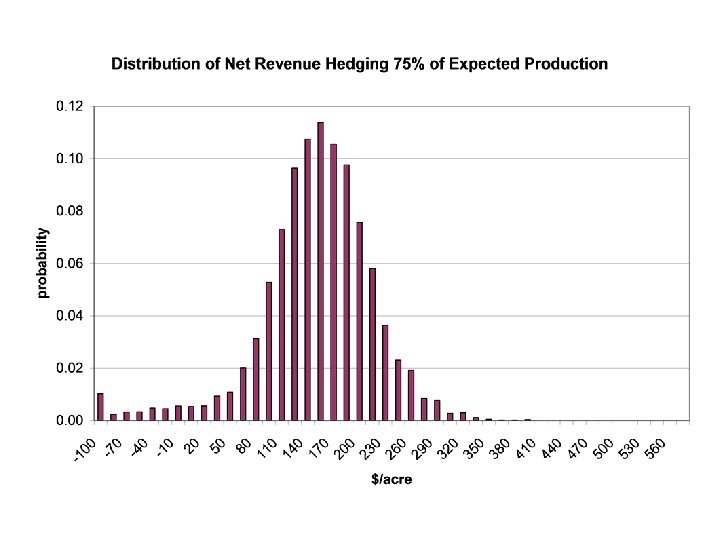
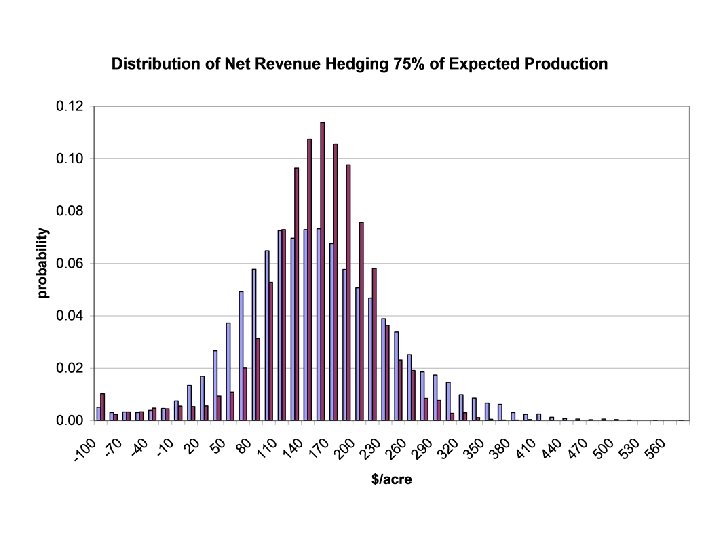
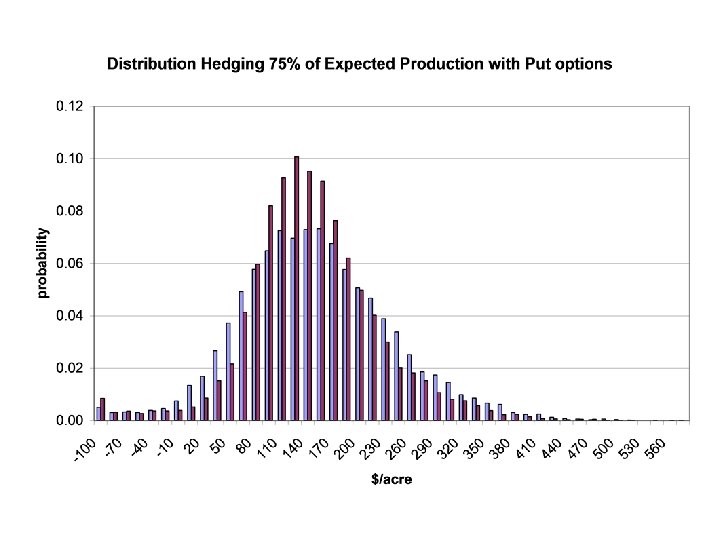
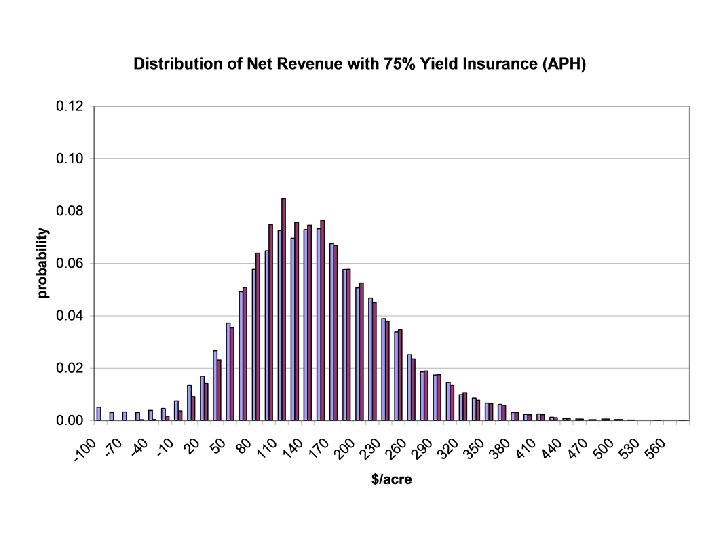
 Reduced Risk • With no insurance or government programs: – Average return over variable cost = $143/ac – 3. 8% probability of not covering $180 variable cost • With all government programs and insurance: – Average returns over variable cost = $235/ac – 5. 6% probability that returns are less than $143/ac
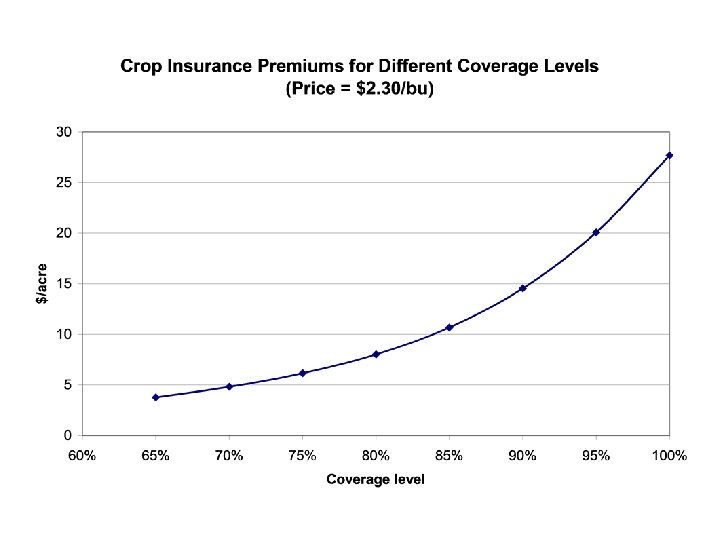
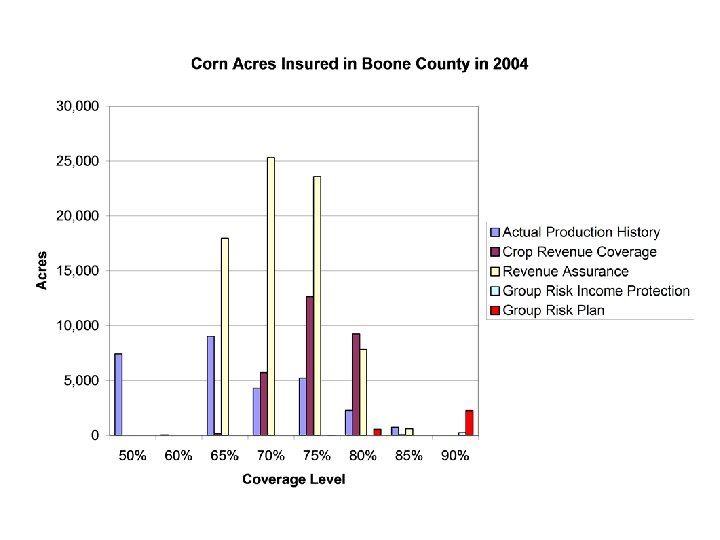
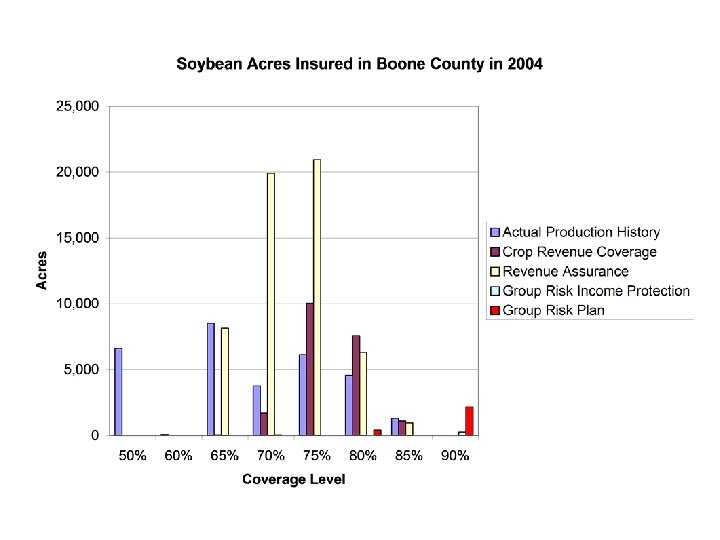
 Costs of Benefits of Crop Insurance Decisions • What product to buy? – APH, RA-HPO, CRC, GRP, GRIP-HRO • What coverage level to buy? – CAT, 65%, 70%, 75%, 80%, 85% • What unit structure to use? – (optional, basic, enterprise, whole-farm)
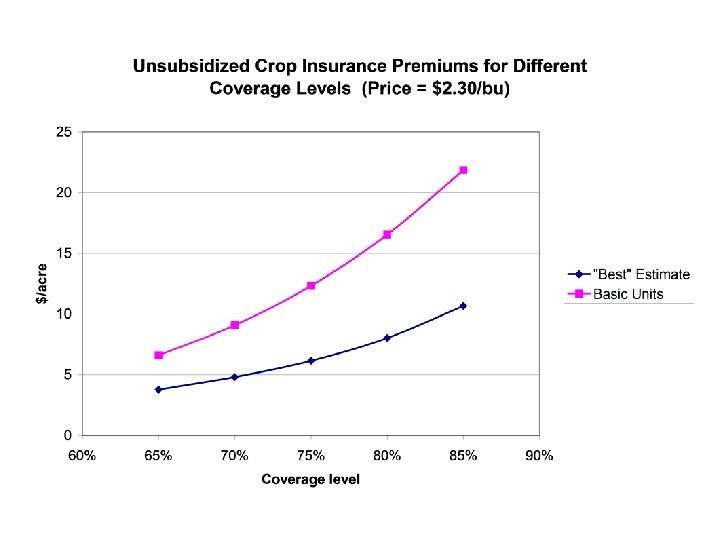
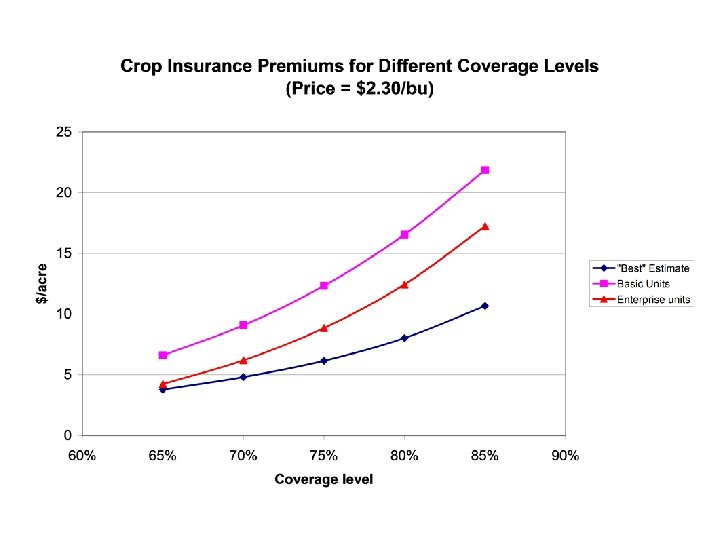
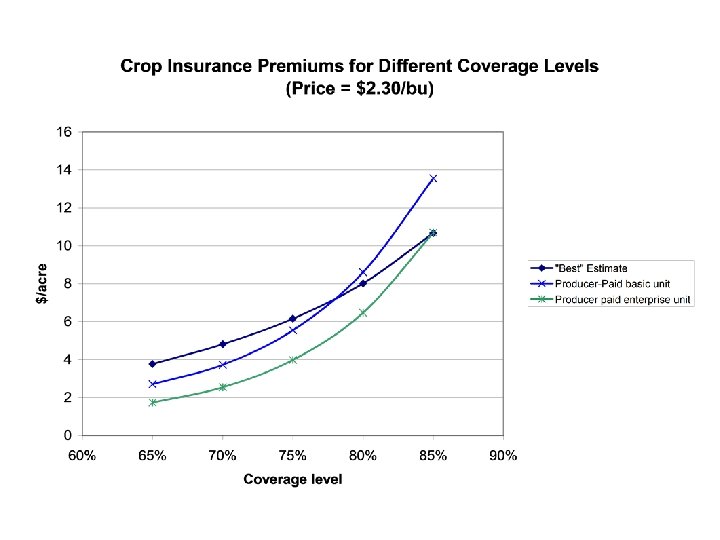
 Effects of Coverage and Unit Structure on Premium
 Change in Expected Indemnity Optional Enterprise Whole-Farm 65% to 75% 9, 845 7, 880 7, 830 75% to 85% 15, 884 12, 185 11, 600 Change in Producer Premium Optional Enterprise Whole-Farm 4, 685 3, 728 3, 621 12, 684 9, 667 8, 938
 Expected rate of return from increasing coverage 65% to 75% Optional Enterprise Whole-Farm 75% to 85% 110% 111% 116% 25% 26% 30%
 Expected rate of return to changing unit structure Whole-Farm to Enterprise to Optional 65% 144% 75% 122% 124% 85% 61%
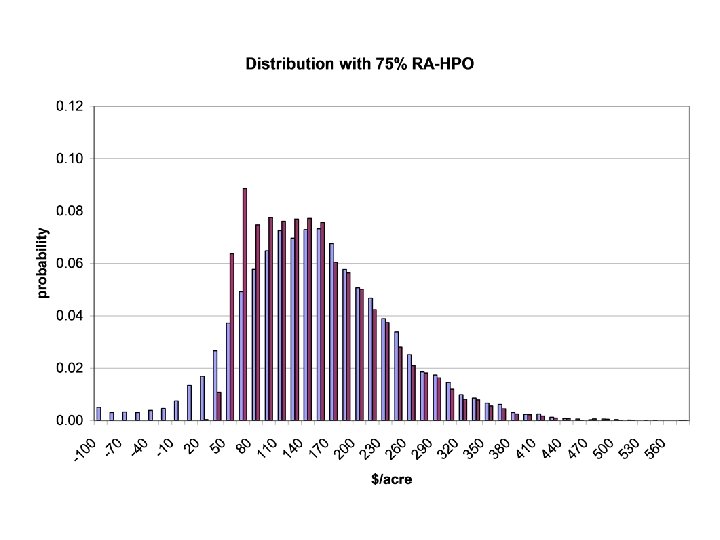
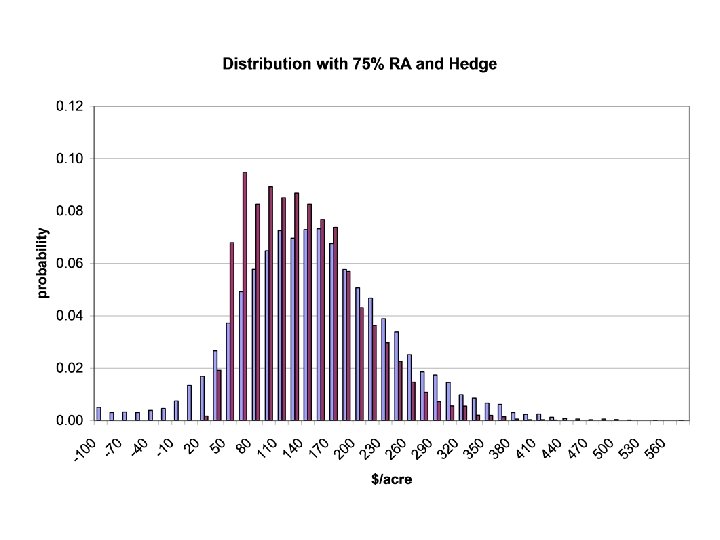
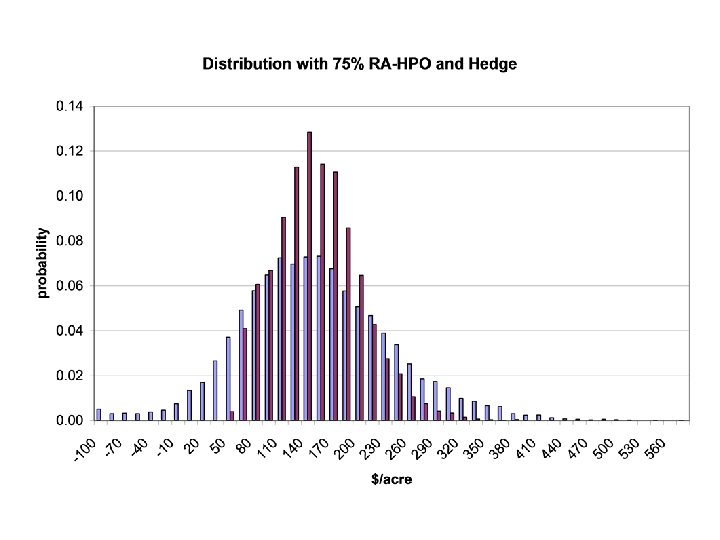
 Distribution of Returns by Unit Structure
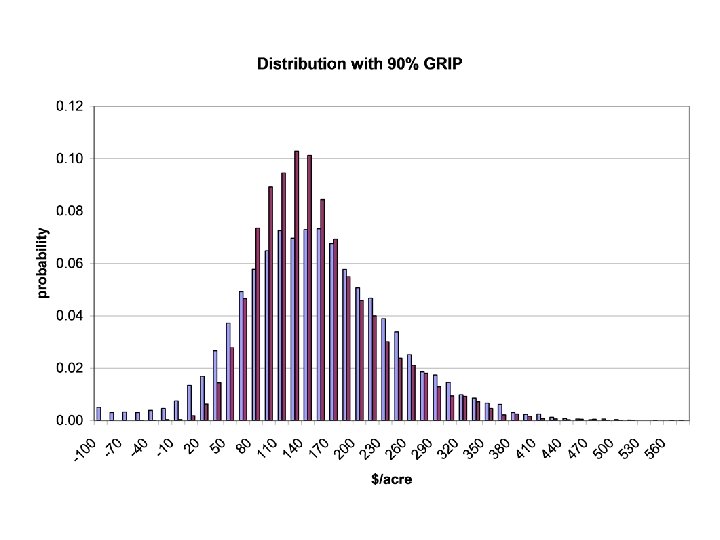
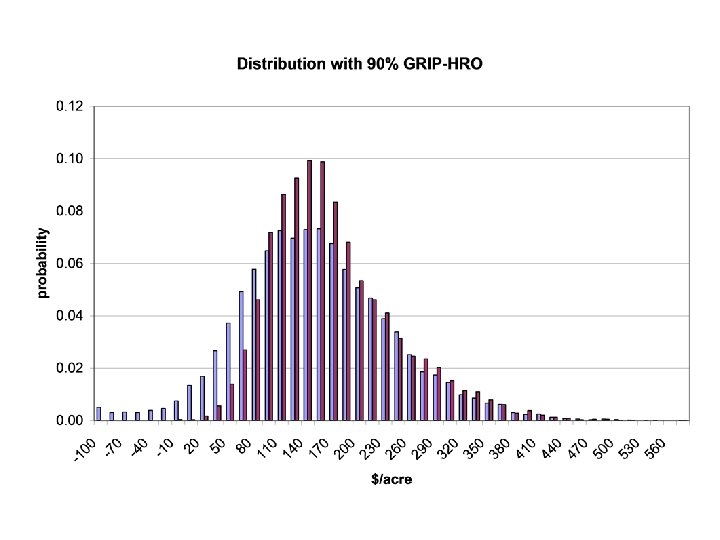
 GRIP and GRIP-HRO • GRIP guarantee = Factor*CBOT Springtime Price*Expected County Yield • GRIP-HRO guarantee = Factor*CBOT Fall or Spring Price*Expected County Yield Factor lies between 0. 6 and 1. 5.
 Who Should Buy GRIP? • Farmers who do not have a representative APH yield • Farmers who are lower risk than that assumed in APH program • Farmers with yields that are highly correlated with county yields
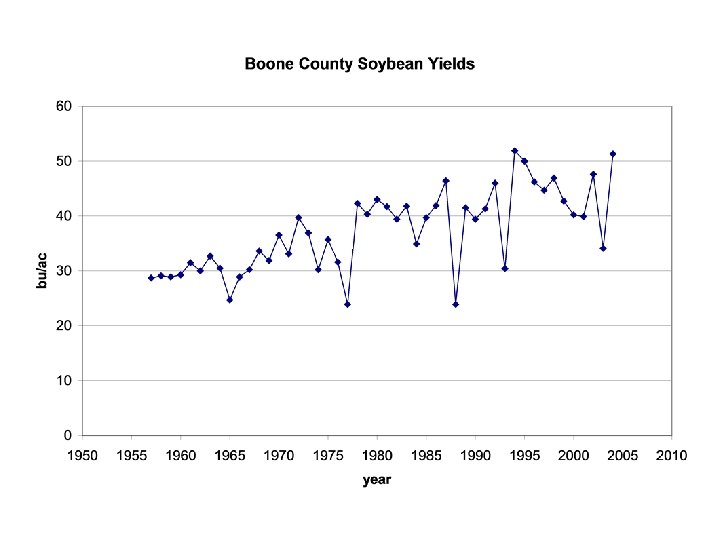
") GRIP and GRIP-HRO in Boone County (Expected Yield = 167. 5 bu/ac)
GRIP and GRIP-HRO in Boone County (Expected Yield = 167. 5 bu/ac)
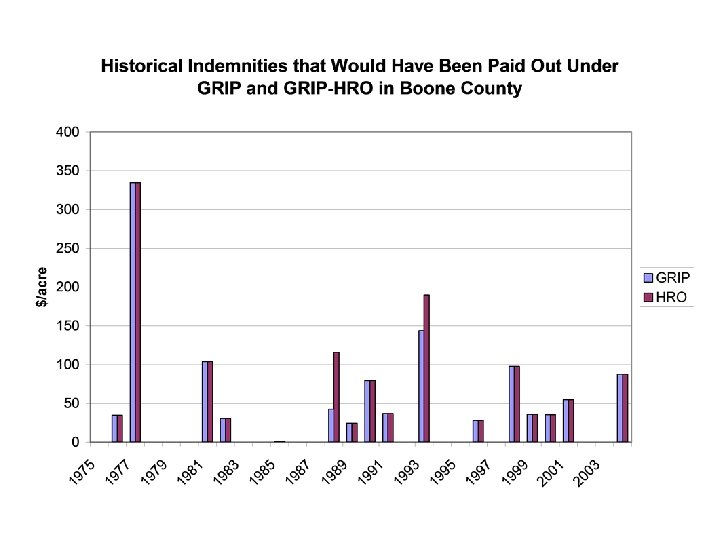
 Payoff from GRIP and GRIP-HRO • Total payout = 7. 5% of liability for GRIP and 8. 2% of liability for HRO from 1975 to 2004. • Premium rate = 5. 89% of liability from GRIP and 7. 4% of liability from GRIP-HRO. • Since 1975, rate of return = 26. 5% for GRIP and 11. 1% for HRO.
 Subsidized rate of return for GRIP and GRIP-HRO • 2005 Premium = $15/acre for GRIP and $18 for GRIP-HRO • Expected Payout from 1975 to 2004: $42 for GRIP and $47 for HRO • Expected Payout from 1957 to 2004: $34 and $42. • Expected return = $25 or $19 per acre for GRIP, $29 or $24 per acre for HRO.
 Impact of Proposed Changes to Marketing Loan Program
 www. card. iastate. edu • Discussion