

31566c9a63701f0eb5effa33cf9e007e.ppt
- Количество слайдов: 39
 EE 663 -Digital Image Processing & Analysis Dr. Samir H. Abdul-Jauwad Electrical Engineering Department King Fahd University of Petroleum & Minerals
 • Computer Vision • Low") Definitions • Image Processing • Image Analysis (Image Understanding) • Computer Vision • Low Level Processes: contrast manipulation • Mid-Level Processes: segmentation, recognition • High Level Processes: understanding groups of objects
Definitions • Image Processing • Image Analysis (Image Understanding) • Computer Vision • Low Level Processes: contrast manipulation • Mid-Level Processes: segmentation, recognition • High Level Processes: understanding groups of objects
 Initial Examples of Imagery
 Improvement
 Digital Image Processing
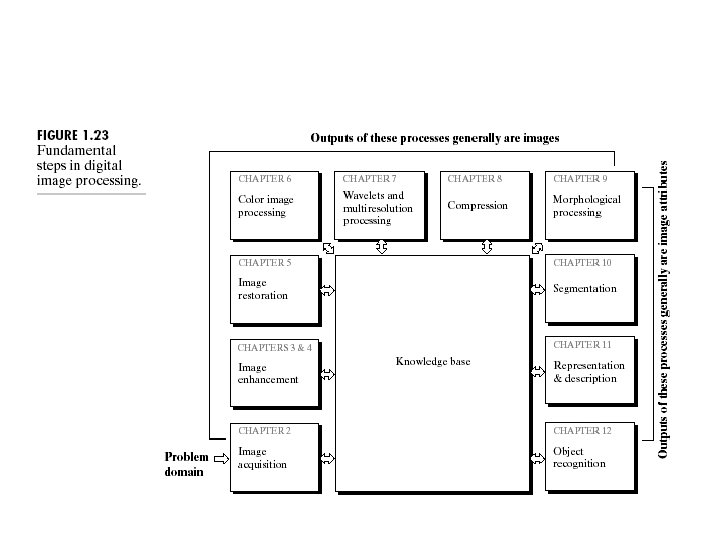
 Important Stages in Image Processing • • • Image Acquisition Preprocessing Segmentation Representation and Description Recognition and Interpretation Knowledge base
 Important Stages in Image Processing
 Image Acquisition • Imaging sensor & capability to digitize the signal collected by the sensor – Video camera – Digital camera – Conventional camera & analog-to-digital converter
 Preprocessing • To improve the image to ensure the success of further processes • e. g. enhancing contrast removing noise identifying information-rich areas
 – Autonomous segmentation") Segmentation • To partition the image into its constituent parts (objects) – Autonomous segmentation (very difficult) • Can facilitate or disturb subsequent processes – Output (representation): • Raw pixel data, depicting either boundaries or whole regions (corners vs. texture for example) • Need conversion to a form suitable for computer processing – (Description)
Segmentation • To partition the image into its constituent parts (objects) – Autonomous segmentation (very difficult) • Can facilitate or disturb subsequent processes – Output (representation): • Raw pixel data, depicting either boundaries or whole regions (corners vs. texture for example) • Need conversion to a form suitable for computer processing – (Description)
 deals with extracting: – features that result") Representation & Description • Feature selection (description) deals with extracting: – features that result in quantitative information of interest or – features that are important for differentiating one class of objects from another
Representation & Description • Feature selection (description) deals with extracting: – features that result in quantitative information of interest or – features that are important for differentiating one class of objects from another
 Recognition & Interpretation • To assign a label to an object based on information provided by the descriptors • To assign meaning to a group of recognized objects
 Knowledge Base • Knowledge database – Guides the operation of each processing module and controls the interaction between modules
 Comments • Image enhancement for human visual interpretation usually stops at preprocessing • Recognition and interpretation are associated with image analysis applications where the objective is automation (automated extraction of information from images)
 Components
 Human Visual Perception
 The Human Eye • Diameter: 20 mm • 3 membranes enclose the eye – Cornea & sclera – Choroid – Retina
 The Choroid • The choroid contains blood vessels for eye nutrition and is heavily pigmented to reduce extraneous light entrance and backscatter. • It is divided into the ciliary body and the iris diaphragm, which controls the amount of light that enters the pupil (2 mm ~ 8 mm).
 The Lens • The lens is made up of fibrous cells and is suspended by fibers that attach it to the ciliary body. • It is slightly yellow and absorbs approx. 8% of the visible light spectrum.
 The Retina • The retina lines the entire posterior portion. • Discrete light receptors are distributed over the surface of the retina: – cones (6 -7 million per eye) and – rods (75 -150 million per eye)
 Cones • Cones are located in the fovea and are sensitive to color. • Each one is connected to its own nerve end. • Cone vision is called photopic (or bright-light vision).
 Rods • Rods are giving a general, overall picture of the field of view and are not involved in color vision. • Several rods are connected to a single nerve and are sensitive to low levels of illumination (scotopic or dim-light vision).
 Receptor Distribution • The distribution of receptors is radially symmetric about the fovea. • Cones are most dense in the center of the fovea while rods increase in density from the center out to approximately 20% off axis and then decrease.
 Cones & Rods
 but can") The Fovea • The fovea is circular (1. 5 mm in diameter) but can be assumed to be a square sensor array (1. 5 mm x 1. 5 mm). • The density of cones: 150, 000 elements/mm 2 ~ 337, 000 for the fovea. • A CCD imaging chip of medium resolution needs 5 mm x 5 mm for this number of elements
The Fovea • The fovea is circular (1. 5 mm in diameter) but can be assumed to be a square sensor array (1. 5 mm x 1. 5 mm). • The density of cones: 150, 000 elements/mm 2 ~ 337, 000 for the fovea. • A CCD imaging chip of medium resolution needs 5 mm x 5 mm for this number of elements
 Image Formation in the Eye • The eye lens (if compared to an optical lens) is flexible. • It gets controlled by the fibers of the ciliary body and to focus on distant objects it gets flatter (and vice versa).
 Image Formation in the Eye • Distance between the center of the lens and the retina (focal length): – varies from 17 mm to 14 mm (refractive power of lens goes from minimum to maximum). • Objects farther than 3 m use minimum refractive lens powers (and vice versa).
 Image Formation in the Eye • Example: – Calculation of retinal image of an object
 Image Formation in the Eye • Perception takes place by the relative excitation of light receptors. • These receptors transform radiant energy into electrical impulses that are ultimately decoded by the brain.
 Brightness Adaptation & Discrimination • Range of light intensity levels to which HVS (human visual system) can adapt: on the order of 1010. • Subjective brightness (i. e. intensity as perceived by the HVS) is a logarithmic function of the light intensity incident on the eye.
 Brightness Adaptation & Discrimination • The HVS cannot operate over such a range simultaneously. • For any given set of conditions, the current sensitivity level of HVS is called the brightness adaptation level.
 Brightness Adaptation & Discrimination • The eye also discriminates between changes in brightness at any specific adaptation level. Where: Ic: the increment of illumination discriminable 50% of the time and I : background illumination
 Brightness Adaptation & Discrimination • Small values of Weber ratio mean good brightness discrimination (and vice versa). • At low levels of illumination brightness discrimination is poor (rods) and it improves significantly as background illumination increases (cones).
 Brightness Adaptation & Discrimination • The typical observer can discern one to two dozen different intensity changes – i. e. the number of different intensities a person can see at any one point in a monochrome image
 Brightness Adaptation & Discrimination • Overall intensity discrimination is broad due to different set of incremental changes to be detected at each new adaptation level. • Perceived brightness is not a simple function of intensity – Scalloped effect, Mach band pattern – Simultaneous contrast
 Perceived Brightness
 Simultaneous Contrast
 Illusions