

248cd046692c252421d7e8733b6f0e75.ppt
- Количество слайдов: 37
 Economics 175 American Economic History
 Contact Information • • Email: Nancy. Virts@csun. edu Phone: 818 -677 -2462 Office: JH 3125 Office Hours: Tuesday and Thursday 1 -2, Thursday 6 -7 and by appointment
 Contact • My website can be found through the Econ Dept website under faculty. • It has class syllabus , readings and other course materials • I will post any powerpoints of lectures used • I will contact you by University Email
 Class rules • DO NOT DISRUPT THE CLASS IN ANY WAY – No Talking – No Cell Phones – Computers may be used only to look at class material – No Reading of Other Material
 Suggestions for Success • Read the syllabus, have it available at home and school • Attend class both physically and mentally • Have a regular study schedule • Do not take this class if you cannot come every week.
 Course Requirements • Two Midterms – Multiple choice and problems – worth 100 points • Paper – Worth 25 points • Comprehensive final – Will be given only on date scheduled which is December 9 at 8 pm – Worth 200 points
 Course Goals At the end of the class students will: • know significant events from US history from the colonial period to World War II • Understand their effect on US economic growth. – Understand necessary economic concepts • understand how political, social and geographic factors contributed to these events the record of US economic growth
 What Is Economic History? • “An attempt to explain the structure and performance of an economy over time. ” (North, Structure and Change in Economic History, p. 3) – Must be able to measure economic performance over time – Must be able to explain why it changes
 Measurement Issues • How do we decide whether the economy is doing well or poorly? • How big is the economy? – Before WWII there were no statistics to measure the size of the whole economy • How well off are people? – Income – Health – Happiness
 Measurement Issues • To judge whether the economy is doing well or poorly, must have a measure of size. • Must discuss these issues of measurement before trying to explain growth.
") Gross Domestic Product is the most commonly used measure • Gross domestic product (GDP) is a measure of the income and expenditures of an economy. • It is the total market value of all final goods and services produced within a country in a given period of time. • It is also a measure the total income of the economy.
Gross Domestic Product is the most commonly used measure • Gross domestic product (GDP) is a measure of the income and expenditures of an economy. • It is the total market value of all final goods and services produced within a country in a given period of time. • It is also a measure the total income of the economy.
 GDP • GDP is the Market Value. . . ” – Output is valued at market prices. – Cannot add eggs to cars to oranges directly – We add Pe*Qe + Pc*Qc+Po*Qo • GDP is a weighted average – When prices are determined in markets they reflect the value people place on them.
 Measurement of GDP • Of All Final. . . ” – It records only the value of final goods, not intermediate goods (the value is counted only once). • If a baker buys flour, it is not part of GDP, the bread produced from it is. If you buy flour in the supermarket it is part of GDP. – It is somewhat arbitrary • Cars are classified as final goods even though most use them to go to work
 Measurement of GDP • Goods and Services. . . “ – It includes both goods (food, clothing, cars) and services (haircuts, doctor visits). • Includes only those goods and services produced in market – Not those produced at home • A women marries her gardener and GDP falls – Not illegal • Prostitution is part of GDP in Nevada, not CA
 Measurement of GDP • Produced. . . ” – It includes goods and services currently produced, not transactions involving goods produced in the past. • Selling a used car does not change GNP
 Measurement of GDP • “. . . Within a Country. . . ” – It measures the value of production within the geographic confines of a country. • GNP is a similar measure – total value of all final goods and services produced by a country’s citizens regardless of where produced.
 GDP Problems • What would happen to GDP if number of women in workforce increased? – GDP would increase because jobs done outside the home are counted as part of GDP while jobs done in the home are not • Would all the measured increase be real? – No, jobs were done before, but done outside the market • This is important in many historical periods
 GDP Problems • What would happen to GDP, if marijuana use was legalized? – GDP would increase. • Would all the measured increase be real? – No, some marijuana was grown before but not counted as part of GDP because it was illegal • Can you think of a similar historical episode when this would be important?
 Data Problems • Before WWII there were no statistics to measure the size of the whole economy • Now government collects data to calculate it • Past estimates are based on what ever data was available
 Standard of living • How well off are individuals? • Average income is hard to get data on • Wages may be available for some workers, not for those working on farms or self employed • No income tax until 1900 s
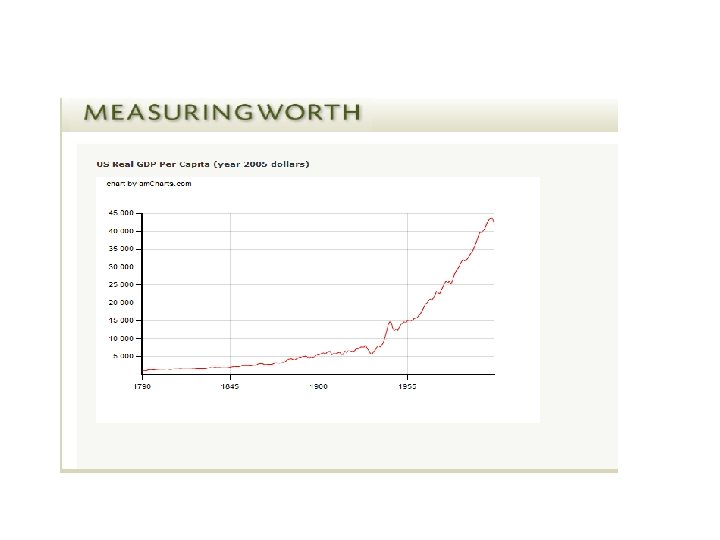
 GDP per Capita • GDP per Capita is GDP person – GDP/population – Measure of standard of living • GDP and GDP per capita can be different – China vs. Switzerland • Data problems
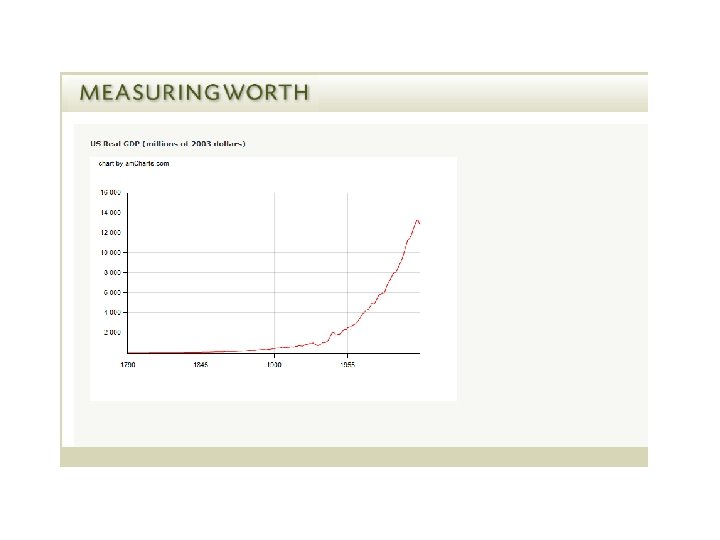
 Growth Rate of GDP • How do you calculate growth rate? • ((GDP 2 - GDP 1)/ GDP 1)*100 • Can you tell growth rate by looking at the slope of the line on the previous graphs? – No slope is the change in gdp, not the percentage change – If you graph the log of GDP, then the slope gives the growth rate
 The slope of the graph is constant. Growth rate of GDP is average of about 3%. The exception is period of Great Depression.
 Looks similar to GDP. Average growth of per capita income is about 1. 5% per year.
 Data Problems • National Income Accounting does not exist before 1930, so where do these numbers come from? • Estimated in various ways • Earlier in time the worse the data is • For the earlier period we will look at other measures, like height by age, mortality rates.
 Figure 1. 1 Univ. of Wisconsin Starting Football Players’ Avg. Weight
 Figure 1. 3 University of Wisconsin Basketball Players’ Heights
 Table 1. 1 Life Expectancy by Age in the United States
 • These slides are consistent with the increase in GDP per capita which we looked at earlier.
 What do the GDP, GDP per capita statistics for the US tell us? • US does not have a very high growth rate or either GDP or GDP per capita • With exception of the Great Depression, US growth has been very constant. • We will see when we discuss the colonial period that US standard of living was comparable to European standard of living from the beginning. • The result is high GDP per capita relative to the rest of the world.
 GDP, Life Expectancy, and Literacy Copyright© 2004 South-Western
 Why did US Economy grow? • Lots of possible reasons • We will use economics to answer the questions
 Economic thinking • Five propositions – Individual choices cause social outcomes – Choices impose costs – Incentives matter – Institutions (the rules of the game) matter. – Model based, not narrative based • Theories evaluated on evidence
 Property Rights • Property rights refer to the ability of people to exercise authority over the resources they own. – An economy-wide respect for property rights is an important prerequisite for the price system to work. – It is necessary for investors to feel that their investments are secure.
 Big question • Why does US economy have the set of institutions that seem to promote growth? • Why do these institutions change over time and continue to promote growth?