

7b66528acd7a3a41bf974910739c9178.ppt
- Количество слайдов: 65
 Economic Potential for GHG Mitigation in the Agriculture Sector ERS Mark Peters Jan Lewandrowski Robert House Carol Jones WRI Suzie Greenhalgh Paul Faeth Joint presentation for the Forestry-Agriculture Greenhouse Gas Modeling Forum October 1 -3, 2001
 Purpose: Characterize economic potential for mitigation of GHG emissions in agriculture sector at alternative incentive prices. • Two separate analyses using a jointly developed economic model • Many similarities • Several key differences – Mitigation activities – GHG emission rates – Producer incentives • Driving forces – Current economic structure – Changes in economic structure generated by carbon pricing
 Outline • Presentation divided into three parts – Discussion of the basic model – ERS analysis – WRI analysis
 Subject to") Nonlinear Mathematical Programming Objective Maximize net social benefit (consumer and producer surplus) Subject to Production activity set Commodity balance Input balance Environmental emissions balance Fixed resource constraints
Nonlinear Mathematical Programming Objective Maximize net social benefit (consumer and producer surplus) Subject to Production activity set Commodity balance Input balance Environmental emissions balance Fixed resource constraints
 Example Production activity
 Objective function value $ S NSB D Q
 No till Production activity use: linear transformation frontier 45 40 35 30 25 20 15 10 5 0 Relative returns ratio Linear transformation frontier 0 10 20 30 Conventional till 40
 Corn Belt Continuous corn
 Production activity use: nonlinear transformation frontier Relative returns ratio
 USMP Summary Schematic Inputs Land Primary Processing Crop production Demand Domestic use Labor Crop processing Capital Purchased inputs Livestock production Animal product processing Environmental Indicator Imports Beginning stocks Ending stocks Exports
 Primary commodities Crops Livestock corn sorghum barley oats wheat cotton rice soybeans silage hay fed beef for slaughter nonfed beef for slaughter beef calves for slaughter beef feeder yearlings beef feeder calves cull beef cows cull dairy calves milk hogs for slaughter poultry
 Processed products Crops Livestock soybean meal soybean oil ethanol livestock feed mixes cattle feed supplements dairy feed supplements swine feed supplements fed beef nonfed beef veal pork butter american cheese other cheese ice cream nonfat dry milk manufacturing milk
 USMP Regions A B PACIFIC E K F LAKE STATES G B NORTHEAST L N. PLAINS R L S MOUNTAIN E C D CORN BELT M H APPALACHIAN STATES N S. PLAINS J O P I T DELTA STATES T SOUTHEAST P U
 Rotations CONTINUOUS CORN CONTINUOUS SORGHUM CONTINUOUS BARLEY CONTINUOUS OATS CONTINUOUS WHEAT CONTINUOUS COTTON CONTINUOUS RICE CONTINUOUS SOYBEANS CONTINUOUS HAY CONTINUOUS SILAGE CORN SOYBEANS WHEAT OATS CORN SOYBEANS WHEAT BARLEY CORN SOYBEANS WHEAT HAY CORN SOYBEANS WHEAT SILAGE HAY CORN SOYBEANS OATS HAY CORN SOYBEANS BARLEY CORN SOYBEANS SORGHUM CORN SOYBEANS COTTON CORN WHEAT RICE CORN WHEAT SILAGE CORN SORGHUM CORN COTTON CORN OATS HAY CORN HAY SOYBEANS WHEAT SORGHUM SOYBEANS WHEAT RICE SOYBEANS WHEAT OATS SOYBEANS WHEAT BARLEY SOYBEANS SORGHUM COTTON SOYBEANS RICE WHEAT SORGHUM HAY WHEAT SORGHUM FALLOW WHEAT COTTON RICE WHEAT OATS HAY WHEAT OATS FALLOW WHEAT BARLEY HAY WHEAT BARLEY FALLOW WHEAT HAY WHEAT FALLOW SORGHUM COTTON SORGHUM BARLEY COTTON RICE BARLEY HAY BARLEY FALLOW OATS BARLEY SILAGE HAY
 Tillage practices Conventional till residue < 30 percent soil disturbed prior to planting Conventional till with moldboard plow residue <30 percent soil disturbed prior to planting moldboard plow Mulch-till residue > 30 percent soil disturbed prior to planting Ridge-till residue > 30 percent soil left undisturbed planting on ridges No-till residue > 30 percent soil left undisturbed
 Endogenous variables • Input use – Land – Rotations – Tillage practices – Nitrogen fertilizer application rates • Carbon emissions – Energy use, soil
 Endogenous variables • Prices • Production • Consumption • Trade
 Environmental Indicators Erosion water wind Other Chemicals Nitrogen loss Sediment Solution Leaching Denitrification Volatilization Soil carbon Phosphorous Sediment Solution Leaching Embodied carbon Offsite damages erosion nitrogen
 USMP Environmental Schematic Rotations, Tillage, Chemicals, CPS Yields, NASS County Data Weather, NOAA Soils, NRI and Soils 5 Yield Environmental Indicators EPIC Soil Erosion Carbon Flux Nutrient Losses, Water Atmospheric
 • Costs of production •") Data Sets – ARMS (Agriculture and Resource Management System) • Costs of production • Production practices • Tillage acres – NRI (Natural Resources Inventory) • Rotation acres
Data Sets – ARMS (Agriculture and Resource Management System) • Costs of production • Production practices • Tillage acres – NRI (Natural Resources Inventory) • Rotation acres
 • Regional") Data sets – USDA agricultural baseline – National Agricultural Statistics Service (NASS) • Regional Production • Regional Yield
Data sets – USDA agricultural baseline – National Agricultural Statistics Service (NASS) • Regional Production • Regional Yield
 Preparing USMP for scenario analysis For specified base year Economic information USMP model calibrated to a specified base year Baseline data Spatial data Production enterprise data Transform to base year Update to base year Environmental information Environmental data Calibrate model parameters so USMP solves for base year values
 ERS Analysis
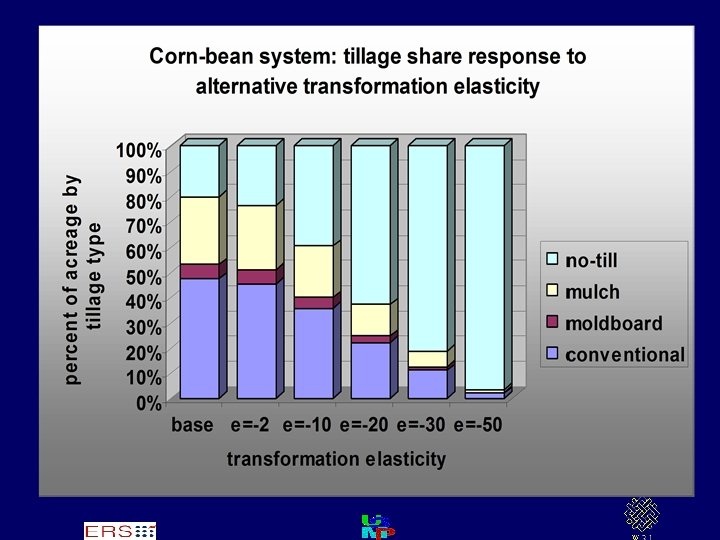
 Major Assumptions • Transformation elasticities • Rotations -2 • Tillage methods -10 • Mitigation pricing • Embodied in inputs Full CO 2 price • Soil Carbon Discounted (. 354 * CO 2 price)
 Carbon embodied in Ag inputs
 Conversion of cropland to forest use
 Afforestation – Fifteen year program – Establishment costs -annualized – Payment for carbon sequestered – No payment forest products – Harvesting permitted for afforestation
 Afforestation -Carbon sequestration • Birdsey
 Changing tillage can enhance soil carbon sequestration conventional conservation
 – Costs of production by rotation –") Ag soil management (Crop mix, rotation, tillage) – Costs of production by rotation – Charge for carbon embodied in inputs – Payment for carbon sequestered – Revenue from sale of crops
Ag soil management (Crop mix, rotation, tillage) – Costs of production by rotation – Charge for carbon embodied in inputs – Payment for carbon sequestered – Revenue from sale of crops
 – Continuous hay or") Carbon sequestration rates IPCC inventory procedures (Eve et. al. ) – Continuous hay or pasture – Continuous cropland • conventional tillage (conventional and moldboard) • reduced tillage (mulch- and ridge-till) • no-till – Continuous cropland with hay in rotation – Low residue crops • conventional tillage (conventional and moldboard) • reduced tillage (mulch- and ridge-till) • no-till
Carbon sequestration rates IPCC inventory procedures (Eve et. al. ) – Continuous hay or pasture – Continuous cropland • conventional tillage (conventional and moldboard) • reduced tillage (mulch- and ridge-till) • no-till – Continuous cropland with hay in rotation – Low residue crops • conventional tillage (conventional and moldboard) • reduced tillage (mulch- and ridge-till) • no-till
 – Annual crops with fallow • conventional tillage •") Carbon sequestration rates (cont. ) – Annual crops with fallow • conventional tillage • reduced tillage • no till – Annual crops 2 years then fallow 1 • conventional tillage • reduced tillage • no-till – Continuous lowland
Carbon sequestration rates (cont. ) – Annual crops with fallow • conventional tillage • reduced tillage • no till – Annual crops 2 years then fallow 1 • conventional tillage • reduced tillage • no-till – Continuous lowland
 Ag soil management: IPCC Based Carbon Sequestration Rates
 Conversion of marginal cropland to grassland use
 Grassland – Fifteen year program – Establishment costs based on CRP rates – Payment for carbon sequestered – No co-products (not used by livestock forage)
 Crops to grassland: IPCC Based Carbon Sequestration Rates
 Carbon payments
 Net CO 2 emission reductions Discounted prices
 Land changes: Discounted payments
 Changes in net returns: Discounted payments
 Change in commodity prices: Discounted payments
 Net CO 2 mitigation Full vs Discount
 Net CO 2 mitigation No discounting
 WRI Analysis
 WRI and USMP • Basic Model is the same as ERS • Major Differences – Geographical coverage – Treatment of GHG Emissions – Calibration of GHG – CRP is endogenous
 WRI: USMP Geographic Coverage • National • 10 USDA farm production regions • 45 model resource regions (intersection of 26 USDA land resource regions and the farm production regions) • 8, 4 and 2 digit USGS hydrologic units for the Mississippi River Basin
 WRI: 4 Digit USGS HUC coverage
 WRI: GHG’s Included • Carbon Dioxide – Carbon sequestered by changing tillage practices and cropping rotations – Energy embodied in fertilizer/pesticide production – Energy used for tillage and processing activities • Nitrous Oxides – Emitted from synthetic N fertilizer applications
 WRI: Data and Calibration • Carbon Dioxide – Use EPIC to calculate Carbon sequestered. – Embodied energy: University of Missouri (fertilizers), Rutgers University (pesticides), WRI (tillage etc. ) – Cropland CRP calibrated to National Resources Inventory data (Eve etal. , 2000). • Nitrous Oxides – Fertilizer emissions calculated using Methods for Estimating GHG emissions from Agricultural Soils, EIIP, 1999. – Calibrated to Inventory of US GHG Emissions and Sinks, EPA, 1999.
 WRI: Scenario Modeling • Assumptions – CRP acreage is not capped – There is no discounting for carbon – Welfare payments include government payments
 WRI: Scenario Results
 WRI: Scenario Results
 WRI: Scenario Results
 WRI: Future Improvements • Future Improvements – Nitrous oxides from legumes (already completed but not included in scenarios run for this workshop) – Biomass- ethanol production updates • Future Improvements (funding dependent) – Water quality implications of livestock
 WRI: USMP Analysis • 1995 Farm Bill – Increased ‘Flex Payments’ and green payments • Climate Change – Impact of Kyoto Protocol on U. S. agriculture when coupled with domestic agricultural programs • Hypoxia assessment – ties water quality and climate change mitigation options together • 2002 Farm Bill – Bio-fuels/bio-energy options
 WRI: Climate Change Analysis Kyoto Plus. . .
 WRI: Climate Change Analysis Kyoto Plus…
 WRI: Hypoxia Analysis Farm Income
 WRI: Hypoxia Analysis GHG Emissions
 WRI: Hypoxia Analysis N Delivered to Gulf of Mexico
 Suzie Greenhalgh suzieg@wri. org World Resources Institute
 USMP Model Regions A B E K F G PACIFI C B NORT HE RN PLAI NS MO UN TAIN D NO RT HEAST L M R L S CO RN BELT E C L AKE STATES H SO UTH ER N PLAIN S J APP ALA CHI A N N SO UTH EA ST O D ELT A P STATES P T I U T Farm Prod ucti on an d La n d R esource Region s NT - N ortheast LA - Lake States CB - Corn Belt NP - Northern Plains AP - Appalachia SE - Southeast DL - Delta States SP -Southern Plains MN - Mountain PA - Pacific A - N W Forest, Forage, and Spec. Crops B - N W Wheat an d Range C - Cal. Su btrop. Fruit, Truck, and Spec. Crops D - W estern Range and Irrigated E - Roc ky Mountain Ran ge and Forest F - N. Great Plains Spring Whe at G - W. Great Pl ains R ange an d Irri gated H - W. Great Pl ains Winter Wheat and Range I - SW. Plateau s and Plain s Range and Cotton J - SW. Prairies Cotton and Forage K - N. Lake States Forest and Range L - Lake State s Fruit, Truck, an d Dairy M - Central Feed Grain s and Livestock N - East and Central Farming and Forest O - Mississippi Delta Cotton and Feed Grain s P - S. Atl. & Gulf Slope Cash Crops, Forest, Lvst. R - North east Forage and Forest S - N orth Atlantic Slope Diversified Farming T - Atlantic & Gulf Coast Lowland Forest and Crop U - Fla. Subtropical Fruit, Tru ck Crop, Range US MP model region n omenclature is the con catenation of abbrevi ation s for farm produ ction and land resource region, e. g. C B M is Corn Belt M, LA M is Lake States M, etc.
 Nonlinear Mathematical Programming Model Subject to
") Nonlinear programming model(cont. )
Nonlinear programming model(cont. )