ce640b09bde307830653a7793c0d19c5.ppt
- Количество слайдов: 53


Economic Analysis of Supplemental Deductible Coverage as Recommended in the USDA’s 2007 Farm Bill Paul D. Mitchell University of Wisconsin-Madison Thomas O. Knight Texas Tech University AAE Departmental Seminar October 10, 2007 Published as Mitchell and Knight. 2008. Agricultural and Resource Economics Review 37: 117 -131

Motivation n Title X of the USDA’s 2007 Farm Bill: “Allow farmers to purchase supplemental insurance that would cover all or part of their individual policy deductible in the event of a county or area wide loss. ” Similar to H. R. 721 The Risk Management Enhancement Act, sponsored by Neugebauer (RTX) and others, including Mark Green (R-WI) Main Point: Policy makers are examining various types of supplemental coverage

Why Supplemental Coverage? n n n Provide “Gap Coverage” to fill the “hole in the safety net”, especially in high risk areas High risk areas = high premiums, and deductible still exceeds profit margin Supplemental coverage will increase effective coverage Reduce need for disaster assistance n Lower premium for SDC than for APH with the same liability n
 as proposed in 2007")
Purpose of Presentation n n Describe Supplemental Deductible Coverage (SDC) as proposed in 2007 USDA Farm Bill Economic Analysis of SDC at farm level Effect on Farmer Welfare (certainty equivalent) n Effect on Farmer Behavior (coverage level) n
 Coverage Works n n n Farmer chooses farm yield")
How Individual Crop Insurance (APH) Coverage Works n n n Farmer chooses farm yield guarantee as proportion aaph of expected yield mf Expected yield mf calculated as moving average of actual production history (APH) APH indemnities based on farmer yield Iaph = Paph x max{aaphmf – yf, 0}
 Coverage Works n n Choose county yield guarantee as")
How Areawide Crop Insurance (GRP) Coverage Works n n Choose county yield guarantee as proportion agrp of expected county yield mc RMA sets GRP expected county yield mc GRP indemnities based on county yield Igrp = MPgrp x max{(agrpmc – yc)/(agrpmc), 0} MPgrp = GRP maximum protection per acre = 150% x Paph x mc Calculate county % loss from guarantee , then paid that percentage of liability MPgrp

Simple APH Example n n Farm mean mf = 100, choose 75% coverage (aaph = 0. 75), so APH yield guarantee = 75 bu/ac Deductible (bu/ac) = 100 – 75 = 25 bu/ac Daph ($/ac) = Paph x 25 bu/ac If actual harvest yf = 60 bu/ac, then loss is max(75 – 60, 0) = 15 bu/ac and indemnity is Paph x 15 bu/ac

Simple GRP Example n n n County mean mc = 100, choose 90% coverage (agrp = 0. 90), so GRP yield guarantee = 90 bu/ac If actual county yield yc = 80 bu/ac, then loss is max((90 – 80)/90, 0) = 11. 1% Indemnity = MPgrp x 0. 111, where MPgrp = 150% x Paph x 100 bu/ac

How SDC would work n n Allow farmer with APH coverage to buy GRP coverage modified to have liability equal to APH deductible, so SDC indemnity is Isdc = Iaph + Imgrp = Daph x max{(agrpmc – yc)/(agrpmc), 0} Imgrp = GRP indemnity, replacing maximum protection per acre MPgrp with APH deducible

Indemnity Unmodified GRP Indemnity APH Deductible Unmodified GRP Indemnity agrpmc yc

Problem with unmodified GRP n n GRP only pays total liability Daph if yc = 0 Very unlikely, even in high risk areas Need accelerated indemnities Modify GRP indemnity further: Same yc trigger of agrpmc, but full payout of APH deductible by yc = qmc, 0 ≤ q ≤ agrp

Indemnity Modified GRP Indemnity APH Deductible Unmodified GRP Indemnity qmc agrpmc yc

Questions on how these policies work? ? ?
 as proposed in 2007")
Purpose of Presentation n n Describe Supplemental Deductible Coverage (SDC) as proposed in 2007 USDA Farm Bill Economic Analysis of SDC at farm level Effect on Farmer Welfare (certainty equivalent) n Effect on Farmer Behavior (coverage level) n

Overview Economic Analysis of SDC n n Effect of SDC on certainty equivalents Effect of SDC on optimal coverage level Examine farmer certainty equivalent ($/ac) assuming negative exponential utility (CARA) and coverage level chosen optimally Use Monte Carlo integration to estimate farmer expected utility, then calculate certainty equivalents

Modeling Stochastic Relation between Farm and County Yields n n n With SDC, farmer indemnities depend on both the farm yield and the county yield Certainty equivalent and optimal coverage depend on how model relation btwn yields Models used in literature Additive: n Multiplicative: n Hierarchical: n Joint Density: n yf = b f yc + e f less general y f = y c hf yf ~ f(yf|yc) more general g(yf, yc) more general

Modeling Stochastic Relation between Farm and County Yields n n Given mean and variance of county yield Additive and Multiplicative: n Setting farm mean and variance sets correlation between farm and county yields Joint Distribution: n Correlation between farm and county yields can be set separate from farm mean and variance Hierarchical: n Depends on number of parameters of the conditional density for farm yield

Main Point n n n I use a joint density for farm and county yields that separately specifies the county mean and variance, the farm mean and variance, and the correlation between farm and county yields Parameters mc, sc, mf, sf, and rfc fully describe farm and county yields Additive and Multiplicative would only have mc, sc, mf, and sf as free parameters

Monte Carlo Analysis n n n Specify parameters: mc, sc, mf, sf, and rfc, plus premiums, price, coverage levels and coefficient absolute risk aversion Ra Draw county and farm yields Determine indemnities, returns and utilities for each set of yield draws Calculate expected utility for parameter set as simple average of all utilities: EU = Average(ui) Calculate certainty equivalent: CE = – ln(1 – EU)/Ra

Distribution of Yields n County yield: lognormal distribution Mean = GRP 2007 expected county yield n St. Dev. set to match 90% GRP premium rate n n Farm yield: beta distribution Mean = 75% or 125% county mean n St. Dev. set to match 65% APH premium rate n Min = 0, Max = mean + 2 st. dev. n n n Farm-county correlation = 0. 5 and 0. 8 Draw correlated random yields using Richardson and Condra’s method

Drawing Correlated Pseudo-Random Variables 1. 2. 3. 4. 5. Calculate L = Cholesky decomposition of var-cov matrix given by sc, sf and rfc Draw n 1 and n 2 ~ N(0, 1) i. i. d. Calculate ti = Li 1 n 1 + Li 2 n 2 Calculate vi = F(ti) ~ uniform (0, 1) Calculate yields yj = Fj-1(vi)

Premiums and Indemnities n n Determine Actuarially Fair Premiums, then apply current premium subsidy rates Indemnities: Iaph = Paph x max{aaphmf – yf, 0} Igrp = MPgrp x max{(agrpmc – yc)/(agrpmc), 0} Isdc = Iaph + Imgrp

Federal Premium Subsidy Rate

Revenue and Utility n Revenue p 0 = pyf n pgrp = p 0 – Mgrp(agrp) + Igrp(agrp) n paph = p 0 – Maph(aaph) + Iaph(aaph) n psdc = paph – Mmgrp(aaph) + Imgrp(aaph) n p = price, Mi = premium and Ii = indemnity n n Utility: ui = 1 – exp(–Rapi) Expected Utility: EU = avg(ui) over all i Certainty Equivalent: CE = –ln(1 – EU)/Ra
")
Expected Utility Maximization n Assume farmers choose APH coverage level optimally (maximize expected utility) For APH alone n For APH as part of SDC n n n Fix GRP coverage level at 90% and use 100% price election for APH, as these are optimal ex ante Find certainty equivalent for all APH coverage levels to identify EU maxing aaph

Scenarios Analyzed n n Three Crops: Corn, Cotton, Soybeans Two types of counties High risk counties (marginal cropping) n Low risk counties (good cropping) n n Two farm types in each county Below Average (mf = 75% of mc) n Above Average (mf = 125% of mc) n n Two Measures for Impact of SDC Increase in CE ($/ac) compared to APH alone n Change in optimal APH coverage level n

Corn: Hamilton, IA; Tripp, SD Soybeans: Boone, IA; Becker, MN Cotton: Coahoma, MS; Lubbock, TX YELLOW GREEN BROWN

County Mean St Dev CV Corn Tripp Hamilton 56. 9 176. 4 18. 6 28. 3 32. 7% Soybeans Cotton Becker Boone Lubbock Coahoma 28. 3 46. 2 232. 0 852 16. 0% 8. 43 7. 39 115. 9 212. 1 29. 8% 16. 0% 50. 0% 24. 9% Farm: high risk (mf 75% of mc) Mean 43. 0 132. 0 21. 0 35. 0 174. 0 639. 0 St Dev 37. 3 38. 0 12. 2 10. 4 199. 5 277. 3 86. 7% 28. 8% 58. 0% 29. 7% 115% 43. 4% CV Farm: low risk (mf 125% of mc) Mean 71. 0 221. 0 35. 0 58. 0 290. 0 1065. 0 St Dev 39. 5 54. 6 14. 3 14. 4 227. 1 399. 8 55. 6% 24. 7% 40. 9% 24. 8% 78. 3% 37. 5% CV

More parameters n Coefficient of absolute risk aversion n n Set so risk premium = 30% revenue st. dev. when no insurance is used Prices: used APH prices for 2007 Corn $3. 50/bu Soybeans $7/bu n Cotton $0. 52/lb in TX, $0. 53 in MS n n Full GRP payout as % county mean (q) No guidance in Farm Bill proposal n Set equal to APH coverage level: q = aaph n

Indemnity Schedule
 vs coverage level (aaph)")
Results n n n First plots of certainty equivalent (CE) vs coverage level (aaph) to show derivation of optimal aaph and CE for APH alone and APH with SDC Bar plots of how SDC affects optimal certainty equivalent and optimal coverage Summarize general findings
 Optimal aaph")
Corn: Tripp, SD (mf = 0. 75 mc, rfc = 0. 5) Optimal aaph = 80% w/ APH alone, 75% w/ SDC GRP Alone Nothing APH Alone
 Optimal aaph")
Corn: Hamilton, IA (mf = 0. 75 mc, rfc = 0. 8) Optimal aaph = 85% w/ APH alone and w/ SDC GRP Alone Nothing APH Alone
")
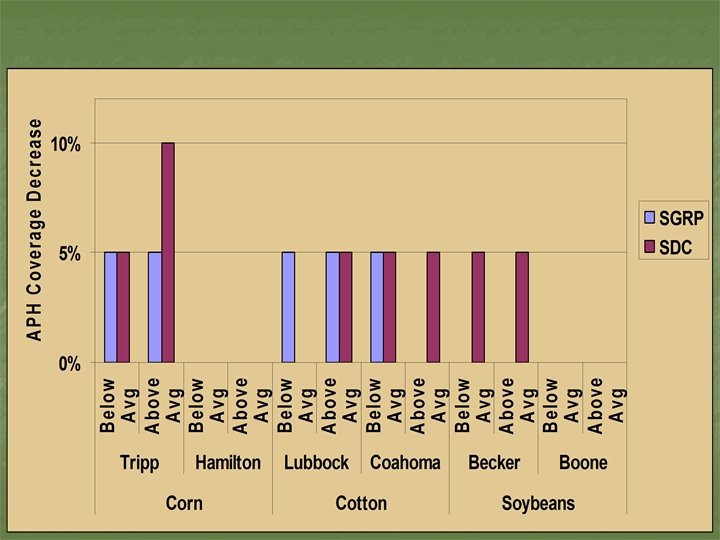
Coverage Level Decrease with SDC (risk averse)
")
Coverage Level Decrease with SDC (risk neutral)
")
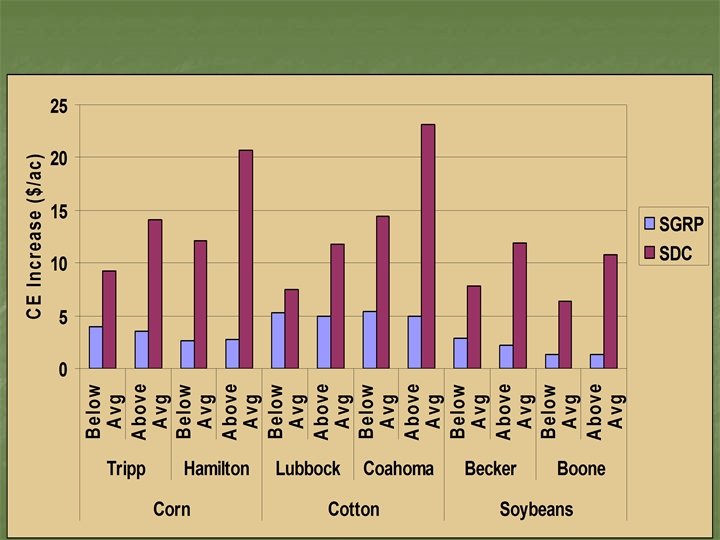
CE Increase with SDC (risk averse)
")
CE Increase with SDC (risk neutral)
")
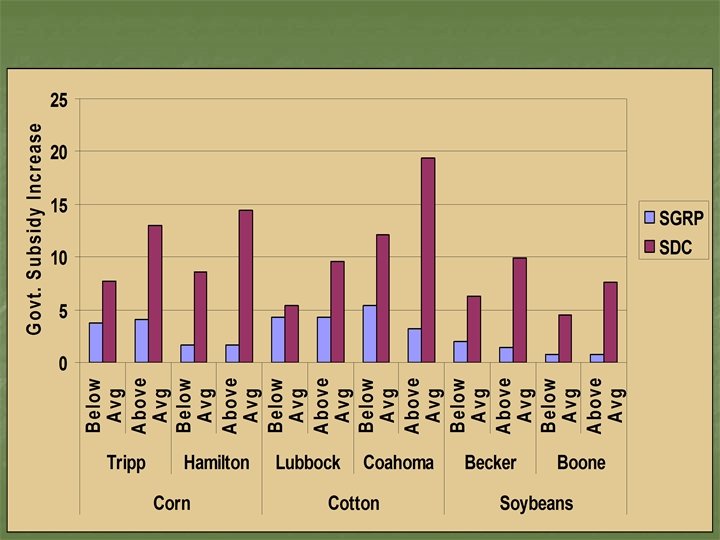
Govt. Subsidy Increase with SDC (risk averse)
")
Govt. Subsidy Increase with SDC (risk neutral)

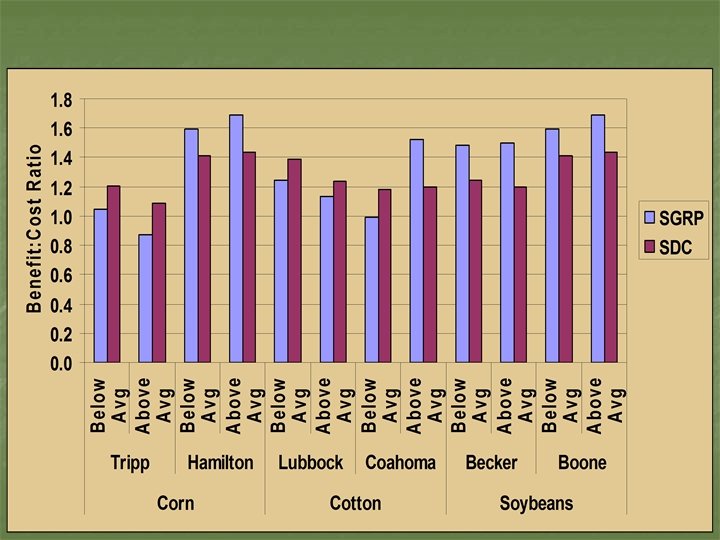
Benefit-Cost Ratio for Govt. Funds
 Ranged $5 -$23/ac")
Summary: Impact on Farmer CE n SDC Welfare Benefit/CE increase ($/ac) Ranged $5 -$23/ac n Larger for growers with above average yields and more correlated with county yields n Larger benefit in low risk areas for corn and cotton, but in high risk areas for soybeans n Corn and cotton benefits similar and larger than for soybeans n

Summary: APH Coverage Level n Optimal APH coverage level decrease Decreased 5 -10 percentage points in high risk corn and soybean areas and cotton areas n No effect in low risk corn and soybean areas n n Implication as shift liability from individual to areawide policy Reduced potential for moral hazard, fraud, and program abuse n Lower loss adjustment and administrative costs n

Summary: Government Benefit-Cost Ratio n Ratio of farmer CE increase to govt. subsidy increase Higher when more correlated w/ county yields n Higher where optimal APH coverage not reduced n Higher in low risk corn and soybean areas n Lower in high risk corn and low risk cotton n


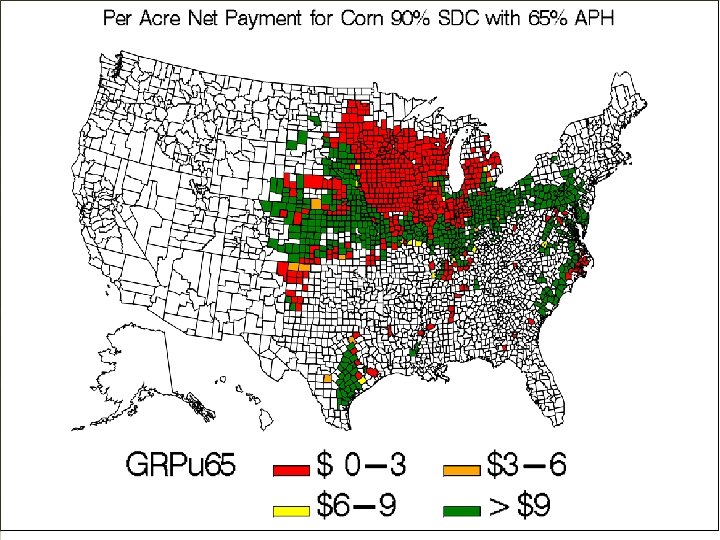
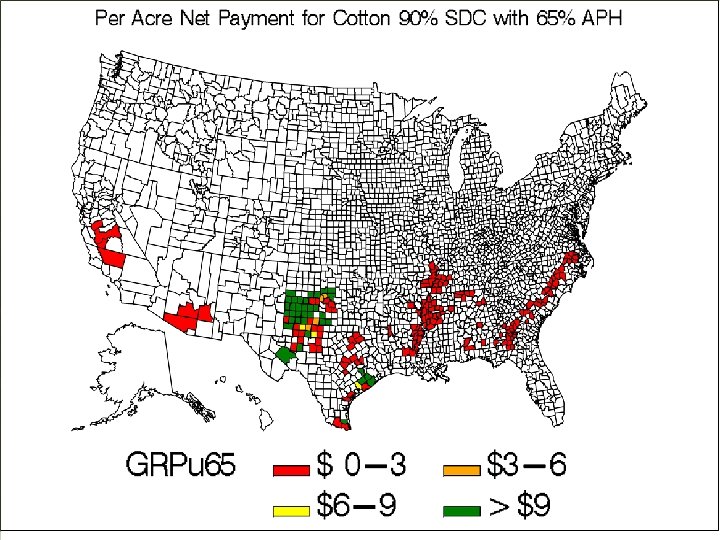
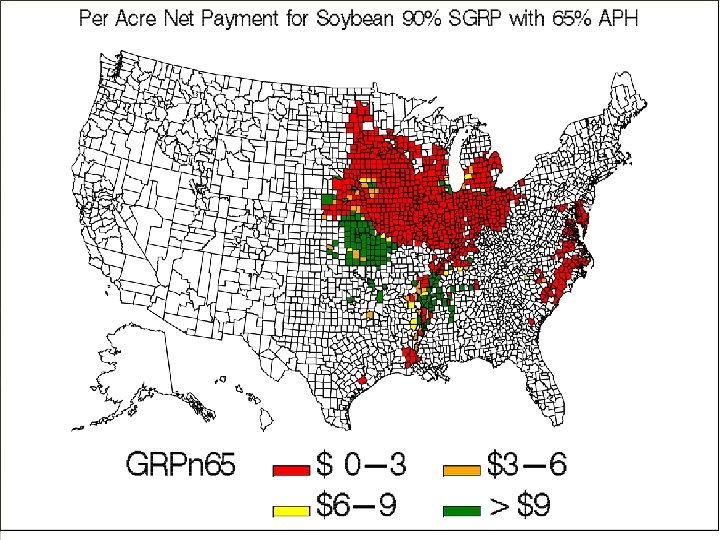
Knight, Coble, and Mitchell n n Report for House Ag Committee’s deliberations on Farm Bill Compared SDC to SGRP

Knight, Coble, and Mitchell n n Wrote report for House Ag Committee’s deliberations on Farm Bill Plots showing increase in expected return with SDC for corn, cotton, and soybeans for US counties, assuming 65% APH Expected return = E[Premium – Indemnity] n Risk neutral, so no risk benefit n Non-endogenous APH coverage level n
ce640b09bde307830653a7793c0d19c5.ppt