

cdacd7fee5c0c780aea407ba28c737e4.ppt
- Количество слайдов: 32
 Economic Analysis Economic Principles March 2004 Maine
 Types of Economic Analysis • With/Without • Benefit Cost Analysis • Cost Effective Analysis • Partial Budget • Marginal Analysis • Enterprise Budgets • Net Worth Statement
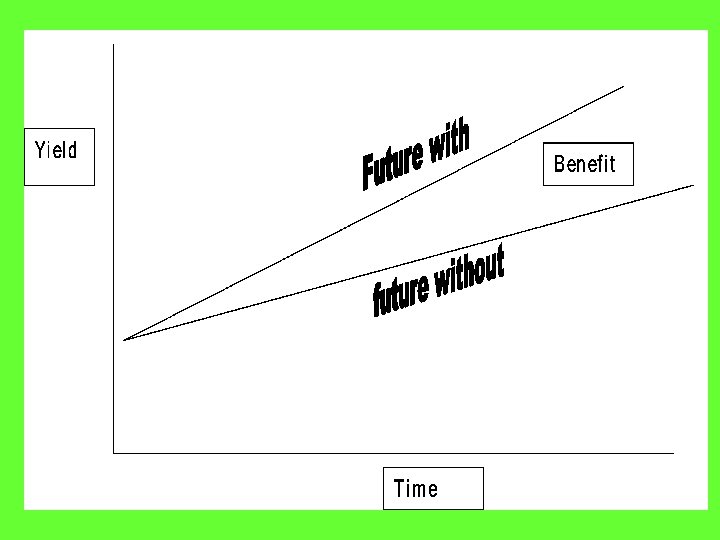
 Future With and Future Without • Compare future with conservation to the future without it • Benefits of conservation determined by the difference between with and with out • Always have the effects of “do nothing” compared to effects with conservation installed
 Sediment Damage
 Benefit Cost Analysis • Total benefits compared to total costs – usually expressed as a ratio (such as $1. 10 to $1) • >$1/$1, GOOD! • <$1/$1, NOT AS GOOD • Used mostly for area-wide projects and national programs • Required by law for certain programs
 Benefit Cost Analyses of Conservation Programs
 Economics of CRP National benefits/costs +Increased net farm income +Value of future timber +Preservation of soil productivity +Improved surface water quality +Reduced windblown dust +Enhanced small game hunting $2. 1 to $6. 3 billion $3. 3 billion $0. 6 to $1. 7 billion $1. 3 to $4. 2 billion $. 3 to $. 9 billion $1. 9 to $3. 1 billion $9. 5 to $19. 5 billion -Higher food cost to consumers -Veg. Cover establishment -USDA tech. Asst. Net Value = $4. 1 to $9. 2 billion Source: Osborn and Konyar (1990) $2. 9 to $7. 8 billion $2. 4 billion $. 1 billion $5. 4 to $10. 3 billion
 Kenduskeag Watershed Project Economic Benefits Type of Economic Benefit Increased fishing opportunities Recreation Maintaining yields Yield improvements More efficient fertilizer use More efficient pasture mgmt. Total Benefits Total Costs Benefit – Cost Ratio Average Annual $ $71, 050 $62, 700 $18, 510 $48, 450 $17, 730 $69, 300 $287, 740 $270, 040 $1. 07 Adapted from Watershed Plan – EA, Kenduskeag Stream Watershed, November, 1988
 Monetary vs. Non-Monetary Benefits • Market goods lumber, grain, cars, pencils, etc. • Non-market goods clean water, scenic farmland, wetland functions/values, wildlife
 Non-monetary Benefits How to put a $ value on goods/services not traded in the market? • Contingent valuation • Travel cost method • Hedonic Studies ?
 Pollution Level Environmental Quality") Hedonic Studies Property Price ($) Pollution Level Environmental Quality
Hedonic Studies Property Price ($) Pollution Level Environmental Quality
 Maine Lakes • willingness of users to pay for water quality: $2 to $6 million per year • >200, 000 Mainers spend ~$100 million per year in recreation associated with lakes • 1 meter reduction in summertime water clarity: 3 - 5% reduction in lakefront property value Source: 2000 National Water Quality Inventory Report, EPA, p. 64. www. epa. gov/305 b
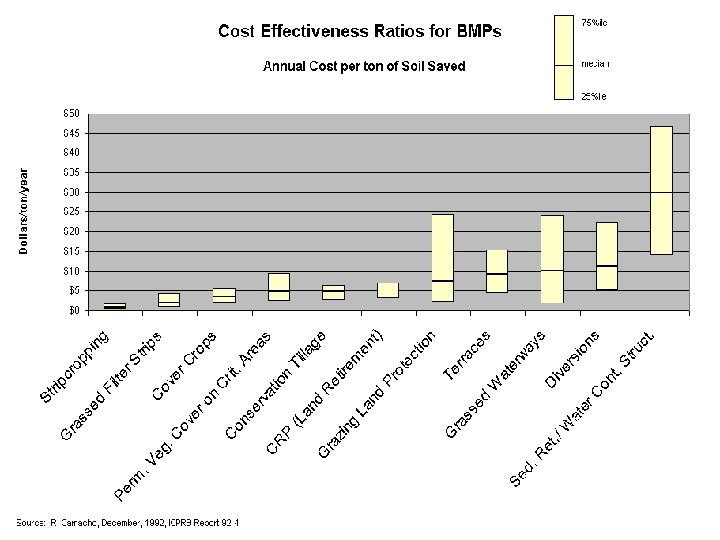
 Cost Effectiveness • A tool to measure the effectiveness of a practice or plan relative to its cost • Used to obtain a set objective at the least cost, OR • To obtain the best results at a set cost
 Cost Effectiveness • Best Buy • What is the better deal when comparing the amount of physical effects and the cost to get it • 1 fish per 50 mile trip or 3 fish per 100 mile trip? ? ?
 Two hypothetical questions that costeffectiveness would try to answer: • If we have $1 million, how can we get the most conservation possible? Constant cost • If we want to reduce pollution by 40 percent, what is the cheapest way to do that? Constant effects
 • Costs are associated with a particular unit reduction or increase") Cost-effectiveness (cont. ) • Costs are associated with a particular unit reduction or increase (the effect) Ø Lbs of N prevented from reaching streams Ø Tons of soil saved Ø Acres of habitat created Ø Number of life-years saved Ø Ducks made happy (? )
Cost-effectiveness (cont. ) • Costs are associated with a particular unit reduction or increase (the effect) Ø Lbs of N prevented from reaching streams Ø Tons of soil saved Ø Acres of habitat created Ø Number of life-years saved Ø Ducks made happy (? )
 Effect (T/A/Y A B C D") C-E Example 1: Constant Effects Plan Cost ($/year) Effect (T/A/Y A B C D 50, 000 12, 000 10, 000 30, 000 10 10 5, 000 1, 200 1, 000 3, 000 saved) Ratio ($/T/A/Y)
C-E Example 1: Constant Effects Plan Cost ($/year) Effect (T/A/Y A B C D 50, 000 12, 000 10, 000 30, 000 10 10 5, 000 1, 200 1, 000 3, 000 saved) Ratio ($/T/A/Y)
 Effect (T/A/Y A B C D") C-E Example 2: Constant Cost Plan Cost ($/year) Effect (T/A/Y A B C D 50, 000 10 8 15 3 5, 000 6, 250 3, 333 16, 667 saved) Ratio ($/T/A/Y)
C-E Example 2: Constant Cost Plan Cost ($/year) Effect (T/A/Y A B C D 50, 000 10 8 15 3 5, 000 6, 250 3, 333 16, 667 saved) Ratio ($/T/A/Y)
 Effect (T/A/Y A B") C-E Example 3: Costs & Effects Vary Plan Cost ($/year) Effect (T/A/Y A B C D 50, 000 20, 000 90, 000 6, 000 10 8 15 3 5, 000 2, 500 6, 000 2, 000 saved) Ratio ($/T/A/Y)
C-E Example 3: Costs & Effects Vary Plan Cost ($/year) Effect (T/A/Y A B C D 50, 000 20, 000 90, 000 6, 000 10 8 15 3 5, 000 2, 500 6, 000 2, 000 saved) Ratio ($/T/A/Y)
 Cost-effectiveness in Ranking Systems
 Partial Budgeting • A planning and decision-making framework used to compare the costs and benefits of alternatives faced by a farm business.
 Partial Budgeting • Systematically displays the positive and negative effects of a change • Only those factors that change are considered • Useful tool for analyzing almost any type of change
 Situations where a farm might use partial budgets • Substituting one crop for another • Adding a few head to a livestock enterprise • Taking advantage of an early payment discount on a fertilizer bill • Adopting a new production practice • Participating in a government program
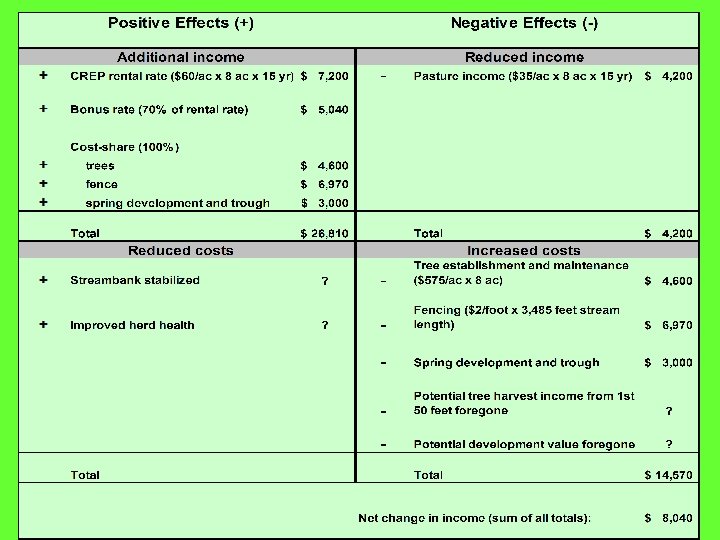
 Partial Budget Elements Added Income + Reduced Costs _______ Total Positive Effects Added Costs + Reduced Income ________ Total Negative Effects
 (-) Reduced Costs Increased Costs 1. ____________________________") Partial Budget Positive Effects Negative Effects (+) (-) Reduced Costs Increased Costs 1. ____________________________ 2. ____________________________ 3. ____________________________ Increased Income Reduced Income 1. ____________________________ 2. ____________________________ 3. ____________________________ Total + ____ Total - ____
Partial Budget Positive Effects Negative Effects (+) (-) Reduced Costs Increased Costs 1. ____________________________ 2. ____________________________ 3. ____________________________ Increased Income Reduced Income 1. ____________________________ 2. ____________________________ 3. ____________________________ Total + ____ Total - ____
 Item Irrigated acres Current System Clear forest, till additional land Shorten system Move and shorten system 62 73 50 55 Crop income $7, 440 $8, 760 Reduced income -- -- Land clearing -- $257 -- -- Mitigation -- $206 -- -- Move & shorten -- -- -- Fuel $1, 122 Labor & Maintenance $3, 720 $2, 920 $2, 000 $2, 200 $868 Net Income $1, 730 $3, 386 $1, 640 $1, 679 Change from current system -- $1, 657 -$90 -$51 Insurance $6, 000 $6, 600 $370 $216 $515
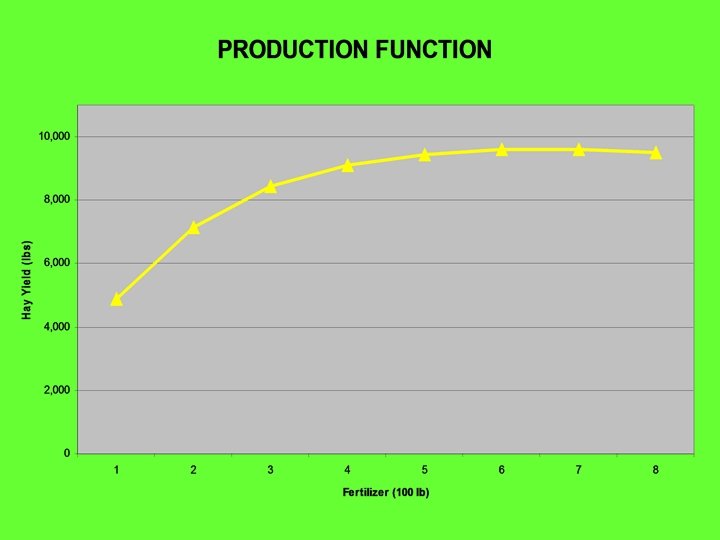
 Marginal Analysis • Think at the margin - we look at the last increment • Trying to find the most economical input level • Marginal Benefit equal to or greater than Marginal Cost • Common sense to have the income or value of the product greater than the cost
 WHERE DO WE WANT TO BE? WHERE MVP >=MC