08d16d068ec2642ac08fd1d6aa1c0c16.ppt
- Количество слайдов: 185

Econometrics Three Broad Economic Themes • Where is the economy today? – It’s more than inflation & unemployment! • Where is the economy going? – It’s more than Potential GDP growth? • What is your place & what is the significance of this picture of the economy to you? – Your job and your future is dependent on the trends and directions of this American Economy!

Working 2002 Data Has this changed in 4 years? • Unemployment 5. 8% • Inflation Rate 1. 6% • Median Weekly Salary: $610 (Half earn more & half earn less) • Median Weekly Salary for Men: $685 • Median Weekly Salary for Women: $531 US Work Force 138, 600, 000 • Average Hourly salary: April 2002 $14. 77

US Data April 2003 to 2006: Inflation • CPI up 3. 6% since April 2003: 199. 8 v 183. 5 (1982 -4=100) – – – Education up 6. 4% Energy(gas) up 11% Medical care up 13% Food up 8. 6% Clothing down 1. 5% Source: Bureau of Labor Statistics http: //www. bls. gov/home. htm 5/15/2006

US Data 2006/2004/2000 Working • Total Private/Nonfarm Employment: 135, 068, 000 v 130, 878, 000 v 133, 308, 000 • Women in the work force: 65, 042, 000 v 63, 972, 000 v 64, 395, 000 • Average work week: 33. 9 v 33. 6 v 34. 1 • Average Hourly Pay: $16. 61 v $15. 50 v $14. 29 Source: Bureau of Labor Statistics 5/15/2006

USA: April 2006 v 2005 • Total US Employment: 143, 688, 000 v 141. 1 million • Total US Labor Force: 150, 811, 000 v 148. 8 million • Labor Force participation rate: 74. 1% v 73. 3% • Discouraged workers: 1, 200, 000 v 1, 400, 000 • Unemployed workers: 7, 123, 000 v 7, 700, 000

Unemployment Demographics April 06 (4. 7) v 05 (5. 2%) • The unemployment rates for the major worker groups: – – – – adult men 4. 2% v 4. 4% adult women 4. 3% v 4. 6% teenagers 14. 6% v 17. 7% whites 4. 4% v 4. 4% blacks 9. 4% v 10. 4% Hispanics or Latinos 5. 4% v 6. 4% Asians was 4. 1% v 3. 9%

Starting Salaries 2006 • • • Chemical Engineer: $50, 000 - 56, 000 Computer Engineer: $49, 000 - 55, 000 Civil Engineer: $38, 400 - 45, 000 Economics/Finance: $34, 000 - 45, 000 Accounting: $37, 000 - 45, 000 Nursing: $34, 000 - 42, 000 History: $27, 000 - 37, 000 English: $22, 500 - 35, 000 – Now who’s better? Visual & Performing Arts: $23, 000 - 34, 000 First Year Teacher: $27, 000 - 34, 500 GHS 30, 000 http: //www. jobweb. com/resources/library/Salary_and_Benefits/Starting_Salary_51_01. htm

US Data 2005/6 – Biggest Job Gains • Construction: up 32. 3% – Thank You Federal Reserve! • Service & Temps Jobs: up 26. 4% & 18. 4% • Educational Services: up 26. 4% Day Care! • Health Care Industry: up 21. 4% • Food & Hotel Service up 16. 5% Source: Bureau of Labor Statistics 5/15/2006

Families and Work • Families with children: 35. 4 million • 90. 3% had at least one parent employed in 2006 • In 60. 7% of two-parent families both parents worked • In 30. 5 percent of twoparent families, only the father was employed, and, in 5. 5 percent, only the mother worked • 71. 1 % of Mothers Work

Working Mothers My mom made me poor! • 71. 1 percent of mothers work • 53. 7 percent of mothers with children under 1 year work • Unemployment Rate for unmarried mothers with children under age 18: 10. 3%

Bureau of Labor Statistics Fact 2006 • The labor force participation rates of women in nearly all age groups are projected to increase. • The number of women in the labor force is projected to grow by 14. 3 percent, faster than the 10 -percent growth projected for men. • Women's share of the labor force is expected to increase by 1 percent, from 46. 5 percent in 2002 to 47. 5 percent by 2012.


Decisions Made Age 14 - 24 • • • Smoking, Drinking, and Drug use Driving Habits Work & Job Attitudes Sex Education Career

Labor Market Theory The Real World Will Get You! • Human Capital – Education = Income • Sorting Mechanism – Hoops • Radical View – Rich Dad Poor Dad • Dual Labor Market – Good Job v Bad Job Market

Human Capital, Sorting Mechanism, Radical Approach, Good Job/Bad Job Market Theories of Labor

Titled Hopeful Parents The Far Side 1989 Tyler? !? X-box? Unfortunately 2005 Didn’t Turnout Like the Cartoon

Unemployment by Education Level – BLS April 2006 • Less than a high school diploma of 12, 474, 000: 8. 4% unemployed • High school graduates of 38, 265, 000: 4. 4% unemployed • Some college or associate degree of 34, 860, 000: 3. 9% unemployed • Bachelor's degree and higher of 40, 788, 000 : 2. 5% unemployed Where are you going class of 2006?

Top 10 Bachelor’s Degrees Issued to Guys in 2000 1. Engineering 2. Business 3. Biology 4. Communications 5. Psychology 6. Accounting 7. Teaching 8. History 9. Political Science 10. Criminal Justice 48, 582* 44, 510* 20, 536* 19, 631 17, 867 16, 192* 15, 987* 15, 666 Total Male Graduates: 15, 609 519, 956 14, 624 *More issued in India, China, and South Korea!


Top 10 Bachelor’s Degrees Issued to Girls in 2000 1. Psychology 2. Teaching K-8 3. Business 4. Nursing 5. Communications 6. Biology 7. English 8. Accounting 9. Education 10. Sociology 51, 507 50, 289 42, 426 38, 894 29, 794 26, 518 25, 379 21, 726 17, 925 17, 067 Total Female Graduates: 664, 450

Women Graduate From High School, Tech School & College at Higher Rates than Men! A Women’s Dilemma A Guys…….

Tech School Data 600, 000+ Grads Incomplete on Demographics of Men, Women, and Degree Sorry not a lot of research done!

Associate Degree Candidates • $ • Business: $26, 891 – Includes accounting, finance, marketing, general business, and MIS (Management Information Systems). • Computer Science: $32, 022 – Includes computer science, computer programming, and information sciences. • Engineering Technology: $36, 449 – Includes chemical, civil, computer, electrical, industrial, and mechanical engineering technologies. BLS: An associate or bachelor's degree is the most significant source of post- secondary education or training for 6 of the 10 fastest growing occupations.

Ranked Job Categories in the US 1850 1. Farmers 2. Laborers 3. Hired Hands/Farm Laborers 4. Managers & Proprietors 5. Carpenters 6. Family Workers 7. Shoemaker/Shoe Repair 8. Salesman/Sales Clerks 9. Blacksmiths 10. Miners

Ranked Job Categories in the US 1900 1. Farmers 2. Laborers 3. Farm Laborers 4. Maids & Domestics 5. Family Workers 6. Managers & Proprietors 7. Salesman/Sales Clerks 8. Carpenters 9. Miners 10. Truck & Cart Drivers

Ranked Job Categories in the US 1960 1. Manufacturing Workers 2. Clerical Staff 3. Salesman/Sales Clerks 4. Managers & Proprietors 5. Typists & Secretaries 6. Farm Laborers 7. Farmers 8. Maids & Domestics 9. Teachers 10. Waiters & Waitresses

Ranked Job Categories in the US 1990 1. Managers & Proprietors 2. Clerks & Clerical Staff 3. Salesmen & Sales Clerks GHS I my job! 4. Laborers 5. Typists & Secretaries 6. Teachers 7. Cashiers 8. Truck Drivers 9. Janitors 10. Waiters & Waitresses & Cooks

Fastest Growing Professions in USA by 2010 1. 2. 3. 4. 5. 6. 7. Computer Engineer Computer Support Specialist Systems Analyst Database Administrator Desktop Publishing Specialist Paralegal & Legal Assistants Personal & Home Healthcare aides If a job category is growing 8. Medical Assistants 9. Social and Human Service rapidly and few people can Assistants do it, what happens to its pay? 10. Physician Assistants

Jobs with the greatest Percentage Growth in USA by 2010 1. 2. 3. 4. Retail Sales Clerk Systems Analyst Cashiers Managers & Assistant Managers 5. Truck Drivers 6. Office Clerks 7. Registered Nurses If a job is in high demand, 8. Computer Support but many people can do it with Specialists little training, its wage will be? 9. Personal Care Aides Wage is dependent on MRP!!! 10. Teachers Aides


Education is Income! Less than 8 th grade $11, 000/ yr $440, 000 8 th Grade Grads $13, 000/yr $520, 000 9 – 11 th Grade $16, 727/yr $669, 080 High School Grad $24, 500/yr $980, 000 Tech School Grad $31, 000/yr $1, 240, 000 1 - 3 years College $32, 000/yr $1, 280, 000 College Grads $44, 000/yr $1, 760, 000

Family Income USA • • 9. 8% 8. 9% 16. 3% 14. 4% 18. 6% $100, 000+ $75 -99, 999 $50 -74, 999 $35 -49, 999 $25 -34, 999 $15 -24, 999 <$15, 000 What does it mean to be upper class, middle class, working poor, or poor?

• Family Income Distribution 2000 $355, 000 – Top 1% • $130, 600 – Top 5% • $93, 800 – Top 10% • 60, 800 – Top 25% • 33, 400 – Top 50%

Average Household Income USA 2000 • $53, 100 USA Average • $62, 500 Ozaukee County Average • $10, 710 Someone earning the “Federal Minimum Wage” • $10, 140 Average Social Security Benefit

Family Income Data Average Family Income 2000 • • River Hills: $450, 000 Mequon: $120, 000 Cedarburg: $62, 500 Grafton: $61, 000 Wisconsin: $43, 791 Milwaukee: $42, 166 Nationally: $41, 994 Ozaukee County #20 in the Nation at $64, 456!

State Rankings on Median Family Income 1. New Jersey 2. Connecticut 3. Maryland 4. Alaska 5. Massachusetts 18. Wisconsin 46. Montana 47. Louisiana 48. Arkansas 49. Mississippi 50. West Virginia $55, 146 $53, 935 $52, 868 $51, 571 $50, 502 $43, 791 $33, 024 $32, 566 $32, 182 $31, 330 $29, 696 Median Household Income in the USA: $41, 994

10 Wealthiest Communities in Wisconsin By Median Income 1. Chenequa(Waukesha) $163, 428 2. River Hills(Milwaukee) $161, 292 3. Shorewood Hills(Dane) $122, 879 4. Oconomowoc Lake(Wauk) $112, 760 5. Maple Bluff(Dane) $111, 400 6. Town of Delafield(Wauk. ) $98, 779 7. North Bay(Racine) $97, 943 8. Lac La Belle(Waukesha) $96, 712 9. Town of Middleton(Dane) $93, 008 10. Mequon(Ozaukee) $90, 733

10 Wealthiest US. Metropolitan Areas by Per Capita Income – 2003 data 1. Bridge Port (Connecticut) $60, 803 2. San Francisco (California) $46, 958 3. San Jose( California) $46, 072 4. Washington DC $44, 056 5. Boston (Mass. ) $43, 135 6. Naples (Florida) $41, 513 7. Trenton (New Jersey) $41, 499 8. Boulder (Colorado) $41, 110 9. New York (NY) $40, 889 10. Vero Beach (Florida) $39, 953

10 Wealthiest WI Metro Areas Per Capita Income – 2003 data 1. (30) Madison 2. (35) Milwaukee 3. (85) Racine 4. (86) Sheboygan 5. (87) Appleton 6. (101) Green Bay 7. (111) Oshkosh 8. (119) Wausau 9. (161) Janesville 10. (162) La Crosse $35, 471 $35, 133 $31, 271 $31, 251 $31, 143 $30, 697 $30, 359 $29, 992 $28, 256 $28, 245

10 Poorest Communities in Wisconsin By Median Income 1. Anderson(Iron) 2. Glen Flora(Rusk) 3. Namakagon(Bayfield) 4. Lublin(Taylor) 5. Exeland(Sawyer) 6. Butler(Clark) 7. Melvina(Monroe) 8. Hustler(Juneau) 9. Readstown(Vernon) 10. Tony(Rusk) $15, 417 $20, 250 $20, 645 $20, 938 $21, 000 $21, 250 $21, 563

Distribution of Personal Income by Families, 1996 Percentage of all families in this class Personal income class Under $10, 000 - $14, 999 $15, 000 - $24, 999 $25, 000 - $34, 999 $35, 000 - $49, 999 $50, 000 - $74, 999 $75, 000 - $99, 999 $100, 000 and over 7. 6 6. 1 13. 5 17. 7 21. 3 10. 0 10. 3 100. 0

GLOBAL PERSPECTIVE Percentage of total income earned by top fifth of income receivers 30 Brazil South Africa Guatemala Mexico United Kingdom United States Japan Norway 40 50 60 70

GLOBAL PERSPECTIVE Percentage of total income earned by top fifth of income receivers 30 Brazil South Africa Guatemala Mexico United Kingdom United States Japan Norway 40 50 60 70

Causes of Growing Inequality 1 - Demand for Highly Skilled Workers 2 - Demographic Changes 3 - International Trade - Immigration - Union Decline

Wage Data – Median Income • Median Income: $33, 636 • Only 32. 8% of all US jobs paid over $45, 000 • Two-thirds of all wage earners work two jobs • Two-thirds of all mothers with children now work • Median paycheck for working wives: $18, 000 US News and World Report 2/9/2004 pg 67

The Lorenz Curve 100 Percent of Income 80 Perfect Equality 60 40 Complete Inequality 20 0 Copyright Mc. Graw-Hill, Inc. 1999 20 40 60 Percent of Families 80 100

The Lorenz Curve 100 Lorenz Curve (actual distribution) Percent of Income 80 Perfect Equality 60 40 Complete Inequality 20 0 Copyright Mc. Graw-Hill, Inc. 1999 20 40 60 Percent of Families 80 100

The Lorenz Curve 100 Lorenz Curve (actual distribution) Percent of Income 80 Perfect Equality 60 40 Area between the lines shows the degree of income inequality 20 Complete Inequality 0 Copyright Mc. Graw-Hill, Inc. 1999 20 40 60 Percent of Families 80 100

The Lorenz Curve 100 Lorenz Curve (actual distribution) Percent of Income 80 Perfect Equality Two Adjustments: Taxes Cash Transfer Payments 60 40 Area between the lines shows the degree of income inequality 20 Complete Inequality 0 Copyright Mc. Graw-Hill, Inc. 1999 20 40 60 Percent of Families 80 100

The Lorenz Curve 100 Lorenz Curve (actual distribution) Percent of Income 80 Perfect Equality 60 40 Area between the lines shows the degree of income inequality 20 Complete Inequality 0 Copyright Mc. Graw-Hill, Inc. 1999 20 40 60 Percent of Families 80 100

The Lorenz Curve 100 Lorenz Curve (actual distribution) Percent of Income 80 Perfect Equality 60 40 Lorenz curve after taxes and transfers Area between the lines shows the degree of income inequality Complete Inequality 20 0 Copyright Mc. Graw-Hill, Inc. 1999 20 40 60 Percent of Families 80 100

CAUSES OF INCOME INEQUALITY 1 - Ability Differences 2 - Education and Training: Human Capital & Sorting Mechanism Theories 3 - Discrimination 4 - Tastes and Risks 5 - Unequal Distribution of Wealth Radical Theory 6 - Market Power 7 - Luck, Connections, and Misfortune Good Job, Bad Job Market EQUALITY-EFFICIENCY TRADEOFF

Extremes in the USA Wealth & Poverty

Bill Gates: Richest of the Rich

10 Wealthiest People in the World 1. Bill Gates $52, 800, 000 2. Warren Buffet $35, 000, 000 3. Paul Allen $25, 200, 000 4. Lawrence Ellison $23, 500, 000 5. Jim Walton 2001 $20, 800, 000 6. John Walton $20, 700, 000 7. S. Robson Walton $20, 500, 000 8. Alice Walton $20, 500, 000 9. Helen Walton $20, 400, 000 10. Prince Alwaleed Bin Talal Alsaud $20, 000, 000

10 Wealthiest People in the World 1. Bill Gates $50, 000, 000 2. Warren Buffet $42, 000, 000 3. Carlos Slim Helu $30, 000, 000 4. Ingvar Kamprad $28, 000, 000 5. Lakshmi Mittal $23, 500, 000 6. Paul Allen 2006 $22, 000, 000 7. Bernard Arnault $21, 500, 000 8. Prince Alwaleed Bin Talal Alsaud $20, 000, 000 9. Kenneth Thompson $19, 600, 000 10. Li-Ka Shing $18, 800, 000

Highest Earning Celebrities in 2006! 1. George Lucas 2. Oprah Winfrey 3. Mel Gibson 4. Tiger Woods 5. Steven Spielberg 6. Dan Brown 7. Jerry Bruckheimer 8. Michael Schumacher 9. J. K. Rowling 10. David Copperfield $290, 000 $225, 000 $185, 000 $87, 000 $80, 000 $76, 500, 000 $66, 000 $60, 000 $50, 000 $48, 000

10 Richest Dead Celebrities! 1. Elvis Presley 2. Charles Shultz 3. John Lennon 4. Andy Warhol 5. Dr. Suess Theodore Geisel 6. Marlon Brando 7. Marilyn Monroe 8. J. R. R. Tolkien 9. George Harrison 10. Johnny Cash $45, 000 $35, 000 $22, 000 $16, 000 $10, 000 $9, 000, 000 $8, 000, 000 $7, 000

Top 10 Record Sales of All Time The artists: Bryan Adams Paul Anka The Beatles Bing Crosby Bill Hailey Whitney Houston Elton John The Monkees Elvis Presley 1. Candle in the Wind………… 37, 000 2. White Christmas…………… 30, 000 3. Rock Around the Clock……. 17, 000 4. I Want to Hold Your Hand… 12, 000 5. Hey Jude………… 10, 000 6. I Will Always Love You…. . . 10, 000 7. It’s Now or Never…………. . 10, 000 8. Diana…………… 9, 000 9. Hound Dog………………. . . … 9, 000 10. Everything I Do For You……. . 8, 000 11. I’m A Believer………………. . 8, 000

The Millionaires • 8, 000+ families have a net worth greater than $1, 000 • Net worth = (Assets – Liabilities) • Who wants to marry a millionaire? ? ? • Most millionaires are rather ordinary: 60+ yrs. old, male, white, and own a small business.

US Household’s: Net Worth Data • • 11% 20% 25% 44% Greater than $250, 000 $100, 000 - $249, 999 $25, 000 - $99, 999 Under $25, 000 Net Worth = (Assets - Liabilities)

Top 10 Economic Powers in the World By GDP – 2001 - RDGP 1. United States $10, 210, 000, 000 2. Japan $4, 765, 000, 000 3. Germany $1, 866, 000, 000 4. Britain $1, 427, 000, 000 5. France $1, 294, 000, 000 6. China $1, 080, 000, 000 7. Italy $1, 074, 000, 000 8. Canada $704, 000, 000 9. Brazil $701, 000, 000 10. Mexico $575, 000, 000

Top 10 Economic Powers in the World By GDP – 2005 - RGDP 1. United States $11, 310, 000, 000 2. China $8, 165, 000, 000 3. Japan $3, 966, 000, 000 4. India $3, 727, 000, 000 5. Germany $2, 454, 000, 000 6. Britain $1, 880, 000, 000 7. France $1, 824, 000, 000 8. Italy $1, 654, 000, 000 9. Brazil $1, 568, 000, 000 10. Russia $1, 538, 000, 000

Top Countries in GDP Per Capita 1. 2. 3. 4. 5. 6. 7. 8. Norway USA Switzerland Denmark Iceland Finland Britain Germany $38, 500 $37, 500 $31, 000 $30, 500 $30, 000 $27, 500 $27, 300 $27, 200 Source – The Economist June 14 th 2005 9. Sweden 10. France 11. Italy 12. Japan 13. Spain $27, 100 $27, 000 $26, 900 $26, 800 $23, 000

Countries with the Highest Life Expectancy USA Worldwide 77. 5 66. 0 1. 2. 3. 4. 5. 6. 7. 8. 9. 10. Japan Sweden Iceland Australia Israel Martinique Switzerland Canada France Norway 81. 5 yrs. 80. 1 yrs. 79. 4 yrs. 79. 2 yrs. 79. 1 yrs. 79. 0 yrs. 78. 9 yrs.

38, 500, 000+: Men, Women, and Children(12. 5%) The typical poor person in the US: • Single Mom with Kids! • White unemployed female under forty • Found everywhere including Ozaukee County!

$18, 810 for a family of four! $12, 015 for a family of two! $9, 573 for a single person!! Of the 200 largest US counties Waukesha with 3. 0% of its Residents in Poverty ranked second lowest in the US. Of all 5, 700+ US counties Ozaukee with 2. 2% of its Residents in Poverty ranked third lowest in the US.

Poverty in the USA • FAMILY: You live in poverty if you are a family of 4 with an income less than $18, 810. • SINGLE PERSON: You are considered to be living in poverty if your yearly income is less than $9, 573 and you live alone. Erica, age 19 in a Dumpster!

Wisconsin Poverty • 528, 000 people or 9. 8% of WI residents • WI residents without health insurance 593, 000 • National rank 36 th lowest poverty in poverty rate

The Economics of Poverty Income Family of 2 Family of 4 Family of 6 $12, 015 $18, 810 $24, 389 Poverty Rate 14. 7% of the nation 37 million people

Percentage in Poverty, 1996 0 Married-couples family Age 65 and over Whites Total population Children under 18 Foreign Born (not citizens) Blacks Hispanics Female-headed families Copyright Mc. Graw-Hill, Inc. 1999 10 20 30 40 50

Percentage in Poverty 0 Married-couples family Age 65 and over Whites Total population Children under 18 Foreign Born (not citizens) Blacks Hispanics Female-headed families 10 20 30 40 50

US Population? • What is the population of the United States of America? • What is the population of the state of Wisconsin?

US Population? • What is the population of the United States of America? 292, 000 • What is the population of the state of Wisconsin? 5, 400, 000

Cultural and Ethnic Diversity • What is the ethnic make of the United States and the State of Wisconsin? • What are three largest racial groups in the United States?

USA Population 292, 000 Our ethnic makeup? _____% White _____ % African American _____ % Hispanic American _____ % Asian American _____ % Native American ? ? ? ? ? ?

USA Population 292, 000 Population data US Census Bureau Our ethnic makeup is about: 72. 0 % White 13. 0 % African American 13. 4 % Hispanic American 4. 0 % Asian American 0. 7 % Native American Click on this link to connect to the US Census Bureau Data Banks: http: //www. census. gov/ftp/pub/population/www/projections/popproj. html

The USA in 2050? S. Measner: 80 R. Brogelman: 75 M. Maney: 6 Class of 2000: 68 Class of 2006: 62 We’ll all be older in 2050 but what will be the demographics of the United States in 2050? ? Click on the line below to see: http: //www. census. gov/ftp/pub/population/www/projections/popproj. html

Population Projections 2045 TOTAL US Population: July 1, 2025 2030 2035 337, 815, 000 351, 070, 000 364, 319, 000 July 1, 2045 377, 350, 000 390, 398, 000

Ethnic Diversity 2045 in millions Years: Population in Millions Total US Population 2045: 390, 398, 000

Wisconsin Population 5, 400, 000 Wisconsin’s ethnic makeup? _____ % White _____ % African American _____ % Hispanic American _____ % Asian American _____% Native American ? ? ? ? ? ? ?

Wisconsin Population 5, 400, 000 Population data US Census Bureau Projection July 2000 Wisconsin’s ethnic makeup? 88. 5 % White 6. 0 % African American 2. 5 % Hispanic American 1. 8 % Asian American 0. 9 % Native American Click on this link to get population projects for all states in the US: http: //www. census. gov/population/projections/state/stpjrace. txt

Wisconsin Race & Ethnicity

White Folk • Wisconsin: 88. 3% • Metro Milwaukee: 75. 5% • City of Milwaukee: 47. 0%

Black Folk • Wisconsin: 5. 7% • Metro Milwaukee: 16. 1% • City of Milwaukee: 41. 3%

Hispanic Folk • Wisconsin: 4. 0% • Metro Milwaukee: 7. 0% • City of Milwaukee: 14. 1%

Asian Folk • Wisconsin: 1. 8% • Metro Milwaukee: 2. 5% • City of Milwaukee: 2. 8%

Foreign Born • Wisconsin: 4. 2% • Metro Milwaukee: 6. 6% • City of Milwaukee: 9. 1%

Wisconsin Housing

Home Ownership • Wisconsin: 69. 1% • Metro Milwaukee: 63. 2% • City of Milwaukee: 46. 4%

Median Home Value • Wisconsin: $131, 908 • Metro Milwaukee: $165, 029 • City of Milwaukee: $95, 674

Homes Valued at over $300, 000 • Wisconsin: 6. 8% • Metro Milwaukee: 13. 0% • City of Milwaukee: 1. 8%

Median Monthly Mortgage • Wisconsin: $1, 138 • Metro Milwaukee: $1, 313 • City of Milwaukee: $1, 025

Median Monthly Rent • Wisconsin: $595 • Metro Milwaukee: $654 • City of Milwaukee: $429

Wisconsin Work Force

Manufacturing Workers • Wisconsin: 18. 9% • Metro Milwaukee: 17. 0% • City of Milwaukee: 15. 9%

Workers in Health, Education and Social Services • Wisconsin: 20. 0% • Metro Milwaukee: 20. 6% • City of Milwaukee: 22. 4%

Workers in Retail • Wisconsin: 11. 5% • Metro Milwaukee: 10. 9% • City of Milwaukee: 9. 4%

Workers in Food Service, entertainment, accommodations, and recreation! • Wisconsin: 8. 0% • Metro Milwaukee: 6. 9% • City of Milwaukee: 8. 9%

Wisconsin Education

Adults Age 25 and over with a high school diploma or higher • Wisconsin: 87. 1% • Metro Milwaukee: 87. 2% • City of Milwaukee: 78. 9%

Adults 25 and over with a Bachelors Degree or higher • Wisconsin: 23. 8% • Metro Milwaukee: 30. 1% • City of Milwaukee: 20. 6%

Wisconsin Age

Median Age of Wisconsin • Wisconsin: 37. 1 • Metro Milwaukee: 36. 5 • City of Milwaukee: 31. 8
Population Under Age 18 • Wisconsin: 24. 9% • Metro Milwaukee: 26. 2% • City of Milwaukee: 29. 9%
Wisconsin Population Age 65 and Older • Wisconsin: 12. 5% • Metro Milwaukee: 11. 8% • City of Milwaukee: 9. 7%

Wisconsin Income and Poverty
Median Household Income • Wisconsin: $44, 084 • Metro Milwaukee: $46, 487 • City of Milwaukee: $32, 291
Median Family Income • Wisconsin: $54, 500 • Metro Milwaukee: $58, 931 • City of Milwaukee: $39, 443
Households with an income of more than $100, 000 • Wisconsin: 13. 8% • Metro Milwaukee: 19. 2% • City of Milwaukee: 4. 7%
Households with an income of less than $25, 000 • Wisconsin: 16. 5% • Metro Milwaukee: 16. 5% • City of Milwaukee: 37. 1%
Wisconsin People Living Below the Poverty Line • Wisconsin: 10. 5% • Metro Milwaukee: 11. 7% • City of Milwaukee: 22. 1%
Ozaukee County Village/City Town Belgium 1, 864 1, 537 Cedarburg 11, 254 5, 696 Fredonia 2, 067 2, 112 Grafton: 11, 098 4, 048 Port Washington 10, 691 1, 648 Mequon 23, 222 Saukville 4, 165 1, 771 Thiensville 3, 264 Total Ozaukee County Population: 84, 561 Click here to get a complete population history on Ozaukee County: http: //www. co. ozaukee. wi. us/muni/Populations. htm
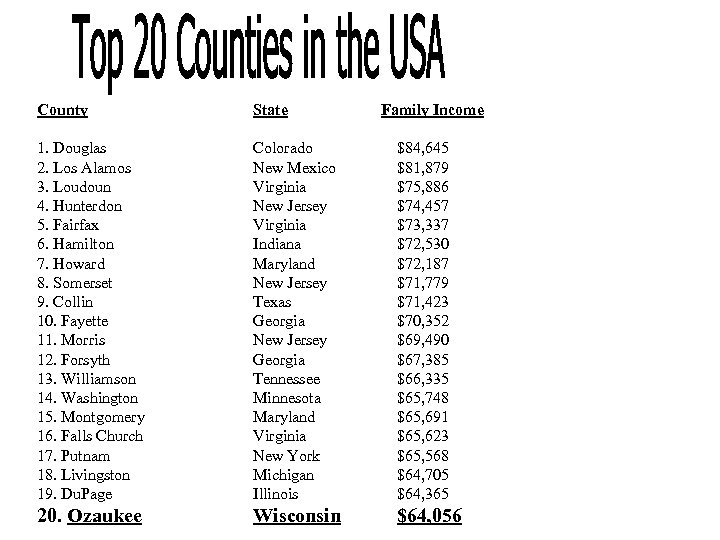
County 1. Douglas 2. Los Alamos 3. Loudoun 4. Hunterdon 5. Fairfax 6. Hamilton 7. Howard 8. Somerset 9. Collin 10. Fayette 11. Morris 12. Forsyth 13. Williamson 14. Washington 15. Montgomery 16. Falls Church 17. Putnam 18. Livingston 19. Du. Page State Family Income Colorado New Mexico Virginia New Jersey Virginia Indiana Maryland New Jersey Texas Georgia New Jersey Georgia Tennessee Minnesota Maryland Virginia New York Michigan Illinois $84, 645 $81, 879 $75, 886 $74, 457 $73, 337 $72, 530 $72, 187 $71, 779 $71, 423 $70, 352 $69, 490 $67, 385 $66, 335 $65, 748 $65, 691 $65, 623 $65, 568 $64, 705 $64, 365 20. Ozaukee Wisconsin $64, 056
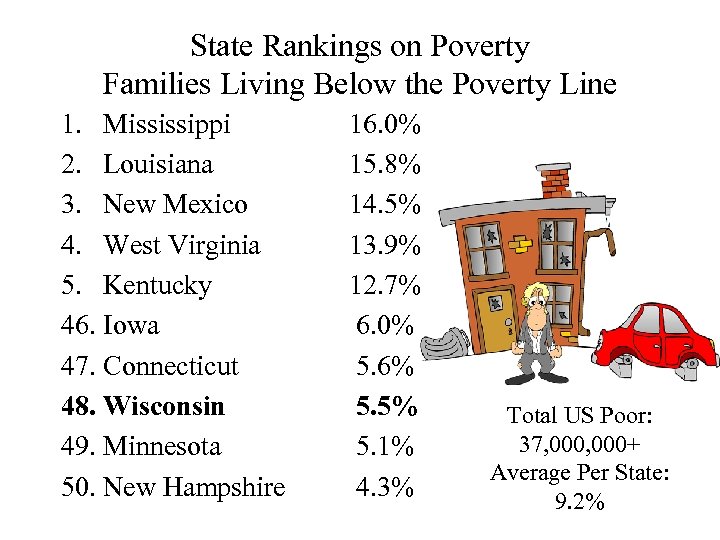
State Rankings on Poverty Families Living Below the Poverty Line 1. Mississippi 2. Louisiana 3. New Mexico 4. West Virginia 5. Kentucky 46. Iowa 47. Connecticut 48. Wisconsin 49. Minnesota 50. New Hampshire 16. 0% 15. 8% 14. 5% 13. 9% 12. 7% 6. 0% 5. 6% 5. 5% 5. 1% 4. 3% Total US Poor: 37, 000+ Average Per State: 9. 2%
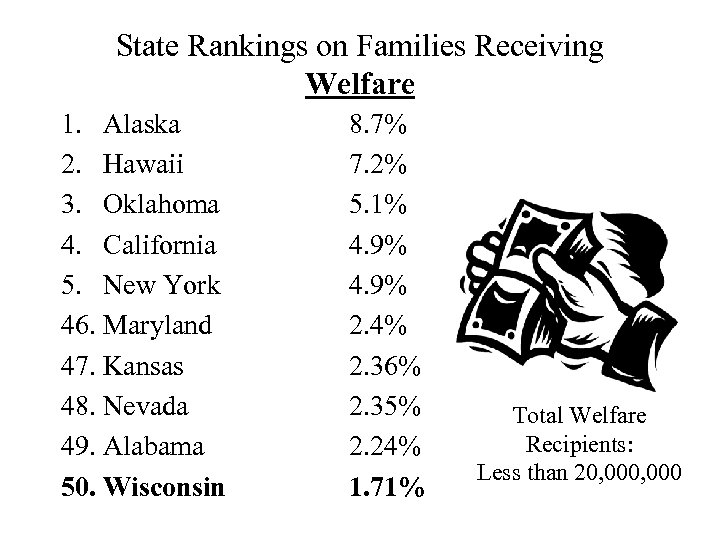
State Rankings on Families Receiving Welfare 1. Alaska 2. Hawaii 3. Oklahoma 4. California 5. New York 46. Maryland 47. Kansas 48. Nevada 49. Alabama 50. Wisconsin 8. 7% 7. 2% 5. 1% 4. 9% 2. 4% 2. 36% 2. 35% 2. 24% 1. 71% Total Welfare Recipients: Less than 20, 000
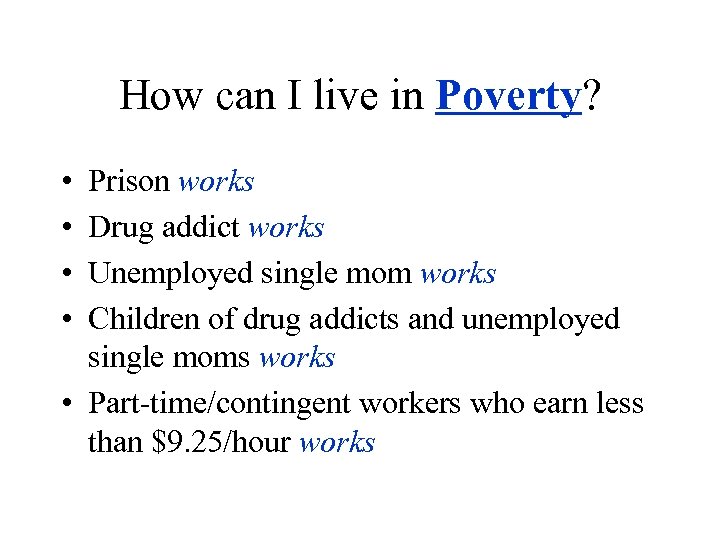
How can I live in Poverty? • • Prison works Drug addict works Unemployed single mom works Children of drug addicts and unemployed single moms works • Part-time/contingent workers who earn less than $9. 25/hour works
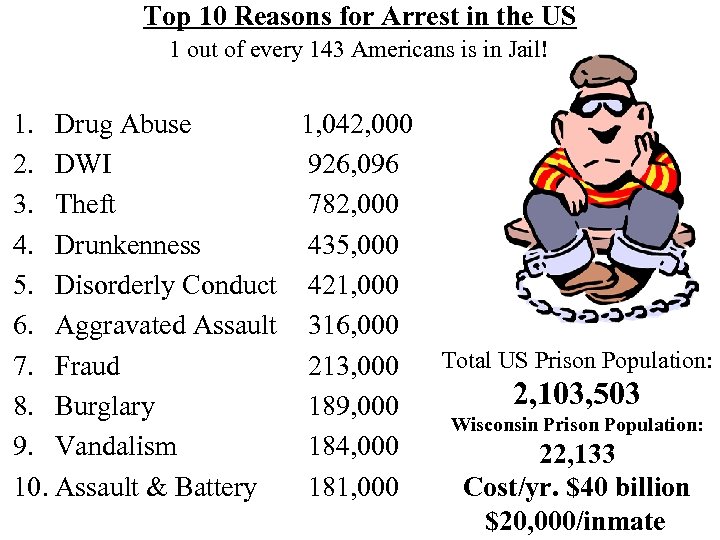
Top 10 Reasons for Arrest in the US 1 out of every 143 Americans is in Jail! 1. Drug Abuse 2. DWI 3. Theft 4. Drunkenness 5. Disorderly Conduct 6. Aggravated Assault 7. Fraud 8. Burglary 9. Vandalism 10. Assault & Battery 1, 042, 000 926, 096 782, 000 435, 000 421, 000 316, 000 213, 000 189, 000 184, 000 181, 000 Total US Prison Population: 2, 103, 503 Wisconsin Prison Population: 22, 133 Cost/yr. $40 billion $20, 000/inmate

See Kapco’s Substance Abuse Policy

Kapco’s Substance Abuse Policy

Working Poor • Of the 46, 000 Americans who are not yet married, median earnings $17, 000 • For single womenhead of households, median income: $18, 472
The Working Poor HELP ANTED W • Income less than $8. 00/Hour • Yearly incomes less than $25, 000 for a family of 4 • 30% of Americans: 74, 000 people!
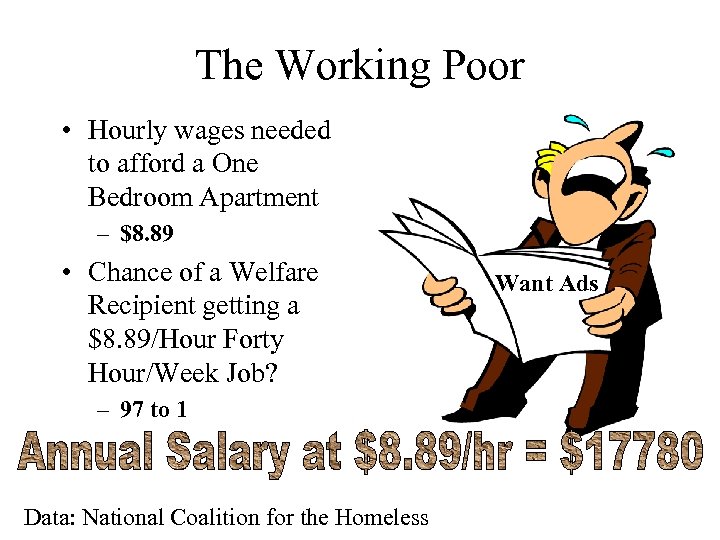
The Working Poor • Hourly wages needed to afford a One Bedroom Apartment – $8. 89 • Chance of a Welfare Recipient getting a $8. 89/Hour Forty Hour/Week Job? – 97 to 1 Data: National Coalition for the Homeless Want Ads
Part-Time Employment • Part time workers in the US: 25, 000 • Underemployed, part timers who wish to be full time, 4. 9 million
Manufacturing Jobs Lost • Worldwide 22 million • USA – 2. 8 million • Japan lost 16% of its manufacturing jobs • Brazil lost 20% of its manufacturing jobs • China lost 15% • Worldwide output of manufactured goods – up 30%! – US steel output up 25% since 1982 – Total US steel workers down 75% since 1982
US Data 2006 – Biggest Job Declines • Production Jobs of Durable goods: down 32. 3% • Total Manufacturing Jobs: down 15% • Computer and electronic manufacturing: down 4. 6% • Publishing & Journalism: down 4. 3% • Government Jobs – Federal: down 6% – State: down 2. 2% Source: Bureau of Labor Statistics 5/16/2006
Year Millions Unemployed 1994 1995 1996 1997 1998 1999 2000 2001 2002 2003 2004 2005 2006 • 8. 1% or 6, 100, 000 families had 7, 996, 000 an unemployed member 7, 404, 000 • Of the nation’s 75. 3 million 7, 236, 000 families, 82. 0 % had at 6, 739, 000 least one employed member 6, 210, 000 in 2003 down. 4% since 2002 5, 880, 000 5, 692, 000 6, 801, 000 8, 378, 000 8, 774, 000 8, 500, 000 7, 700, 000 7, 200, 000* *projection
World Poverty • Despite 37, 000 poor Americans Worldwide poverty is even greater!
World Population? Six Billion! 6, 000, 000 And growing fast! http: //www. census. gov/cgi-bin/ipc/popclockw Click on this link to visit the world population clock!
Earth’s Population as just 100 People! • There would be 57 Asians, 21 Europeans, 14 People from the Western Hemisphere, and 8 Africans • 51 Females, 49 Males • 70 Non-white, 30 White • No one would own a computer • Only one would have a college degree • 1 would be near birth • 80 would live in substandard housing • 70 would be unable to read • 50 would be malnourished • 50% of the world’s wealth would be in the hands of 6 people and they would be Americans!
Enduring Terrors in Our World Econ Students Killed By Boredom 24, 000 • The number of people who die each day from hunger? • 24, 000 • The number of children killed by diarrhea each day? • 6020 • The number of children killed by measles every day? • 2700
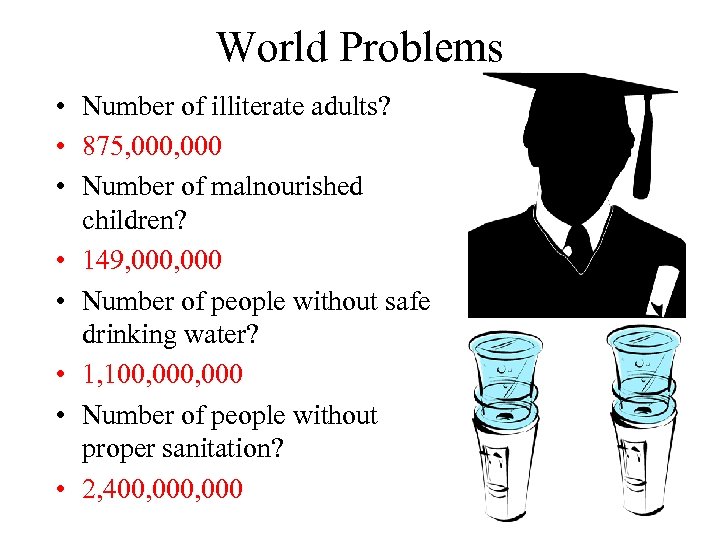
World Problems • Number of illiterate adults? • 875, 000 • Number of malnourished children? • 149, 000 • Number of people without safe drinking water? • 1, 100, 000 • Number of people without proper sanitation? • 2, 400, 000
Troubles for kids • Number of African children living with HIV? • 1, 100, 000 • Number of kids without basic education? • 100, 000 • Number of women who die each year in pregnancy? • 515, 000 • Kids made homeless by war? • 1, 200, 000
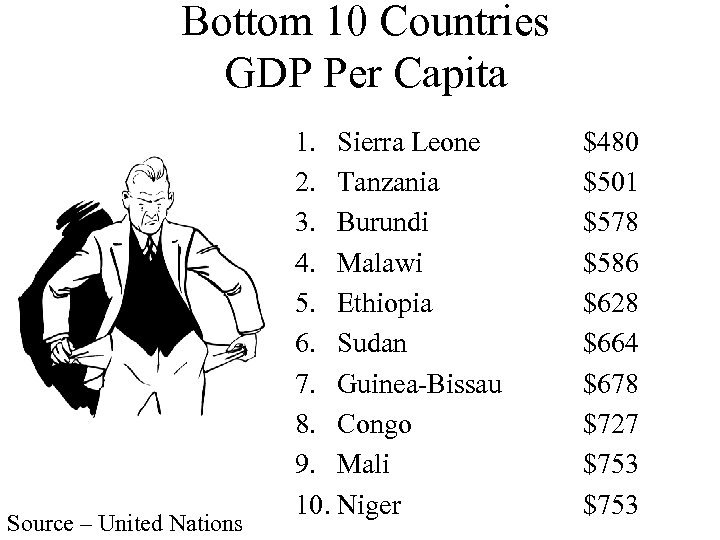
Bottom 10 Countries GDP Per Capita Source – United Nations 1. Sierra Leone 2. Tanzania 3. Burundi 4. Malawi 5. Ethiopia 6. Sudan 7. Guinea-Bissau 8. Congo 9. Mali 10. Niger $480 $501 $578 $586 $628 $664 $678 $727 $753
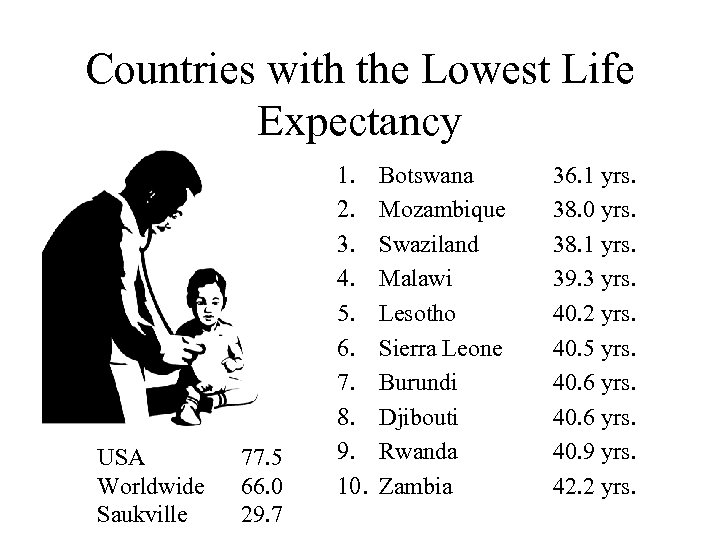
Countries with the Lowest Life Expectancy USA Worldwide Saukville 77. 5 66. 0 29. 7 1. 2. 3. 4. 5. 6. 7. 8. 9. 10. Botswana Mozambique Swaziland Malawi Lesotho Sierra Leone Burundi Djibouti Rwanda Zambia 36. 1 yrs. 38. 0 yrs. 38. 1 yrs. 39. 3 yrs. 40. 2 yrs. 40. 5 yrs. 40. 6 yrs. 40. 9 yrs. 42. 2 yrs.

How can I be a Yuppie? • Get an education • Own/Start your own business • Develop a unique/marketable skill Yuppie? ? Young Urban Professional!
College Degrees in the USA 2000 • 24. 4% of the US population over 25 yrs. has a bachelors degree or higher. • Wisconsin is 22. 4% • Massachusetts is 33. 2% • West Virginia 14. 8% • Washington DC. ? At 41. 1% DC has more people with BS Degrees than any other city!
10 Largest University Systems in the World College Students US: 14, 261, 778 Colleges US: 8, 407 1. Paris, France…………. . 311, 163 2. Calcutta, India………… 300, 000 3. Mexico City…………. . . 269, 000 4. Bombay, India………… 262, 350 5. Guadalajara, Mexico…. 214, 986 6. Rome, Italy…………. . 189, 000 7. Buenos Aires………. …. 183, 397 8. Rajasthan, India………. 175, 000 9. University California…. 157, 331 10. University Wisconsin… 153, 379
Rankings on the Percent of College Graduates 1. Massachusetts 2. Colorado 3. Connecticut 4. Maryland 5. New Jersey 29. Wisconsin 46. Louisiana 47. Kentucky 48. Mississippi 49. Arkansas 50. West Virginia 33. 2% 32. 7% 31. 4% 29. 8% 22. 4% 18. 4% 17. 1% 16. 9% 16. 7% 14. 8% 24. 4% of US Citizens 25 or older Have a college degree!
Education & Jobs in Midwest College Grad’s % College State Salary: Grads: • • Minnesota Ohio Michigan Illinois Indiana Wisconsin Iowa USA $ 59, 934 $ 59, 216 $ 59, 195 $ 58, 885 $ 58, 628 $ 52, 755 $ 47, 050 $ 59, 394 21% of all jobs Nationally are in Information, Business, and Professional Service. In WI on 16. 4% of jobs are of those kind. 32. 5% 24. 6% 24. 4% 27. 4% 21. 1% 25. 6% 24. 3% 27. 7%
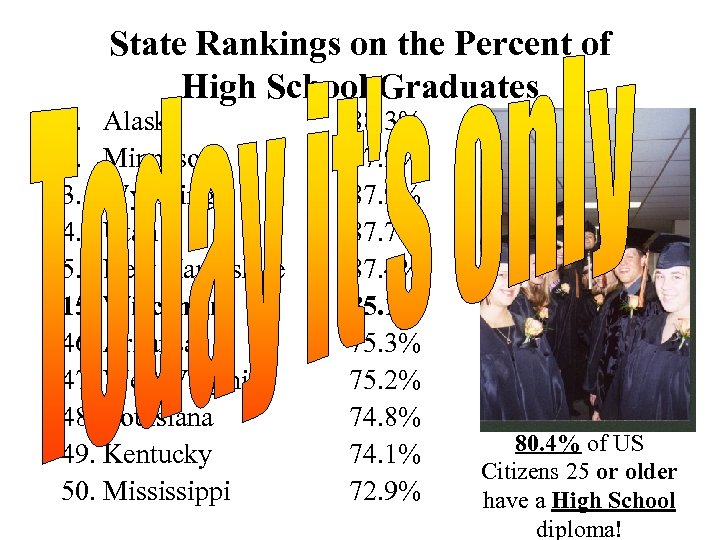
State Rankings on the Percent of High School Graduates 1. Alaska 2. Minnesota 3. Wyoming 4. Utah 5. New Hampshire 15. Wisconsin 46. Arkansas 47. West Virginia 48. Louisiana 49. Kentucky 50. Mississippi 88. 3% 87. 9% 87. 7% 87. 4% 85. 1% 75. 3% 75. 2% 74. 8% 74. 1% 72. 9% 80. 4% of US Citizens 25 or older have a High School diploma!
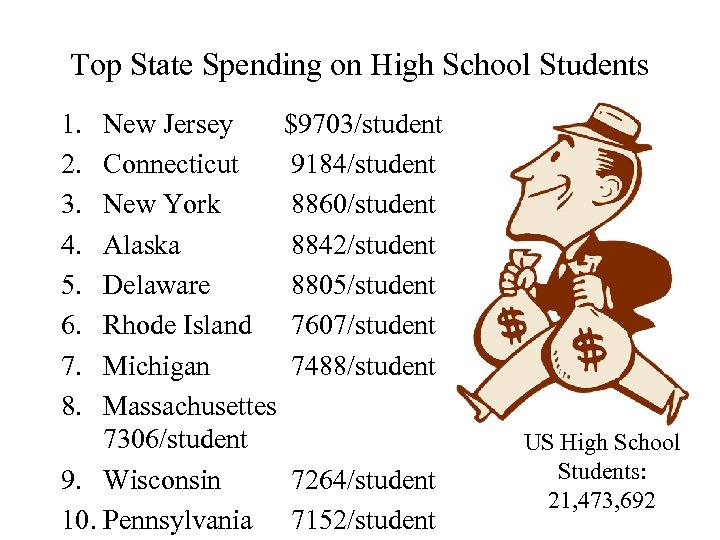
Top State Spending on High School Students 1. 2. 3. 4. 5. 6. 7. 8. New Jersey $9703/student Connecticut 9184/student New York 8860/student Alaska 8842/student Delaware 8805/student Rhode Island 7607/student Michigan 7488/student Massachusettes 7306/student 9. Wisconsin 7264/student 10. Pennsylvania 7152/student US High School Students: 21, 473, 692

Grafton High School Class of 2006 • 67% will attend a 2 year or 4 year college • 28% will attend a technical or vocational school • 95% will remain in school!!! • GHS
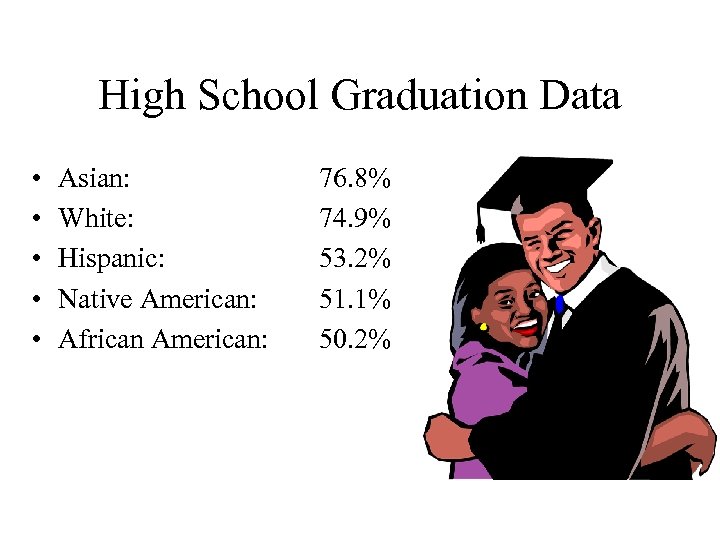
High School Graduation Data • • • Asian: White: Hispanic: Native American: African American: 76. 8% 74. 9% 53. 2% 51. 1% 50. 2%
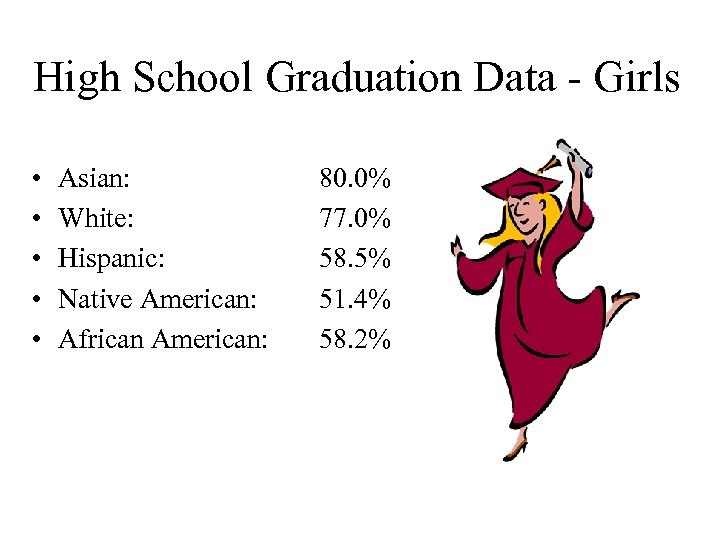
High School Graduation Data - Girls • • • Asian: White: Hispanic: Native American: African American: 80. 0% 77. 0% 58. 5% 51. 4% 58. 2%
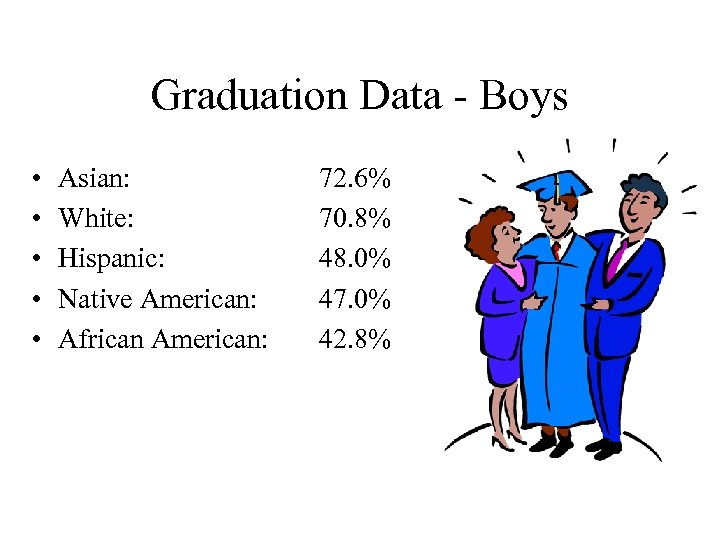
Graduation Data - Boys • • • Asian: White: Hispanic: Native American: African American: 72. 6% 70. 8% 48. 0% 47. 0% 42. 8%
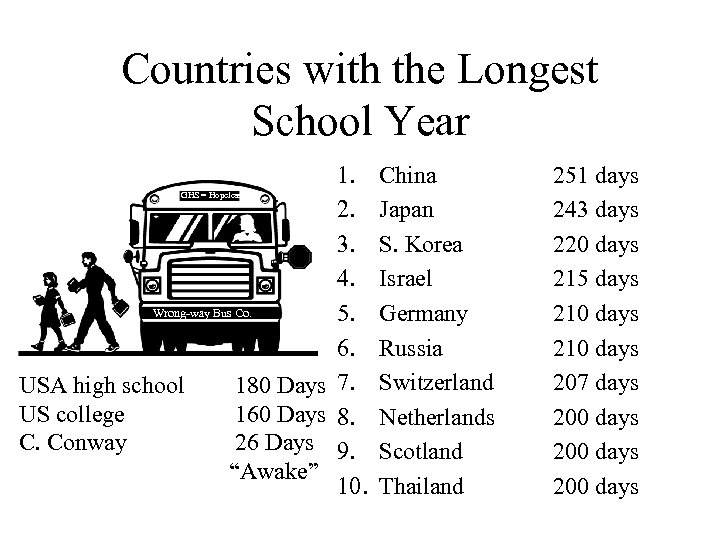
Countries with the Longest School Year GHS = Hopeless Wrong-way Bus Co. USA high school 180 Days US college 160 Days C. Conway 26 Days “Awake” 1. 2. 3. 4. 5. 6. 7. 8. 9. 10. China Japan S. Korea Israel Germany Russia Switzerland Netherlands Scotland Thailand 251 days 243 days 220 days 215 days 210 days 207 days 200 days

College Tips Insurance • Insurance coverage ends with graduation! • High School Grads covered to age 19 • Full-time college students covered to graduation or age 25 • Part-time students earning less than $900/month covered to graduation or age 25

Education is a Sorting Mechanism It is About Hoops!

List your top 5 professions? • The Jobs that would be fun to do? • The Job you would like to have? • The Job you enjoy watching someone do so you don’t have to do it?
Do all college degrees have the same value? College Degree and Average Starting Salary • Get a degree in teaching: $26, 640 • Get a degree in social work: $26, 242 • Get a ballet history degree: $14, 000 • Get a history degree: $30, 095 • Get a Liberal Arts degree: $26, 500 • Get a degree in police science: $29, 860
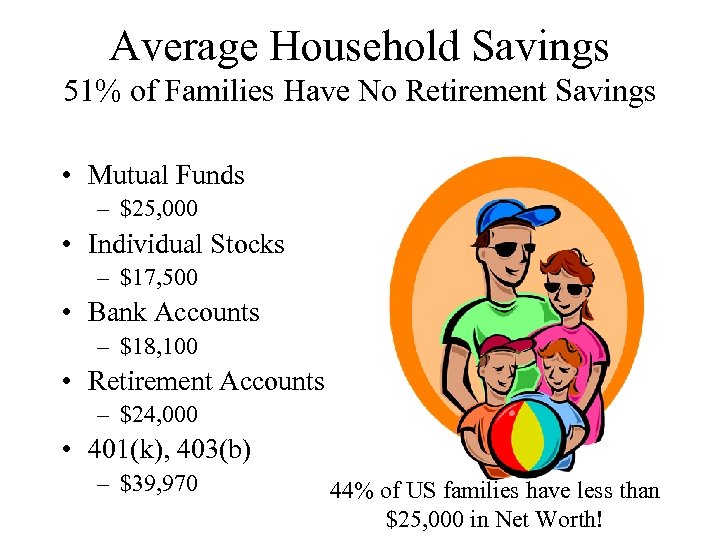
Average Household Savings 51% of Families Have No Retirement Savings • Mutual Funds – $25, 000 • Individual Stocks – $17, 500 • Bank Accounts – $18, 100 • Retirement Accounts – $24, 000 • 401(k), 403(b) – $39, 970 44% of US families have less than $25, 000 in Net Worth!
Stocks, Bonds, Mutual Funds? • 70, 000 Americans own stocks directly or indirectly • 48. 8% of American Families • 19. 2% Own shares of stock • 9. 5% of Americans have no bank savings or checking account! • 6. 5% of Americans trade stock online!
Debts and Loans Consumer Debt: $2. 4 Trillion • Average mortgage payment US: $820/month • Median mortgage payment US: $1, 507 • Average Credit Card debt: $3000/month • Average yearly charitable contribution: $3125 –
How we spend our income: • • Housing: 33% Transportation: 18. 6% Food: 13. 5% Savings including FICA: 8. 4% • Entertainment: 4. 9% • Apparel: 4. 7% • Miscellaneous: 11. 5%

500 Billion Deficit 7. 2 Trillion Dollar Debt & A $600 Billion Trade Deficit
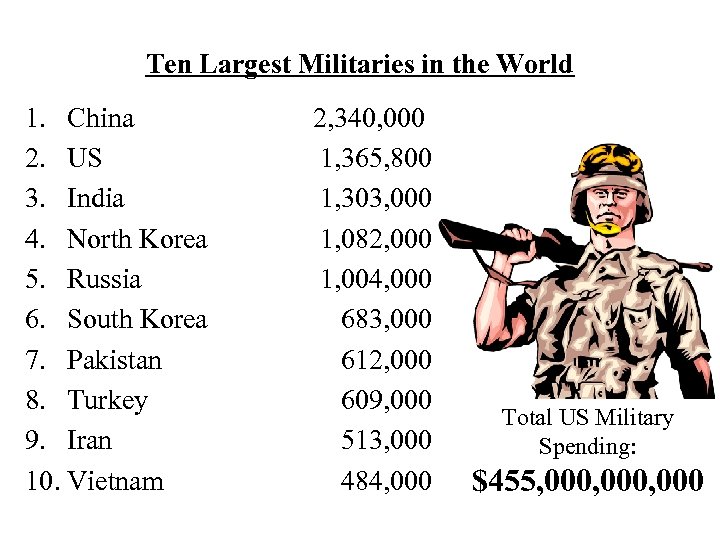
Ten Largest Militaries in the World 1. China 2. US 3. India 4. North Korea 5. Russia 6. South Korea 7. Pakistan 8. Turkey 9. Iran 10. Vietnam 2, 340, 000 1, 365, 800 1, 303, 000 1, 082, 000 1, 004, 000 683, 000 612, 000 609, 000 513, 000 484, 000 Total US Military Spending: $455, 000, 000
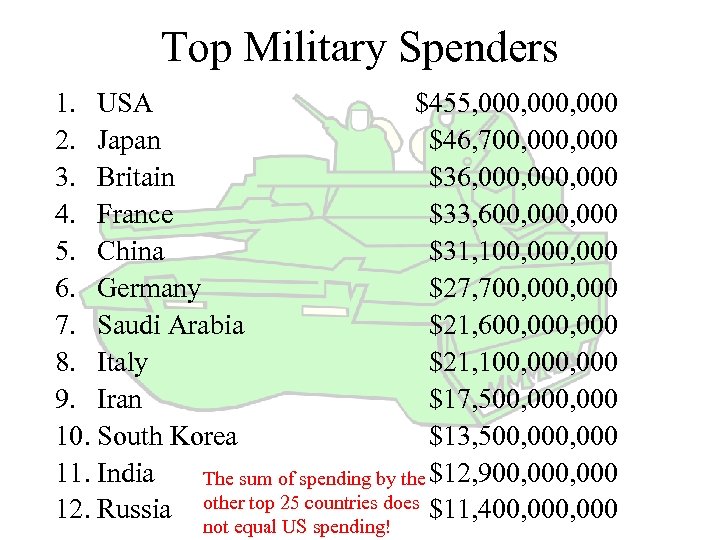
Top Military Spenders 1. USA $455, 000, 000 2. Japan $46, 700, 000 3. Britain $36, 000, 000 4. France $33, 600, 000 5. China $31, 100, 000 6. Germany $27, 700, 000 7. Saudi Arabia $21, 600, 000 8. Italy $21, 100, 000 9. Iran $17, 500, 000 10. South Korea $13, 500, 000 11. India $12, 900, 000 The sum of spending by the 12. Russia other top 25 countries does $11, 400, 000 not equal US spending!

Although the Yorktown is lost, the US sank 4 Japanese carriers at Midway breaking the back of the Japanese Navy putting them on the DEFENSIVE for the rest of World War II. Japan will never build & launch another carrier during World War II. The US will build & launch over 100! Aircraft Carriers 2006: US 27 Aircraft Carries 1945: Japan 6 US 100+ Britain 3 The Rest of the World France 3 Zero World: 22 Russia 2 US: 27 Italy 2 India 1 Brazil 1 Spain 1 China 2 Chile 2 Peru 2

ﺍﺗﺴﺎﻉ ﺩﺍﺋﺮﺓ ﺍﻟﻐﻀﺐ ﻋﻠﻰ ﺗﺪﻧﻴﺲ ﺍﻷﻤﻴﺮﻛﻴﻴﻦ ﻟﻠﻘﺮآﻦ ﺑﻐﻮﺍﻧﺘﺎﻧﺎﻣﻮ
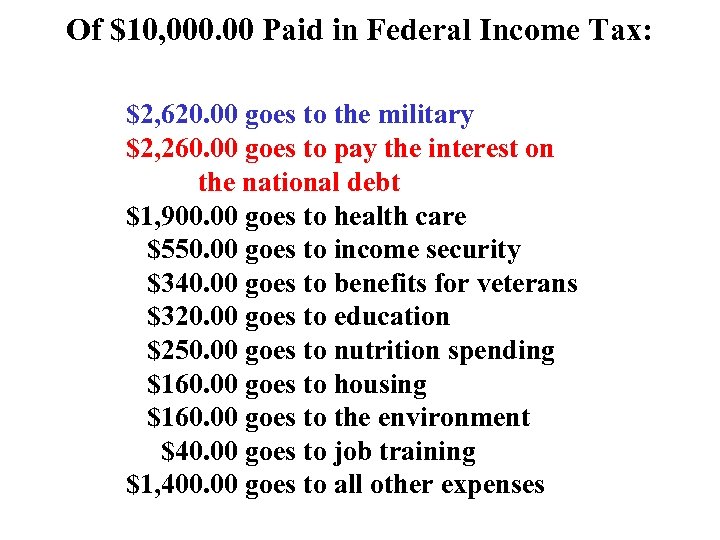
Of $10, 000. 00 Paid in Federal Income Tax: $2, 620. 00 goes to the military $2, 260. 00 goes to pay the interest on the national debt $1, 900. 00 goes to health care $550. 00 goes to income security $340. 00 goes to benefits for veterans $320. 00 goes to education $250. 00 goes to nutrition spending $160. 00 goes to housing $160. 00 goes to the environment $40. 00 goes to job training $1, 400. 00 goes to all other expenses
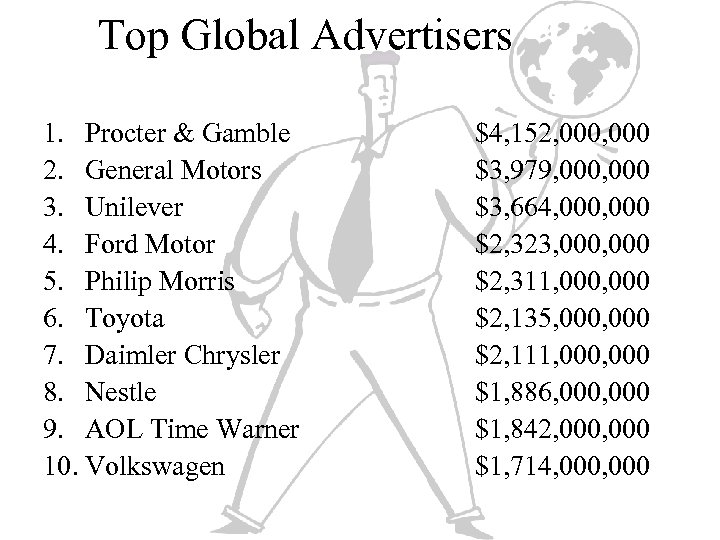
Top Global Advertisers 1. Procter & Gamble 2. General Motors 3. Unilever 4. Ford Motor 5. Philip Morris 6. Toyota 7. Daimler Chrysler 8. Nestle 9. AOL Time Warner 10. Volkswagen $4, 152, 000 $3, 979, 000 $3, 664, 000 $2, 323, 000 $2, 311, 000 $2, 135, 000 $2, 111, 000 $1, 886, 000 $1, 842, 000 $1, 714, 000
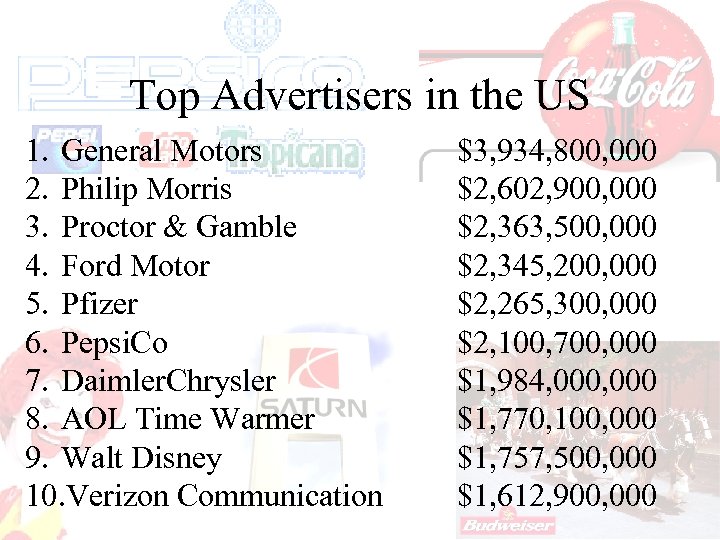
Top Advertisers in the US 1. General Motors 2. Philip Morris 3. Proctor & Gamble 4. Ford Motor 5. Pfizer 6. Pepsi. Co 7. Daimler. Chrysler 8. AOL Time Warmer 9. Walt Disney 10. Verizon Communication $3, 934, 800, 000 $2, 602, 900, 000 $2, 363, 500, 000 $2, 345, 200, 000 $2, 265, 300, 000 $2, 100, 700, 000 $1, 984, 000 $1, 770, 100, 000 $1, 757, 500, 000 $1, 612, 900, 000
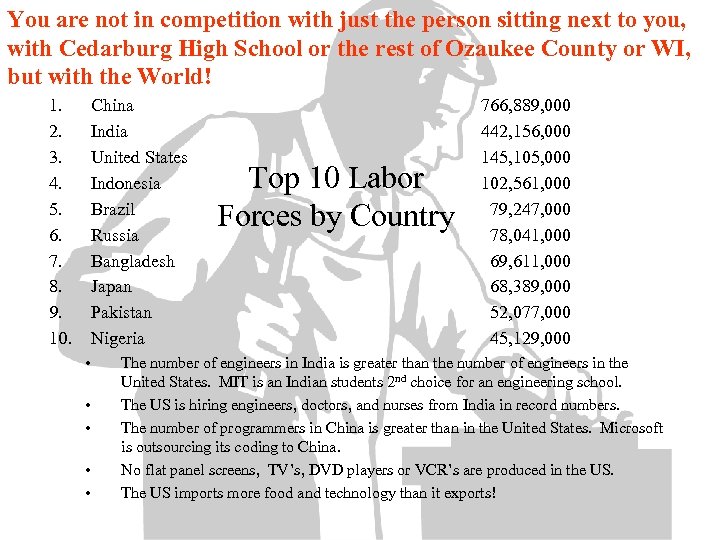
You are not in competition with just the person sitting next to you, with Cedarburg High School or the rest of Ozaukee County or WI, but with the World! 1. 2. 3. 4. 5. 6. 7. 8. 9. 10. China India United States Indonesia Brazil Russia Bangladesh Japan Pakistan Nigeria • • • Top 10 Labor Forces by Country 766, 889, 000 442, 156, 000 145, 105, 000 102, 561, 000 79, 247, 000 78, 041, 000 69, 611, 000 68, 389, 000 52, 077, 000 45, 129, 000 The number of engineers in India is greater than the number of engineers in the United States. MIT is an Indian students 2 nd choice for an engineering school. The US is hiring engineers, doctors, and nurses from India in record numbers. The number of programmers in China is greater than in the United States. Microsoft is outsourcing its coding to China. No flat panel screens, TV’s, DVD players or VCR’s are produced in the US. The US imports more food and technology than it exports!
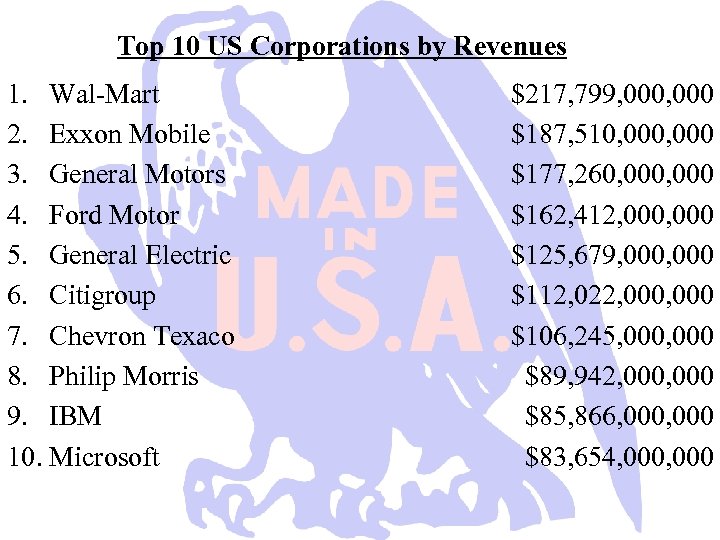
Top 10 US Corporations by Revenues 1. Wal-Mart 2. Exxon Mobile 3. General Motors 4. Ford Motor 5. General Electric 6. Citigroup 7. Chevron Texaco 8. Philip Morris 9. IBM 10. Microsoft $217, 799, 000 $187, 510, 000 $177, 260, 000 $162, 412, 000 $125, 679, 000 $112, 022, 000 $106, 245, 000 $89, 942, 000 $85, 866, 000 $83, 654, 000
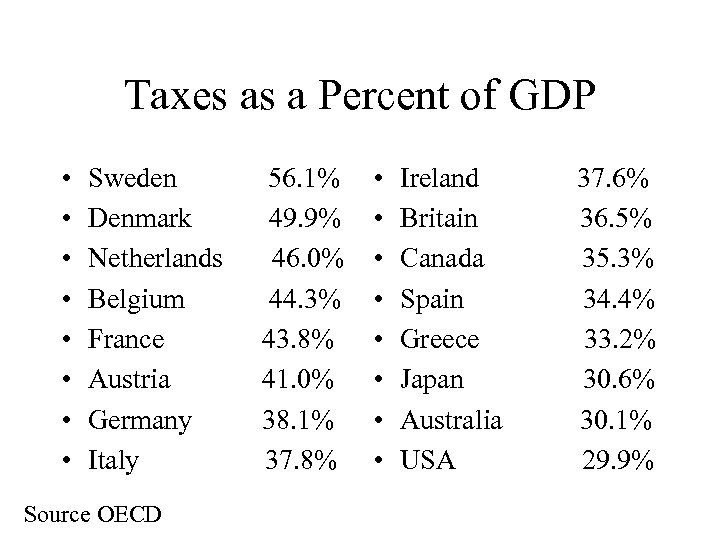
Taxes as a Percent of GDP • • Sweden 56. 1% Denmark 49. 9% Netherlands 46. 0% Belgium 44. 3% France 43. 8% Austria 41. 0% Germany 38. 1% Italy 37. 8% Source OECD • • Ireland 37. 6% Britain 36. 5% Canada 35. 3% Spain 34. 4% Greece 33. 2% Japan 30. 6% Australia 30. 1% USA 29. 9%

Are we as a NATION moving fast enough? • Are other nations envious of our standard of living? • Do other workers desire your level of wages? • Are kids in other countries working harder to get what you take for granted? • Do you face global competition for limited resources?
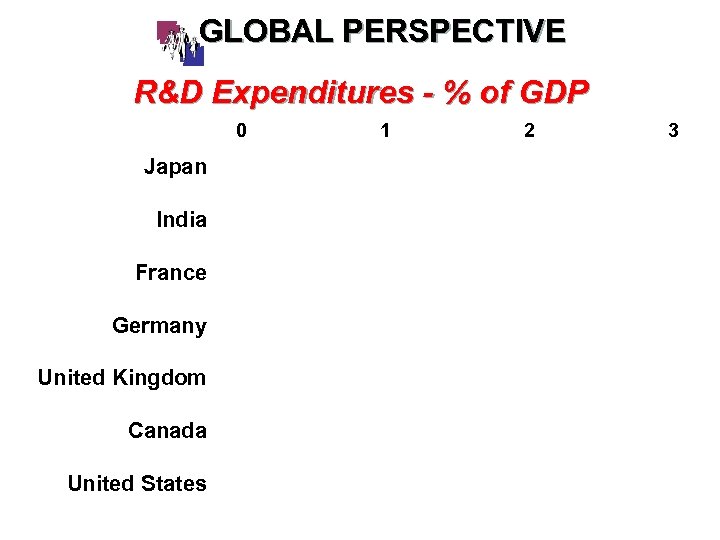
GLOBAL PERSPECTIVE R&D Expenditures - % of GDP 0 Japan India France Germany United Kingdom Canada United States 1 2 3
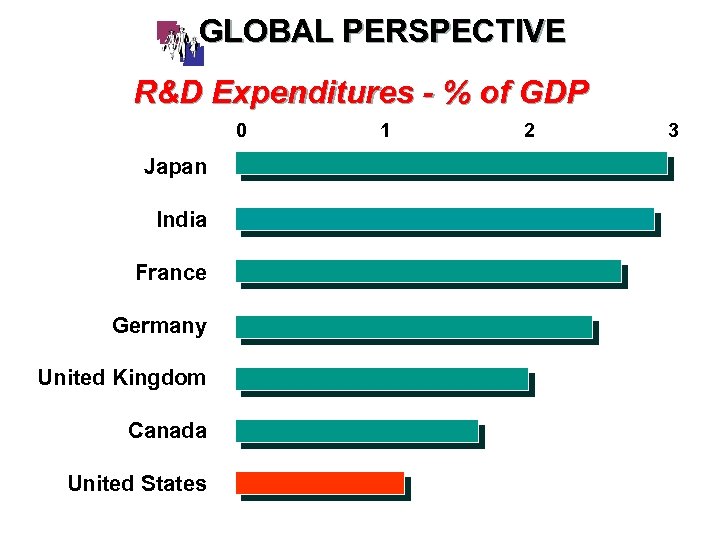
GLOBAL PERSPECTIVE R&D Expenditures - % of GDP 0 Japan India France Germany United Kingdom Canada United States 1 2 3
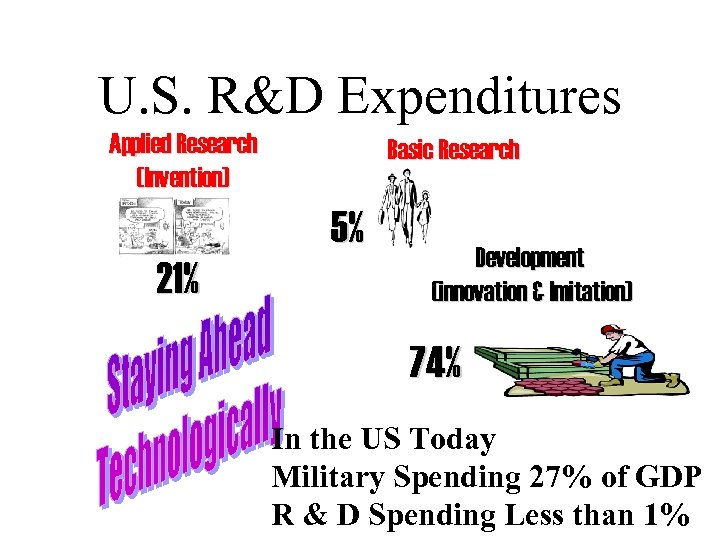
U. S. R&D Expenditures Applied Research (Invention) Basic Research 5% 21% Development (innovation & Imitation) 74% In the US Today Military Spending 27% of GDP R & D Spending Less than 1%
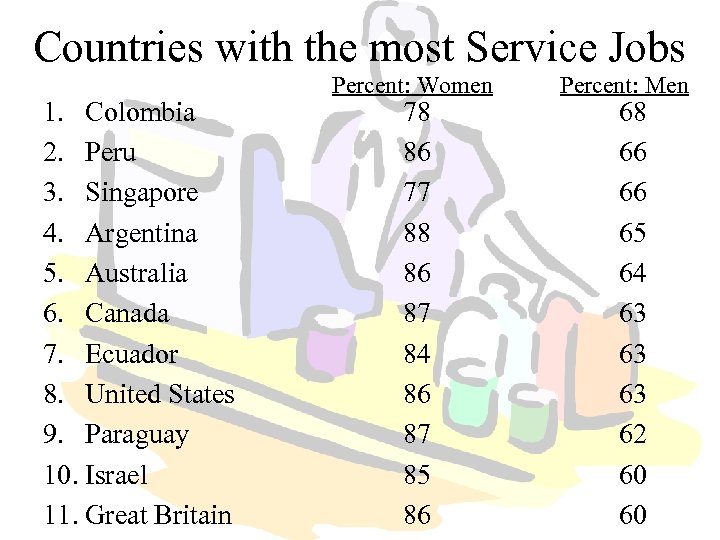
Countries with the most Service Jobs 1. Colombia 2. Peru 3. Singapore 4. Argentina 5. Australia 6. Canada 7. Ecuador 8. United States 9. Paraguay 10. Israel 11. Great Britain Percent: Women 78 86 77 88 86 87 84 86 87 85 86 Percent: Men 68 66 66 65 64 63 63 63 62 60 60
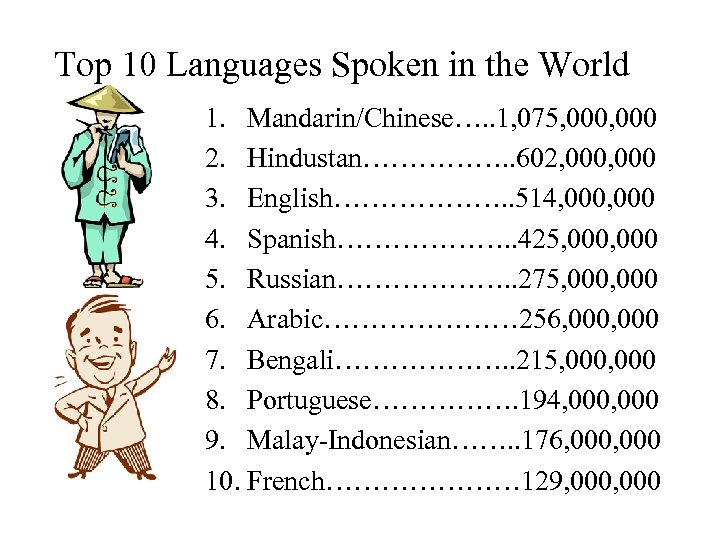
Top 10 Languages Spoken in the World 1. Mandarin/Chinese…. . 1, 075, 000 2. Hindustan……………. . 602, 000 3. English………………. . 514, 000 4. Spanish………………. . 425, 000 5. Russian………………. . 275, 000 6. Arabic………………… 256, 000 7. Bengali………………. . 215, 000 8. Portuguese……………. 194, 000 9. Malay-Indonesian……. . 176, 000 10. French………………… 129, 000
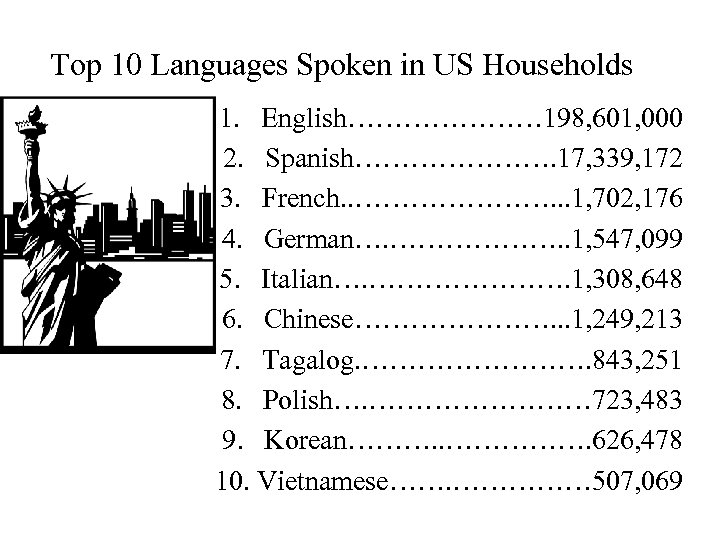
Top 10 Languages Spoken in US Households 1. English………………… 198, 601, 000 2. Spanish…………………. 17, 339, 172 3. French. . …………………. . . 1, 702, 176 4. German…. ………………. . 1, 547, 099 5. Italian…. …………………. 1, 308, 648 6. Chinese…………………. . . 1, 249, 213 7. Tagalog. …………. 843, 251 8. Polish…. ………… 723, 483 9. Korean………. . ……………. 626, 478 10. Vietnamese……. …………… 507, 069
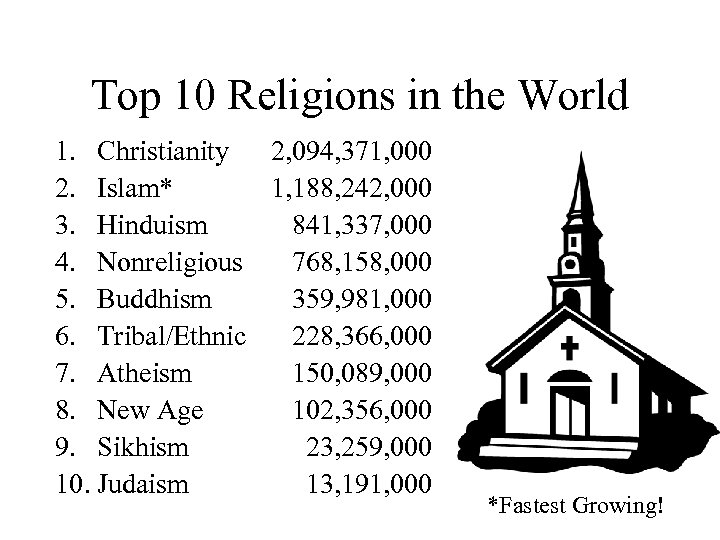
Top 10 Religions in the World 1. Christianity 2. Islam* 3. Hinduism 4. Nonreligious 5. Buddhism 6. Tribal/Ethnic 7. Atheism 8. New Age 9. Sikhism 10. Judaism 2, 094, 371, 000 1, 188, 242, 000 841, 337, 000 768, 158, 000 359, 981, 000 228, 366, 000 150, 089, 000 102, 356, 000 23, 259, 000 13, 191, 000 *Fastest Growing!
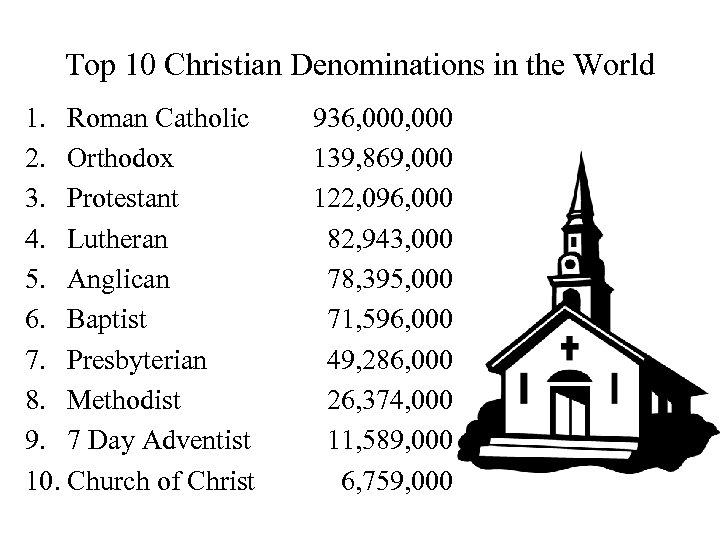
Top 10 Christian Denominations in the World 1. Roman Catholic 2. Orthodox 3. Protestant 4. Lutheran 5. Anglican 6. Baptist 7. Presbyterian 8. Methodist 9. 7 Day Adventist 10. Church of Christ 936, 000 139, 869, 000 122, 096, 000 82, 943, 000 78, 395, 000 71, 596, 000 49, 286, 000 26, 374, 000 11, 589, 000 6, 759, 000
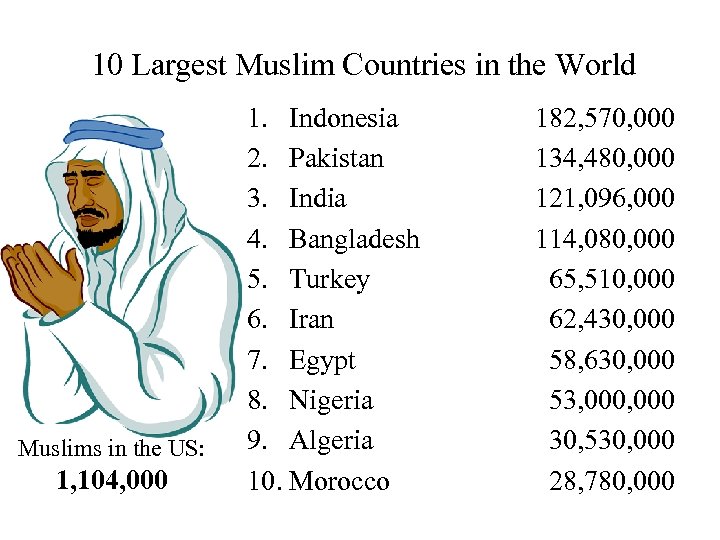
10 Largest Muslim Countries in the World Muslims in the US: 1, 104, 000 1. Indonesia 2. Pakistan 3. India 4. Bangladesh 5. Turkey 6. Iran 7. Egypt 8. Nigeria 9. Algeria 10. Morocco 182, 570, 000 134, 480, 000 121, 096, 000 114, 080, 000 65, 510, 000 62, 430, 000 58, 630, 000 53, 000 30, 530, 000 28, 780, 000
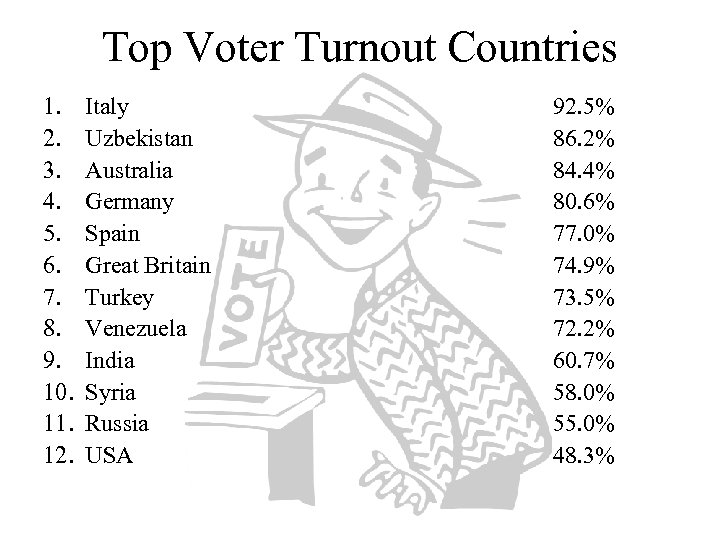
Top Voter Turnout Countries 1. 2. 3. 4. 5. 6. 7. 8. 9. 10. 11. 12. Italy Uzbekistan Australia Germany Spain Great Britain Turkey Venezuela India Syria Russia USA 92. 5% 86. 2% 84. 4% 80. 6% 77. 0% 74. 9% 73. 5% 72. 2% 60. 7% 58. 0% 55. 0% 48. 3%
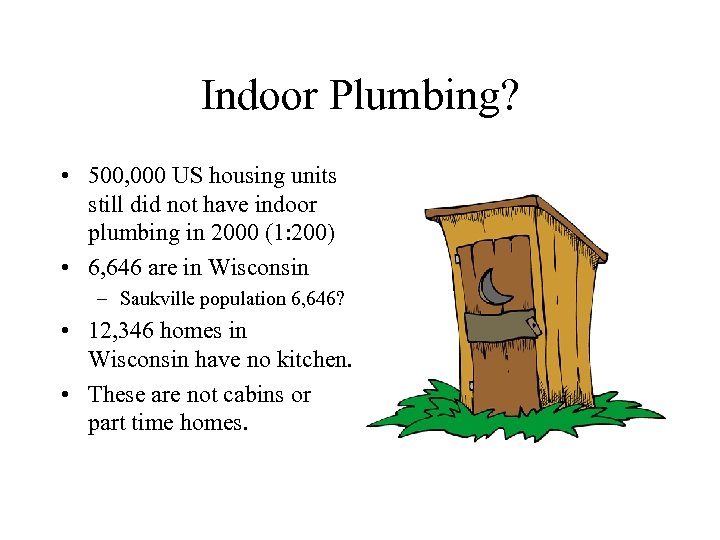
Indoor Plumbing? • 500, 000 US housing units still did not have indoor plumbing in 2000 (1: 200) • 6, 646 are in Wisconsin – Saukville population 6, 646? • 12, 346 homes in Wisconsin have no kitchen. • These are not cabins or part time homes.

Writing Prompt • Write in complete sentences. Each topic addressed is worth 15 points. • You will have to wait until class to get the prompt!! • See you tomorrow!!!!
08d16d068ec2642ac08fd1d6aa1c0c16.ppt