

3f860466690998e7d2e7962faf2d3d38.ppt
- Количество слайдов: 62
 Discussions on Flagship Programmes Development of Horticulture in Andhra Pradesh Commissioner of Horticulture Andhra Pradesh
 HORTICULTURE PROFILE OF ANDHRA PRADESH Ø The total geographical area Ø Net area sown Ø Agro-climatic Zones Ø Cultivable waste Ø Area Under Horticulture Crops Ø Additional area proposed to be brought under Horticulture - 275. 04 Lakh Ha. 102. 39 Lakh Ha. 9 Nos. 6. 95 Lakh Ha. 19. 89 Lakh Ha. - 2. 50 Lakh Ha. AREA & PRODUCTION OF HORTICULTURE CROPS 2008 -09 Sl. No. Crop Category Area Production (in Lakh Ha. ) (in Lakh MTs. ) 1 Fresh Fruits 9. 36 131. 65 2 Plantation Crops 3. 86 6. 76 3 Vegetables & Tuber Crops 3. 25 52. 67 4 Flowers 0. 19 1. 25 5 Spices 3. 03 11. 51 6 Medicinal & Aromatic Plants 0. 20 0. 77 19. 89 204. 61 TOTAL
 Percentage of Horticulture crops against cropped area in various Agro-climatic zones of A. P. Ø North coastal zone Mango, Banana, cashew Ø Godavari zone Ø Krishna zone Chillies, Mango, citrus Ø Southern zone 26% Mango, citrus, Banana, Cashew, Mango 20% 28% 25% Ø Scarce rainfall zone Citrus, Papaya, Banana, Chillies 20% Ø Southern Telanagana zone Ø Northern Telangana zone Citrus, Mango, Chillies, Grapes 35% Mango, Chillies, Citrus 07% Ø Central Telangana zone Chillies, Mango, Banana 26% In A. P. Chilles, Mango, Citrus and Banana constitute 21. 5% of the total value of state Agriculture production. Source : WTO Cell, ANGRAU.
 Sector / Crop") Status of A. P. Horticulture Sl. No. Production ( in OOO’MTs) Sector / Crop INDIA A. P. Rank SECTOR 1 Spices 4102. 7 1235. 2 1 2 Fruits 63503 10722. 3 2 3 Flowers (Loose) 654. 08 88. 81 3 CROP 4 Mango 13792. 1 3865. 2 1 5 Citrus 7574. 4 2997. 9 1 6 Papaya 2685. 9 1123. 4 1 7 Tomato 10260. 6 1579 1 Source : NHB Database 2007 -08
Status of A. P. Horticulture Sl. No. Production ( in OOO’MTs) Sector / Crop INDIA A. P. Rank SECTOR 1 Spices 4102. 7 1235. 2 1 2 Fruits 63503 10722. 3 2 3 Flowers (Loose) 654. 08 88. 81 3 CROP 4 Mango 13792. 1 3865. 2 1 5 Citrus 7574. 4 2997. 9 1 6 Papaya 2685. 9 1123. 4 1 7 Tomato 10260. 6 1579 1 Source : NHB Database 2007 -08
 SHARE OF ANDHRA PRADESH IN TOTAL PRODUCTION
 SHARE OF ANDHRA PRADESH IN TOTAL PRODUCTION
 STRENGTHS q Diverse Agro Climatic Zones & Abundant sub-soil water resources. q High production in Mango, Sweet Orange, Spices, Papaya, Tomato. q Large Network of Nurseries / Seed Agencies – both in Private & Public Sector q Enterprising & Progressing farming community. q Horticulture being treated as Focus Area by Govt. q Emphasis on Irrigation Projects.
 WEAKNESSES • Lack of regulation on quality of Plant Material. • Inadequate Post Harvest Management & Marketing Facilities in Production clusters. • Erratic monsoon & inadequate power supply. • Small land holdings & not so strong cooperative ethos. • Weak extension systems – Gap between the potential & actual productivity.
 OPPORTUNITIES • • Availability of vast extents of dry / waste / rain fed lands suitable for Area Expansion Rejuvenation – A promising proposition to increase productivity in crops like Cashew, Mango, Guava, Pomegranate. Converting tribal belts into Organic clusters. Creation of State of Art Post Harvest facilities at Mango clusters by APEDA. Export potential for Mango, Banana, Vegetables & Flowers – International Airport – Potential to became export Hub. Blooming of Retail Fresh Chains in Hyderabad – Can provide impetus to production & ensuring better price realization to grower. Agro based industries can spur generation of employment
 CHALLENGES Ø Increase in Soil & Water Salinity limiting productivity. Ø Virus affected Plant Material – especially for Sweet Orange Ø Real Estate Boom – Affecting Commercial Horticulture in the surrounding districts of Hyderabad. Ø Drought & Cyclone. Ø Tradition of using high Pesticides – Residual issues affecting Overseas Trade. Ø Long chain of middle men between producer
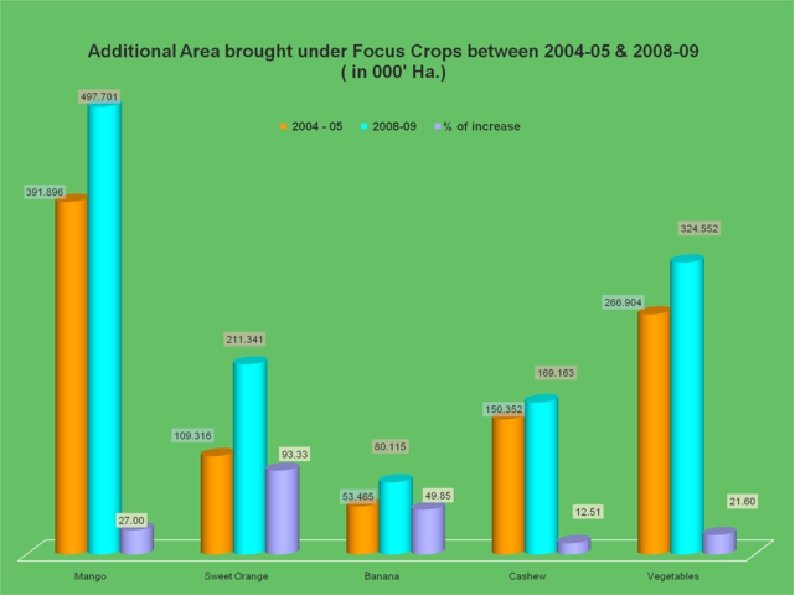
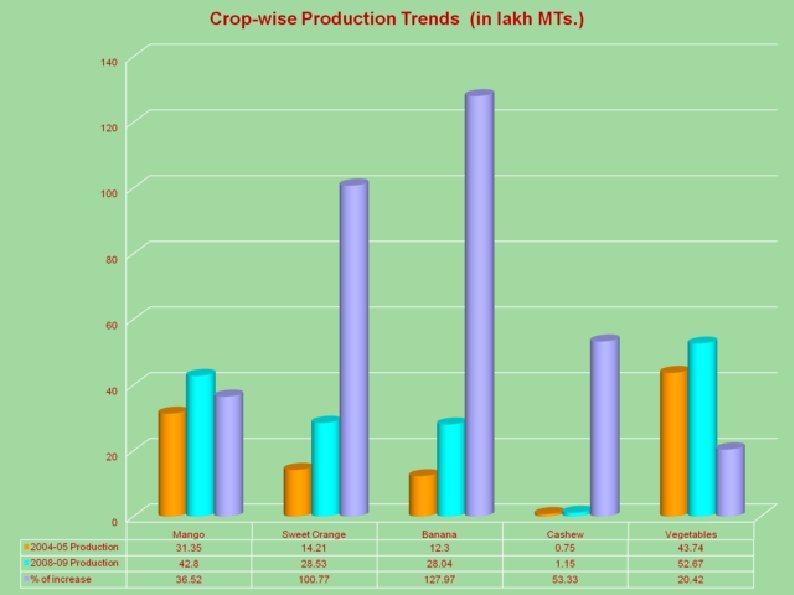
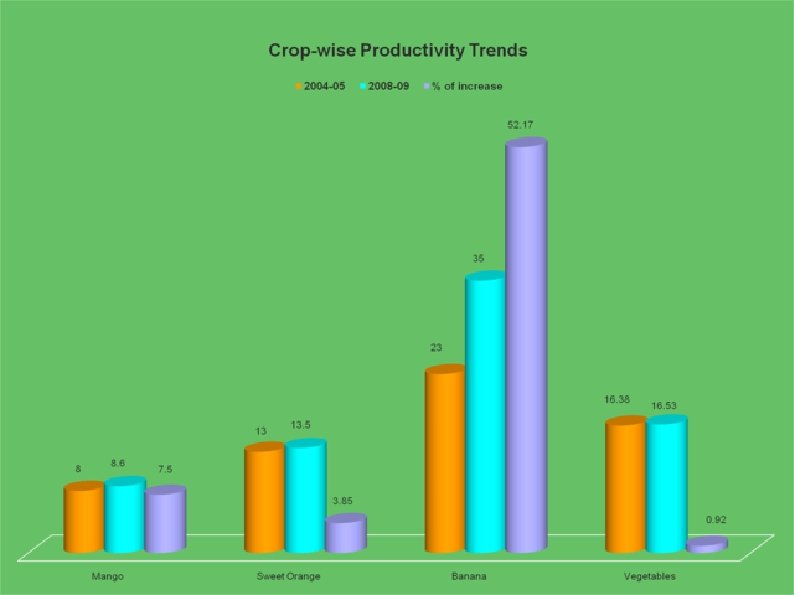
 OUTCOME OF THE PAST FOUR YEARS 2004 -05 Sl. No. Crop 2008 -09 Area Production Productivit Upto Production Productivity y (Ha. ) (Lakh 2008 -09 (Lakh (M. T/Ha. ) 2004 - 05 M. Tons) (Ha. ) 391896 31. 35 8 2 Mango Sweet Orange 109316 14. 21 13 42. 80 497701 (Estimated) 28. 53 211341 (Estimated) 3 Banana 53465 12. 3 23 80115 28. 04 35 4 Sapota 13973 1. 38 9. 87 20593 2. 05 10 5 Acid Lime 50791 6. 6 13 59966 8. 99 15 6 Pomegranate 5761 0. 48 8. 3 6470 7 Cashew 150352 0. 75 0. 5 8 Vegetables 266904 43. 74 16. 38 1 8. 6 13. 5 0. 64 1. 15 169163 (Estimated) 0. 68 324552 16. 53 52. 67 10
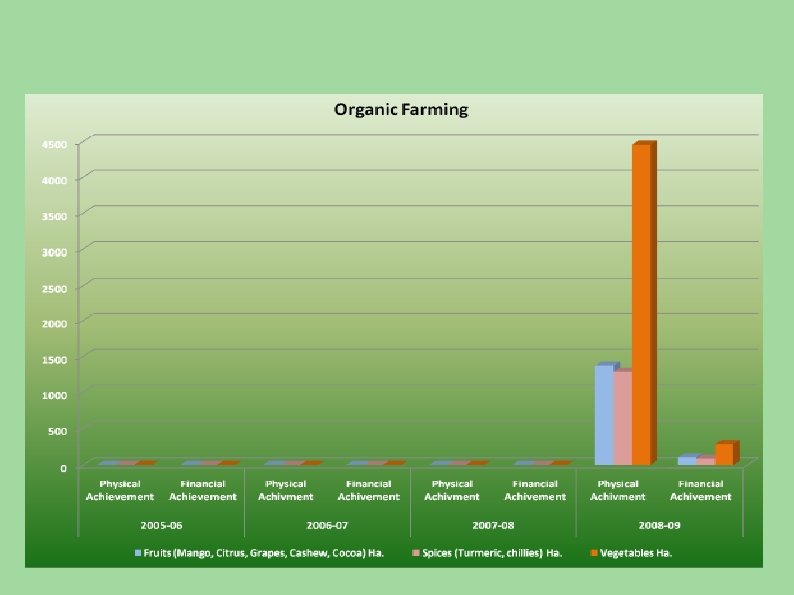
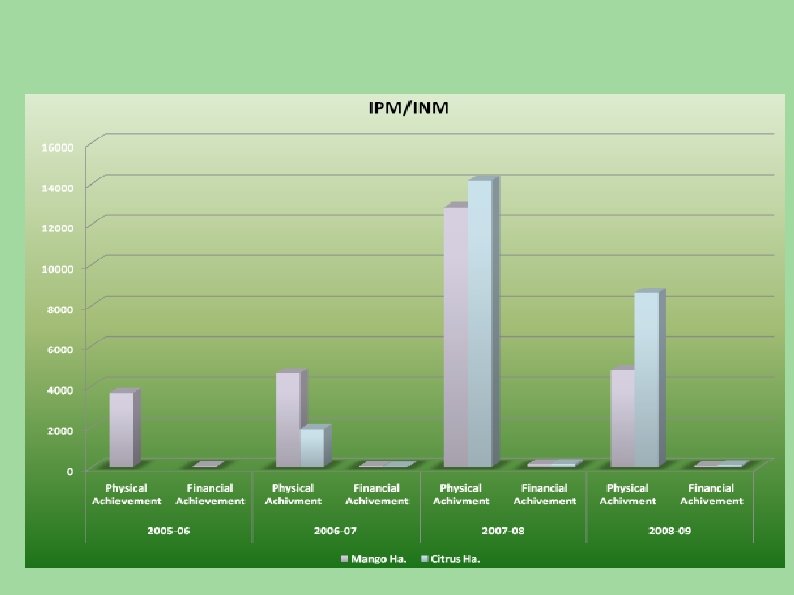
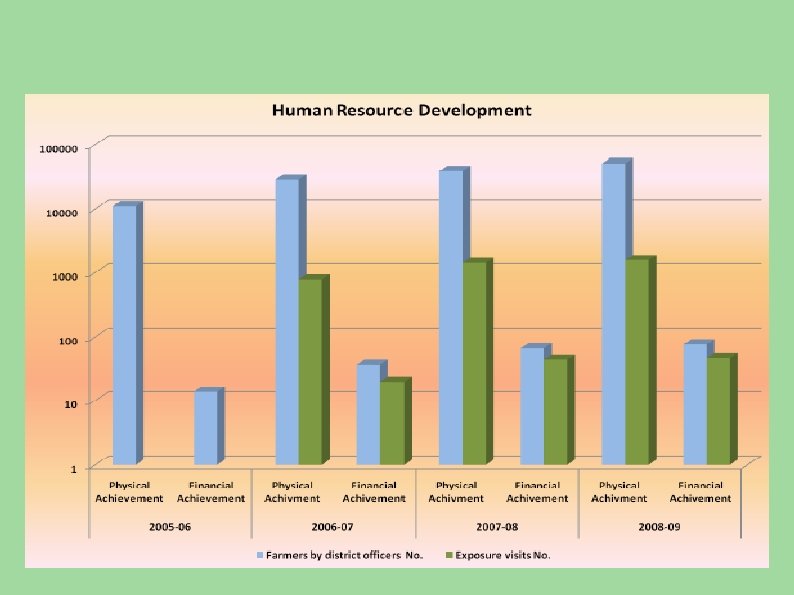
 COMPONENTS Financial Achievement") STATE HORTICULTURE MISSION Achievements sinception ( 2005 -06 to 2008 -09) COMPONENTS Financial Achievement (Rs. in lakhs) Physical Achievement Units ESTABLISHMENT OF NURSERIES ESTABLISHMENT OF NEW GARDENS / AREA EXPANSION REJUVENATION No 133. 00 1, 060. 10 Ha. 179, 854. 82 18, 786. 14 Ha. 44, 361. 77 4, 143. 61 IPM / INM Ha. 69, 266. 72 1, 239. 66 ORGANIC FARMING Ha. 7, 109. 00 486. 76 VERMICOMPOST UNITS No 3, 657. 00 669. 64 HUMAN RESOURCE DEVELOPMENT Training to the Farmers No. 131, 586. 04 193. 13 Exposure visits No. 3, 782. 00 110. 15 POST HARVEST MANAGEMENT No. 1, 658. 00 1, 486. 95 DEVELOPMENT OF MARKET YARDS No. 14. 00 47. 82 0. 00 1, 873. 34 No. 17. 00 241. 43 FARM MECHANIZATION & POST HARVEST TOOLS AWARENESS PROGRAMMES
STATE HORTICULTURE MISSION Achievements sinception ( 2005 -06 to 2008 -09) COMPONENTS Financial Achievement (Rs. in lakhs) Physical Achievement Units ESTABLISHMENT OF NURSERIES ESTABLISHMENT OF NEW GARDENS / AREA EXPANSION REJUVENATION No 133. 00 1, 060. 10 Ha. 179, 854. 82 18, 786. 14 Ha. 44, 361. 77 4, 143. 61 IPM / INM Ha. 69, 266. 72 1, 239. 66 ORGANIC FARMING Ha. 7, 109. 00 486. 76 VERMICOMPOST UNITS No 3, 657. 00 669. 64 HUMAN RESOURCE DEVELOPMENT Training to the Farmers No. 131, 586. 04 193. 13 Exposure visits No. 3, 782. 00 110. 15 POST HARVEST MANAGEMENT No. 1, 658. 00 1, 486. 95 DEVELOPMENT OF MARKET YARDS No. 14. 00 47. 82 0. 00 1, 873. 34 No. 17. 00 241. 43 FARM MECHANIZATION & POST HARVEST TOOLS AWARENESS PROGRAMMES
 Progress at a Glance
 AREA EXPANSION - PERENIALS SWEET ORANGE MANGO
 AREA EXPANSION – NON PERENIALS
 AREA EXPANSION – FLORICULTURE
 REJUVENATION
 REJUVENATION - MANGO
 VERMI COMPOST UNITS
 TRAININGS
 REGIONAL HORTICULTURE TRAINING INSTITUTE FARMERS TRAINED AT RHTI, KADAPA.
 FARM PONDS
 PROTECTED CULTIVATION
 POST HARVEST MANAGEMENT HERITAGE COLD STORAGES – CHITTOOR DURGA COLD STORAGES - GUNTUR
 Progress under RKVY for the year 2008 -09 Achievement SI. No. Physical Financial (in Lakhs) Ha. 2083 116. 48 Ha. Name of the component 52317 1569. 52 Unit I Production improvement in various Horticulture crops II Integrated vegetable production techniques 1 Hybrid Vegetable Seed Distribution Programme 2 Permanent Pandals Acres 285 171 3 Semi Permanent Pandals Acres 1515 454 4 Cultivation with Trellis Acres 402 30. 15 5 Shade Houses for Cultivation of high value vegetables No. 20 16. 5 6 Shade Net Houses for raising of seedlings (1000 sq. mtrs) No. 33 12. 5 7 Poly Houses for cultivation of high value vegetables (in 2000 sq. mtrs) No. 1 6. 5 8 Vegetable Minikits No. 135000 121. 5 2381. 67 TOTAL: III Integrated Pest Management Ha. 182 1. 82 IV Human Resource Development (Training & Exposure visits) No. 15. 00 V Integrated pack house with VHT during 2007 -08 No. 2 355. 5 2870. 5 GRAND TOTAL:
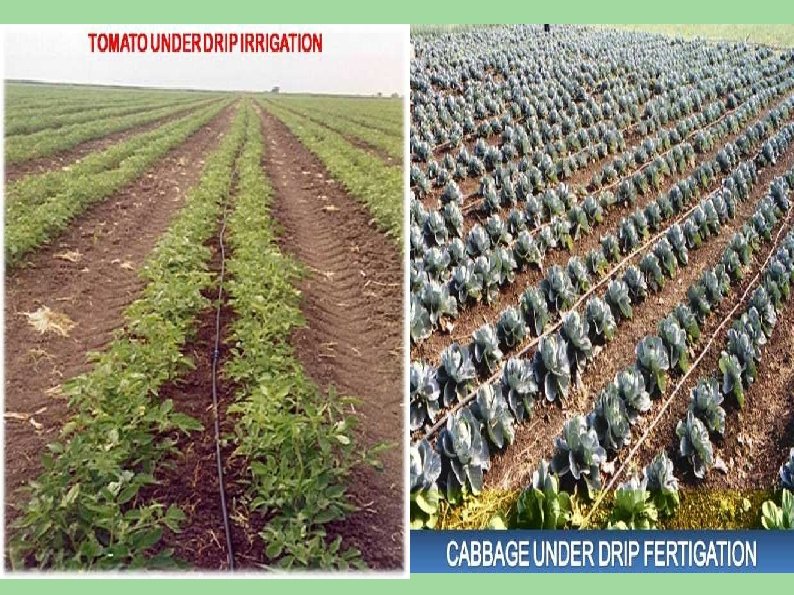
 INTEGRATED VEGETABLE PRODUCTION TECHNIQUES
 RAISING OF CUCURBITS ON SEMIPERMANENT PANDALS Name of the farmer: J. L. Lakshmipathi Village : Sogadapalli, Mandal : Shantipuram Dist: Chittoor RAISING VEGETABLE SEEDLINGS UNDER SHADENET HOUSES Name of the farmer: G. Ramana Reddy Village : Papireddypalli, Mandal : Baireddypalli Dist: Chittoor
 ØAndhra Pradesh stands first in production and productivity") OILPALM DEVELOPMENT PROGRAMME ( ISOPOM ) ØAndhra Pradesh stands first in production and productivity in oil palm in the country ØOil palm development programme mainly aims to increase the productivity of the oil palm. ØIt is planned to cover an area of 1, 00, 375 Ha. In 279 potential mandals during the 11 th five year plan ØAs against an identified potential area of 4, 20, 000 Ha. in 10 districts, an area of 94, 377 Ha. has been covered sinception ØAdditional area brought under Oilpalm from 2006 -07 to 2008 -09 -41, 006 Ha. Year Area in Ha. 2006 -07 11, 883 2007 -08 12, 074 2008 -09 17, 049
OILPALM DEVELOPMENT PROGRAMME ( ISOPOM ) ØAndhra Pradesh stands first in production and productivity in oil palm in the country ØOil palm development programme mainly aims to increase the productivity of the oil palm. ØIt is planned to cover an area of 1, 00, 375 Ha. In 279 potential mandals during the 11 th five year plan ØAs against an identified potential area of 4, 20, 000 Ha. in 10 districts, an area of 94, 377 Ha. has been covered sinception ØAdditional area brought under Oilpalm from 2006 -07 to 2008 -09 -41, 006 Ha. Year Area in Ha. 2006 -07 11, 883 2007 -08 12, 074 2008 -09 17, 049
 A. P. MICRO IRRIGATION – ACHIEVEMENTS SINCEPTION S. Period No 1 2 3 4 Nov. , 03 to March, 0 4 April, 04 to March, 0 5 April, 05 to March’ 0 6 April, 06 to March’ 0 7 April, 07 Physi cal Area in ha. , Rs. In Crores Drip Sprinkler Total Financial Physic Total Subsid cal al Cost y Cost idy Cost y 3780 11. 34 5. 67 20770 20. 80 10. 40 24905 99. 60 24550 32. 14 16. 07 49. 80 40020 50. 00 25. 00 64925 149. 60 74. 80 51811 207. 00 103. 50 25000 31. 30 15. 60 76811 238. 30 119. 10 66258 288. 90 182. 90 23750 38. 80 21. 00 90008 327. 70 203. 90
 during 2005 -06, 2006 -07, 2007") Achievements under A. P. Micro Irrigation Project (CSS) during 2005 -06, 2006 -07, 2007 -08 & 2008 -09 Area in ha. , Rs. In Crores Drip Perio d 200506 200607 200708 200809 Physical Sprinkler Financial Physical Total Financial Physical Financial Achie Achie Targe Targe veme veme t t t nt nt nt 45521 6775 61. 29 9. 33 6181460873 8480084846 10200 87381 0 29413 23987 Total 5 5 143. 2 6 159. 6 4 131. 1 4 495. 3 3 45521 6775 61. 29 9. 33 97. 423750 17. 10 14. 258556484623 128. 5 11480 11484 30000 18. 00 17. 03 6 0 6 133. 8 13950 12358 3750036200 22. 72 20. 20 9 0 1 369. 1 38538 32982 9125089950 57. 82 51. 48 8 5 5 160. 3 6 177. 6 4 153. 8 6 553. 1 5 111. 6 5 145. 5 9 154. 0 8 420. 6 6
Achievements under A. P. Micro Irrigation Project (CSS) during 2005 -06, 2006 -07, 2007 -08 & 2008 -09 Area in ha. , Rs. In Crores Drip Perio d 200506 200607 200708 200809 Physical Sprinkler Financial Physical Total Financial Physical Financial Achie Achie Targe Targe veme veme t t t nt nt nt 45521 6775 61. 29 9. 33 6181460873 8480084846 10200 87381 0 29413 23987 Total 5 5 143. 2 6 159. 6 4 131. 1 4 495. 3 3 45521 6775 61. 29 9. 33 97. 423750 17. 10 14. 258556484623 128. 5 11480 11484 30000 18. 00 17. 03 6 0 6 133. 8 13950 12358 3750036200 22. 72 20. 20 9 0 1 369. 1 38538 32982 9125089950 57. 82 51. 48 8 5 5 160. 3 6 177. 6 4 153. 8 6 553. 1 5 111. 6 5 145. 5 9 154. 0 8 420. 6 6
 STATUS SURVEY & IMPACT ANALYSIS BY A. P. PRODUCTIVITY COUNCIL Survey period(Nov’ 2003 to Mar’ 2007) Area Surveyed - 2. 56 lakh ha No. of farmers - 1. 64 lakh Nos. Status of survey - 96% of the MI systems existing and performing - 3% of the systems existing and non-performing - 1% of the systems non –existing All 3% Non-performing converted as performing by providing proper training and service Survey period (2007 -08) Area Surveyed - 1. 20 lakh ha & Analysis under progress
 Results of Impact Analysis Survey on A. P. M. I. P. 1. 1. 57 lakh farmers (96%) informed -saving of water with 2550% 2. 1. 54 lakh farmers (94%) opined- achieved increased yield with 25 -50% in case of Drip and 50% in case of sprinkler. 3. 1. 31 lakh farmers (80%) indicated -savings in labour cost by more than Rs. 2000/- per acre per annum 4. 1. 48 lakh farmers (90%) claimed - increased of income from. Rs. 10, 000/- to 25, 000/- per acre per annum. 5. 100% additional yield in case of Sugar cane 6. 1. 31 lakh farmers felt - incidence of pests reduced
 Productivity increased, Water & Electricity saved by adopting Micro Irrigation Crop Increase in Yield, % 1 3 Water saved in Energy saved, hactare. metres Lakh units 4 5 Sugarcane 40 -60 16333 189. 51 Banana 32 -50 17010 197. 29 Citrus 35 -45 68986 800. 25 Papaya 35 -45 8013 92. 94 Sapota 20 -30 4609 53. 46 Promegranate 15 -25 2703 31. 36 Mango 50 -70 34388 398. 93 Coconut 15 -25 1677 19. 46 Grapes 20 -30 1204 13. 97 Vegetables 20 -40 9435 109. 46 Oil palm 20 -40 12335 143. 07 Other (Drip) crops 20 -40 26610 308. 70 Sprinkler crops 20 -30 34886 404. 68 238189 2763. 08 Total
 Vision and Strategy Road Map for 3 Years GSDP Contribution Increase the contribution of Horticulture sector from 5. 77 to 6. 0 Strategies v Sustained effort to increase production and productivity of marketable Horticultural produce v Additional area of 2. 50 lakh Ha. proposed to be brought under Horticulture v High density plantation in all crops with intensive package of practices. v Supply of quality plant material v Vertical enhancement in production & productivity through Micro Irrigation. v Rejuvenation of Old & Senile Orchards to improve production & productivity.
 Maximum productivity per Ha. (MTs) Target productivity per") Crop Present productivity per Ha. (MTs) Maximum productivity per Ha. (MTs) Target productivity per Ha. (MTs) Mango 8. 6 12. 20 (Uttar Pradesh) 9. 00 Cashew 0. 68 1. 26 (Maharastra) 0. 75 Pomegranate 10. 00 11. 40 (Karnatka) 10. 80 Banana 35. 00 62. 00 (Maharastra) 40. 00 Vegetables 16. 80 30. 40 (Tamilnadu) 20. 00
Crop Present productivity per Ha. (MTs) Maximum productivity per Ha. (MTs) Target productivity per Ha. (MTs) Mango 8. 6 12. 20 (Uttar Pradesh) 9. 00 Cashew 0. 68 1. 26 (Maharastra) 0. 75 Pomegranate 10. 00 11. 40 (Karnatka) 10. 80 Banana 35. 00 62. 00 (Maharastra) 40. 00 Vegetables 16. 80 30. 40 (Tamilnadu) 20. 00
 Self Sufficiency Self sufficiency in vegetable production @ 15% increase in area and production. Strategies Ø Increase in production & productivity through supply of hybrid vegetable seed. Ø Promoting cultivation of high value vegetables under shade houses & poly houses. Ø Encouraging cultivation of Cucurbits on pendals to reduce losses. Ø Raising of seedlings under shade houses to reduce seed cost Ø Tomato cultivation with trellis to improve quality of produce.
 Post Harvest Reduce Post Harvest losses from the present 30 -35% to 25% Strategies Ø Promotion of establishment of Post Harvest infrastructure Ø HRD of the growers & field staff Ø Tie-up between production clusters & Private players Export Revenues Enhance export revenues from Rs. 816 crores during 2008 -09 to Rs. 1000 crores by 2012. Strategies Ø Focus Produce – Mango Pulp, Spices (Chillies & Turmeric) Pomegranate, Banana and Cashew. Ø Value addition of horticulture produce through integrated radiation processing facility and aseptic packing unit.
 Self Sustaining Production To meet the challenges of sustainability & competitiveness Strategies Ø Organic cultivation of high value horticulture crops in an area of 36, 000 Ha. Ø Awareness on cultural & Mechanical method of pest control and optimum utilization of inorganic inputs. Oilpalm Development To attain self sufficiency in palm oil production Strategies Ø To cover an area of 71, 250 Ha. in the next 3 years. Ø Promote research to evolve high yielding dwarf varieties
 Technology Transfer Effective transfer of technology through knowledge base farmer centric strategies Strategies Ø Imparting trainings to 1. 50 lakh farmers on the latest developments in horticulture. Ø Exposure Visits and interaction with progressive farmers of other States. Ø Awareness through mass media. Ø Dissemination of Technology through CDs & films on GMP in focus crops. Ø Effective utilization of extension system for addressing the farmers concerns.
 Market Linkages Initiatives for the linkages between production clusters & private sector Strategies q Encouraging formation of Growers Co-operatives / SHG for Focus Crops Mango, Sweet Orange, Banana. q Market exposure given to the Co-operatives. q Interaction between bulk Traders & Growers in Production clusters q Adoption of Organic Farming – tie-up with exporters q Opening of Organic Outlets in Rythu Bazar for marketing of Organic Vegetables. q Direct Marketing facility for the Tribal’s to sell their Horticulture produce to consumers.
 PROJECTED AREA UNDER HORTICULTURE BY 2012 –") 3 Years - Road Map (2009 -2012) PROJECTED AREA UNDER HORTICULTURE BY 2012 – THROUGH CONVERGENCE APPROACH - RKVY, NHM, NREGS, WATERSHED & CLDP SL. No. COMPONENT PRESENT AREA 200809 (Ha. ) (Estimated) PROJECTED AREA (Ha. ) PROPOSED ADDITIONAL AREA (Ha. ) % OF INCREASE 1 FRESH FRUITS 935913 1059956 114043 12. 19 2 PLANTATION CROPS 385599 408258 22659 5. 88 3 VEGETABLES & TUBER CROPS 324522 373252 48730 15. 02 4 SPICES 303244 366190 62946 20. 76 5 FLOWERS 19807 21338 1531 7. 73
3 Years - Road Map (2009 -2012) PROJECTED AREA UNDER HORTICULTURE BY 2012 – THROUGH CONVERGENCE APPROACH - RKVY, NHM, NREGS, WATERSHED & CLDP SL. No. COMPONENT PRESENT AREA 200809 (Ha. ) (Estimated) PROJECTED AREA (Ha. ) PROPOSED ADDITIONAL AREA (Ha. ) % OF INCREASE 1 FRESH FRUITS 935913 1059956 114043 12. 19 2 PLANTATION CROPS 385599 408258 22659 5. 88 3 VEGETABLES & TUBER CROPS 324522 373252 48730 15. 02 4 SPICES 303244 366190 62946 20. 76 5 FLOWERS 19807 21338 1531 7. 73
 Contd. . . Projected") 3 Years - Road Map (2009 -2012) Contd. . . Projected
3 Years - Road Map (2009 -2012) Contd. . . Projected
") 3 Years - Road Map (2009 -2012)
3 Years - Road Map (2009 -2012)
 STATE HORTICULTURE MISSION COMPONENT WISE ACTION PLAN – 2009 -10 SNO. 1 COMPONENTS MAJOR PHYSICAL TARGET PROPOSED Model Nurseries - Public PLANTATION INFRASTRUCTURE AND DEVELOPMENT (Nos. ) Small Nurseries (Private) Mango Sweet Orange 3 8. 00 61. 50 18, 325. 00 1, 935. 60 - 30, 633. 39 1, 950. 19 - 43, 253. 71 1, 764. 51 8, 600. 00 984. 10 301. 35 402. 75 3, 138. 00 311. 49 5 6, 000. 00 4, 275. 00 3 4 5 6 ESTABLISHMENT OF NEW GARDENS/ AREA EXPANSION (Ha. ) Banana 1105. 00 Papaya 2 1170. 00 MAINTENANCE OF THE GARDEN - III Year (Ha. ) MAINTENANCE OF THE GARDEN - II Year (Ha. ) Mango REJUVENATION (Ha. ) Citrus Cashew Green Houses PROTECTED CULTIVATION (Ha. ) Mulching Shade Nets Chillies/ Ginger 4, 000. 00 2, 000. 00 10. 4 220. 5 70. 45 3, 132. 00 Bio control lab (public) 7 TARGET PHYSICAL FINANCIAL (Rs. in Lakhs) (Ha. / Nos. ) IPM/ INM 2. 00 Bio control lab (private) 2. 00 Plant health clinic (private) 2. 00
 FINANCIAL (Rs.") SNO. COMPONENTS MAJOR PHYSICAL TARGET PROPOSED TARGET PHYSICAL (Ha. / Nos. ) FINANCIAL (Rs. In Lakhs) 11 12 CREATION OF WATER RESOURCES (No. ) POST HARVEST MANAGEMENT (No. ) DEVELOPMENT OF MARKET YARDS 1, 000. 00 4, 000. 00 Training of Farmers 44000 46, 536. 00 380. 60 2195 - - 500. 00 100. 00 48 10 22 Refer Van 10 HUMAN RESOURCE DEVELOPMENT (No. ) 9, 000. 00 Pack Houses Cold Storage Ripening chambers 9 ORGANIC FARMING 1000 Exposure Visits 8 Vermi Compost Units (No. ) O. F. - Fruits 4 1, 303. 00 1, 837. 38 2. 00 1, 043. 00 Drying Platforms (Turmeric/ Cocoa/ Chillies) Perishable Cargo facilities at Rajiv Gandhi International Airport - 1195 1 -
SNO. COMPONENTS MAJOR PHYSICAL TARGET PROPOSED TARGET PHYSICAL (Ha. / Nos. ) FINANCIAL (Rs. In Lakhs) 11 12 CREATION OF WATER RESOURCES (No. ) POST HARVEST MANAGEMENT (No. ) DEVELOPMENT OF MARKET YARDS 1, 000. 00 4, 000. 00 Training of Farmers 44000 46, 536. 00 380. 60 2195 - - 500. 00 100. 00 48 10 22 Refer Van 10 HUMAN RESOURCE DEVELOPMENT (No. ) 9, 000. 00 Pack Houses Cold Storage Ripening chambers 9 ORGANIC FARMING 1000 Exposure Visits 8 Vermi Compost Units (No. ) O. F. - Fruits 4 1, 303. 00 1, 837. 38 2. 00 1, 043. 00 Drying Platforms (Turmeric/ Cocoa/ Chillies) Perishable Cargo facilities at Rajiv Gandhi International Airport - 1195 1 -
 SNO. COMPONENTS Tractor Mounted Sprayers Onion Storage Structures 521. 63 110 Poly Dryers for Chillies 195, 256. 00 194050 FINANCIAL (Rs. In Lakhs) 632 Plastic Crates PHYSICAL (Ha. / Nos. ) 218 Imported Power-Weeder and Smart Cultivators 13 TARGET MAJOR PHYSICAL TARGET PROPOSED 23 INNOVATIVE SCHEMES (No. ) 14 - - 1. 00 13. 00 15 AWARENESS PROGRAMME - - 91. 00 163. 25 16 FRONTLINE DEMONSTRATION - PUBLIC MISSION MANAGEMENT - - Grand Total 763. 58 13, 232. 57
 PROPOSED ACTION PLAN OF SHM– 2010 -11 Sl. NO. COMPONENTS/ CROPS UNIT 2 ESTABLISHMENT OF NEW GARDENS/ AREA EXPANSION Model Nurseries - (Public) 3 NO. Small Nurseries - (Private) 5 Ha. 1 PLANTATION INFRASTRUCTURE AND DEVELOPMENT FINANCIAL TARGET (Rs. In Lakh) PHYSICAL TARGET MAJOR PHYSICAL TARGET PROPOSED Mango Ha. Sweet Orange NO. 8 61. 5 45812. 5 4838. 99 15000 10687. 5 Ha. Banana 2762. 5 Ha. Papaya 2925 3 MAINTENANCE OF THE GARDEN – III YEAR Ha. - - 33588. 56 1838. 52 4 MAINTENANCE OF THE GARDEN – II YEAR Ha. - - 17040 682. 27
 Sl. NO. COMPONENTS/ CROPS UNIT MAJOR PHYSICAL TARGET PROPOSED Ha. REJUVENATION Ha. Citrus 3000 Cashew 3000 Green Houses FINANCIAL TARGET (Rs. In Lakh) 6000 Ha. 5 Mango PHYSICAL TARGET 15. 6 12900 1476. 15 452. 025 604. 13 6270 342. 81 Shade Nets 105. 675 Chillies/ Ginger 6264 BIO CONTROL LAB (PUBLIC) 2. 00 NO. BIO CONTROL LAB (PRIVATE) 2. 00 NO. IPM/ INM 330. 75 NO. 7 Mulching Ha. PROTECTED CULTIVATION Ha. 6 PLANT HEALTH CLINIC (PRIVATE) 2. 00 Fruits 8000 18000 2000. 00 8 ORGANIC FARMING Ha. 9 HUMAN RESOURCE DEVELOPMENT NO. - - 79499 441. 20 CREATION OF WATER RESOURCES NO. - - 700 900. 00 10
 Sl. NO. COMPONENTS/ CROPS PHYSICAL TARGET MAJOR PHYSICAL TARGET PROPOSED UNIT NO. DEVELOPMENT OF MARKET YARDS 11. 00 NO. Refers vans/ Containers Ripening chambers NO. 12 Cold Storage NO. POST HARVEST MANAGEMENT 53. 00 NO. 11 Pack Houses Turmeric/ Chillies drying platforms FINANCIAL TARGET (Rs. In Lakh) 5. 00 989. 31 2 1430. 00 1, 200. 00 - NO. 1433. 3 - NO. 327. 00 292884 782. 45 NO. Power Weeder Cum Smart Cultivator 1, 092. 00 327 64. 53 NO. Onion Storage Structure 165. 00 285 38. 53 NO. 13 Tractor mounted sprayers ANGRAU Poly Dryer for Chillies 35. 00 156 32. 45 INNOVATIVE SCHEMES 14 FRONTLINE DEMONSTRATION - PUBLIC NO. - - 1 13. 00 15 AWARENESS PROGRAMME NO. - - 105. 00 201. 25 16 MISSION MANAGEMENT - - - 1016. 00 18833. 60 Grand Total
 PROPOSED ACTION PLAN UNDER RKVY S. No Name of the scheme Unit SUB SIDY 2009 -10 2010 -11 2011 -12 PHY FIN 1 Infrastructure Development (Production of Plant material in Nurseries of Govt & Pvt Sectors Nos 31. 50 81. 00 18. 00 96. 00 17. 00 75. 00 2 Production Improvement in Various Horticulture Crops Ha 2. 72 5, 004. 50 439. 44 5, 365. 00 500. 40 5, 365. 00 763. 50 3 Maintenance of Area expansion Of 2 nd year Ha 0. 27 3, 365. 00 112. 11 4, 000. 00 133. 04 4 Maintenance of Area expansion Of 3 rd Year Ha 0. 24 2, 800. 00 133. 98 5 Rejuvenation Ha 0. 18 5, 000. 00 480. 78 5, 000. 00 443. 50 4, 000. 00 354. 80 6 Integrated Vegetable Production Techniques Ha. /No. 8. 63 271, 840. 00 3, 137. 49 296, 620. 00 3, 285. 00 296, 420. 00 3, 165. 00
 Contd… S. No Name of the scheme Unit 2009 -10 SUB SIDY 2010 -11 2011 -12 PHY FIN 50. 0 0 367. 57 119. 0 0 454. 49 119. 0 0 454. 4 9 a. Post Harvest Structures Nos 113. 6 6 b. Farm Mechanization (50% of unit cost max of Rs. 40000 ) 7 Nos 0. 40 3, 165. 0 0 Ha/No 5. 90 1, 886. 0 0 370. 60 3, 800. 0 0 650. 0 0 Ha 0. 03 7, 150. 0 0 71. 10, 500. 0 50 0 105. 00 10, 500. 0 0 105. 0 0 4. 45 275. 90 625. 0 0 104. 50 3. 0 0 60. 00 10 3. 00 0. 00 3. 0 - 0 68. 50 8 Organic Farming 9 IPM / INM 10 Human Resource Development 115. 00 1, 266. 00 525. 0 0 8. Awareness programmes Nos 9. Construction of Additional infrastructure at APHTI 11 Special Projects 873. 7 3 12 Development of Horticulture in hilly and tribal areas of Seethampeta, Rampachodavaram special reference to vegetables with convergence of NREGS Nos 100. 0 0 108. 20 13 Extension needs 90. 0 0 90. 00 Grand Total 1, 346. 70 3. 0 2, 200. 0 00 294, 637. 50 9, 016. 98 5, 000. 0 0 2, 000. 00 5, 000. 0 0 625. 0 0 2, 000. 0 0 104. 5 0 - - 3. 0 0 886. 00 3. 0 873. 7 0 3 2. 0 0 200. 00 2. 0 200. 0 0 0 330, 420. 00 9, 026. 99 332, 651. 00 90. 0 0 9, 103. 04
") OIL PALM DEVELOPMENT PROGRAMME (ISOPOM)
OIL PALM DEVELOPMENT PROGRAMME (ISOPOM)
 Action Plan under Micro-Irrigation for the balance period of 11 th - five year plan Area in ha. , Rs. In Crores Sl. Plan period Target No. Drip 1 2 3 4 Area Sprinkl Total er 5 6 Unit cost Subsi Sprinkl dy Drip Total er 7 8 9 10 1 2009 -10 15000 112500 (Projected) 0 37500 15000 506. 25 0 56. 25 562. 50 393. 75 2 2010 -11 15000 112500 (Projected) 0 37500 15000 506. 25 0 56. 25 562. 50 393. 75 3 2011 -12 15000 112500 (Projected) 0 37500 15000 506. 25 0 56. 25 562. 50 393. 75 TOTAL 45000 337500 112500 1518. 8 168. 75 1688 1181. 3 0 0
 Thank You