06d709ec3ddf018a965cc9517b8b1ba0.ppt
- Количество слайдов: 31


Discrete models
")
Types of discrete models Binary models Logit and Probit Binary models with correlation (multivariate) Multinomial non ordered Ordered models (rankings) Count models (patents)
")
We focus on binary models Refer to Greene chapter (also uploaded in the site) and Montini document on fit measures. Microeconometrics Consumer choices (but not only) Random utility framework (linked to Hicksian theory). . You observe what people choose, they choose what the like the best


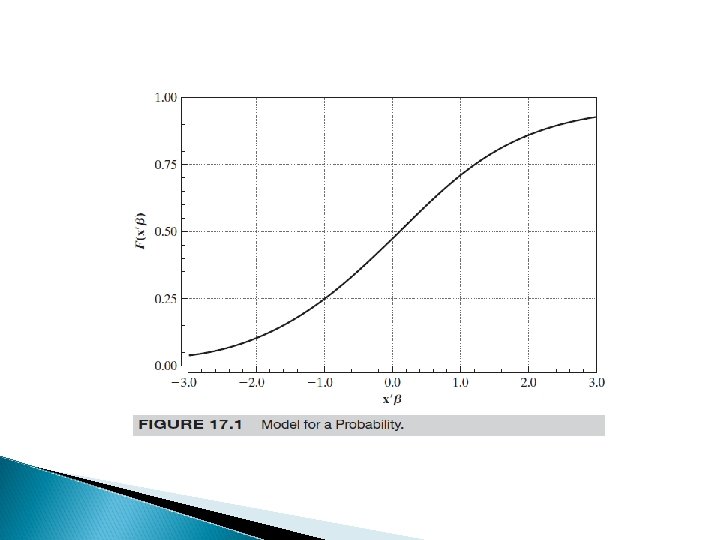
Cdf= cumulative density function


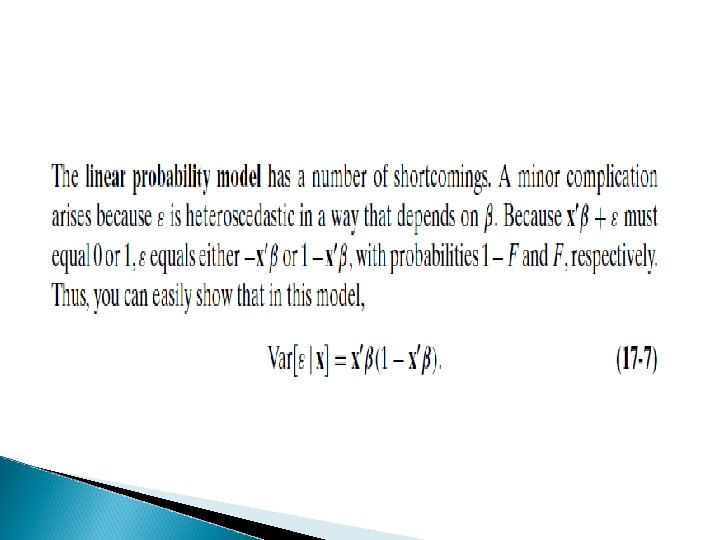
Mean and variance for Bernoulli random var In deciding on the estimation technique, it is useful to derive the conditional mean and variance E(y/x)= B 0 + B 1 x 1 + B 2 x 2 +……Bkxk Var (y/x)= XB(1 - XB), where XB is B 0 + B 1 x 1 + B 2 x 2 +……Bkxk. OLS produces consistent and even unbiased estimates, BUT… Heteroskedasticity is always an issue to be dealt by weighted least squares (het in stata)

HET Always recall that HET affects s. e. not size of coefficients. . Correction should improve T ratios since it lower variances
= B 0 + B 1 x 1")
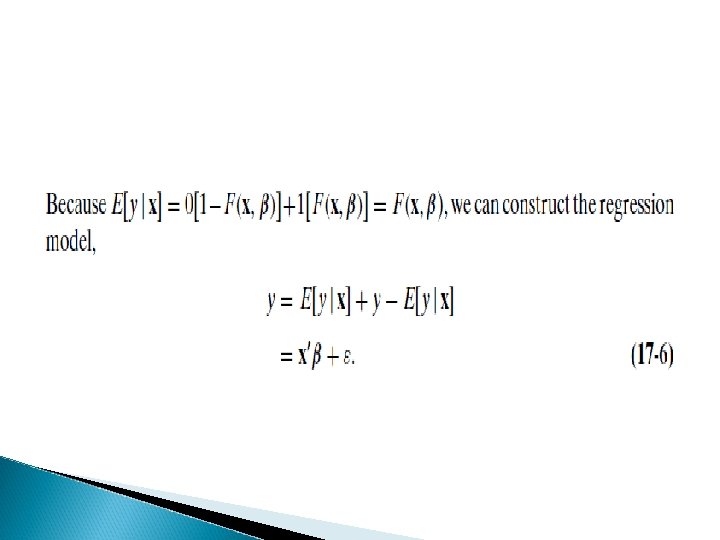
Linear probability model for binary models P(y=1/X)= B 0 + B 1 x 1 + B 2 x 2 +……Bkxk B 1= d. P(y=1)/dx 1, assuming x 1 is not related functionally to other covariates, B 1 is the change in the probability of success given a one unit increase in x 1. holding other Xj fixed Unless x is restricted, the LPM cannot be a good description of the population response probability There are values of Bx for which P is outside the unit 0 -1 interval

LPM then not usable So what? We ve to find a model coherent with a probability framework Here LOGIT and PROBIT enters

Used in MNL contexts


The sign is given by the sign of B See Mancinelli, Mazzanti, Ponti and Rizza (2010), J of socio economics, also WP DEIT Non siamo in un contesto dove possiamo rappresentare B come elasticità, questo è vero anche in modelli lin-log, dove ad esempio la var dipendente (causa ‘ 0’ diffusi) non può essere rappresentata in log.

Elasticity Linear model Dy/dx = b; e=b*x/y Log log Dlny/dlnx= b*y/x E=b Lin log Dy/dlnx = b*1/x E= b*x/y= b/y


See various examples of papers in the site, mainly on innovation variables of adoption that take values 1/0
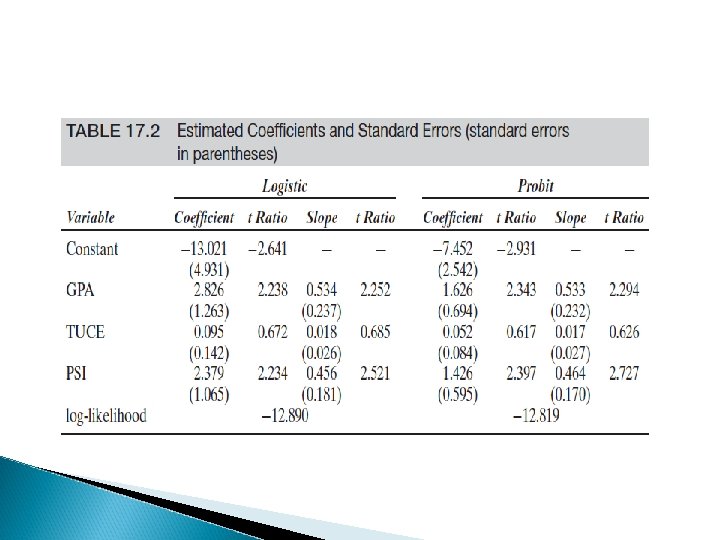

Practical issues to interpret estimates Coefficient fo not represent marginal effects ◦ You can use dprobit in STATA for that R 2 is not a measure of fit, we have pseudo R 2, es. Mc. Fadden R 2 (see Montini document on that) You should have good F test, reasonable R 2 (0. 2 excellent, but 0. 05 fine as well), a set of *** coefficients.

Goodness of fit See Montini chapter

Two stage Heckman Es. R&D, labor hours offered First stage probit, then OLS Get the inverse Mills ratio from first to inform the second and see whether the bias is there Heckman vs Tobit models (different assumptions)

2 stage Heckman or heckit model: sample selection Y 1= X 1 B 1 + u 1 Y 2= 1(x 2 + v 2 >0) Hp: x, y 2 always observed, y 1 only if y 2=1, set to 0 if y 2=0 E(y 1/X, y 2=1) = x 1 B 1 + (x 2) OLS can produce biased inconsistent estimates of B 1 if we do not account for the last term OMITTED VAR problem

We need an estimator of 2! Obtain the probit estimates of 2 from first stage P(y 2=1/x) = (x 2) using all N units Then estimate Inverse Mills ratio, = f(x 2) Insert IMR in the OLS second equation and get B and estimates These estimators are consistent

X 1 covariates of OLS, X of probit ** we dont need x 1 to be a subset of X for identification. But X=X 1 can introduce collinearity since can be approximated by a linear function of X Example in Wooldridge, Econometric analysis of cross section and panel data, p. 565 (wage equation for married women) Estimates become imprecise when X=x 1
06d709ec3ddf018a965cc9517b8b1ba0.ppt