

724aa07142424eec6685617b59a5b106.ppt
- Количество слайдов: 65
 Disclaimer: The views expressed in this document are those of the author, and do not necessarily reflect the views and policies of the Asian Development Bank (ADB), its Board of Directors, or the governments they represent. ADB does not guarantee the accuracy of the data included in this document, and accept no responsibility for any consequence of their use. By making any designation or reference to a particular territory or geographical area, or by using the term “country” in this document, ADB does not intend to make any judgments as to the legal or other status of any territory or area. Non-performing loans, Aging population and Infrastructure Investment Naoyuki Yoshino Dean Asian Development Bank Institute (ADBI) Professor Emeritus, Keio University nyoshino@adbi. org
 Nonperforming Loans, Japan
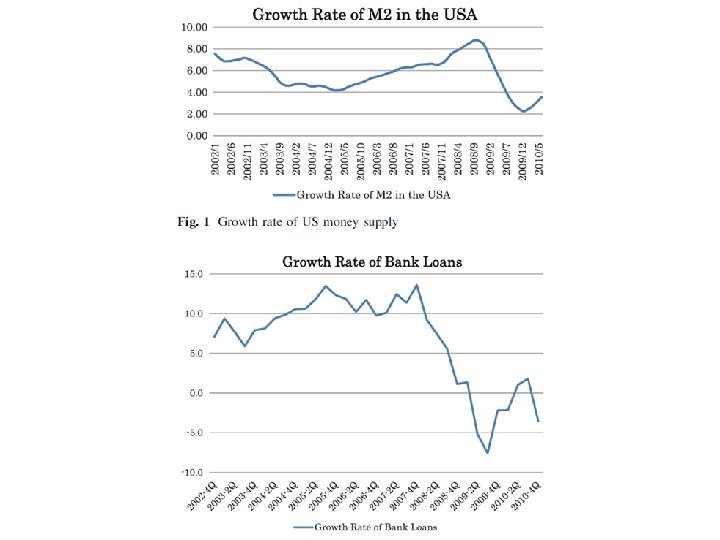
 Non-performing Loans in US 3
 Why does Bubble Occur in Many Countries ? 1, Easy Monetary Policy Excess Liquidity 2, Share Price starts to rise 3, Wealth effect higher consumption expansion of sales 4, Improvement of Business Condition 5, Increases in Investment 6, Consumption, Investment Higher growth 7, Everybody seems happy 8, Difficult for the central bank to stop
 Bank Regulation and Supervision 1, Good performance of Banking sector Bank supervision becomes weaker 2, Expected default loan ratio 3, Post Crisis policy Capital Injection and Rescue Plans Deposit Insurance (Dual system) Transactions’ account (Full guarantee) 4, Announce the safety of Financial System 5, Bridge bank to succeed 6
 the ratio of banks’ real") Bubble Indicators Bank based financial Market of Asia (i) the ratio of banks’ real estate-related loans to the loans of banks overall, In Japan, this ratio rose from 16% to 32. 6%, Lr > Ltotal (ii) Comparison of the pace of growth in banks’ real estate lending with the real economic growth rate, ΔLr/Lr > ΔY/Y (iii) The rise in the housing prices compared with the average income of workers Ph > αY
Bubble Indicators Bank based financial Market of Asia (i) the ratio of banks’ real estate-related loans to the loans of banks overall, In Japan, this ratio rose from 16% to 32. 6%, Lr > Ltotal (ii) Comparison of the pace of growth in banks’ real estate lending with the real economic growth rate, ΔLr/Lr > ΔY/Y (iii) The rise in the housing prices compared with the average income of workers Ph > αY
 8
8
 Bank Loans/GDP Ratio Japan and USA 9
/(GDP) ratio") (China’s Bank Loan)/(GDP) ratio
(China’s Bank Loan)/(GDP) ratio
 11
11
 PRC: House Price / Income ratio
 13
13
") Table 2 Loan Supply Function for Major Commercial Banks in the PRC (2007 -2014) Lending Rate – Shibor Rate Deposits Competitors’ Total Loan Housing Price Index Market Share BIS Ratio Constant Adjusted R-squared D-W Statistics Number of Observations Model of Loan 6. 235*** (13. 75) 2. 671*** (3. 68) 0. 357*** (20. 93) -0. 671*** (-71. 17) 0. 166*** (58. 87) -0. 655*** (-8. 02) 3. 365* (1. 70) -15. 746*** (-53. 92) 0. 897 1. 88 364
Table 2 Loan Supply Function for Major Commercial Banks in the PRC (2007 -2014) Lending Rate – Shibor Rate Deposits Competitors’ Total Loan Housing Price Index Market Share BIS Ratio Constant Adjusted R-squared D-W Statistics Number of Observations Model of Loan 6. 235*** (13. 75) 2. 671*** (3. 68) 0. 357*** (20. 93) -0. 671*** (-71. 17) 0. 166*** (58. 87) -0. 655*** (-8. 02) 3. 365* (1. 70) -15. 746*** (-53. 92) 0. 897 1. 88 364
 Bank’s Balance Sheet and Basel Capital Requirement Assets Liabilities Bank Loans Good Assets Deposits Non Performing Loans (NPL) Capital=A(q 2) Bad Assets 15
 Aging Population of Japan and Negative Interest Rate Policy Naoyuki Yoshino Dean Asian Development Bank Institute Professor Emeritus, Keio University, Japan Chair Person, JGB Investors Meeting, MOF Senior Advisor, Financial Research Institute, FSA
 14, 000 70.") Population Aging of Japan Current Figures 10 of Thousands Forecast (2012) 14, 000 70. 0 12, 000 60. 0 10, 000 50. 0 8, 000 40. 0 6, 000 30. 0 4, 000 20. 0 2, 000 10. 0 1950 1960 1970 1980 1990 2000 2010 2020 2030 2040 2050 2060 0 FY Peak of the Population 2004, 127. 8 million Total Fertality Rate (TFR) Working Populati on Ratio (15 -64) Aged Populati on Ratio Source:Ministry of Internal Affairs and Communication 17
Population Aging of Japan Current Figures 10 of Thousands Forecast (2012) 14, 000 70. 0 12, 000 60. 0 10, 000 50. 0 8, 000 40. 0 6, 000 30. 0 4, 000 20. 0 2, 000 10. 0 1950 1960 1970 1980 1990 2000 2010 2020 2030 2040 2050 2060 0 FY Peak of the Population 2004, 127. 8 million Total Fertality Rate (TFR) Working Populati on Ratio (15 -64) Aged Populati on Ratio Source:Ministry of Internal Affairs and Communication 17
 General Account Budget -Breakdown of Expenditure National Debt Service 23, 270. 2 24. 3% Interest Payments 10, 131. 9 10. 6% Redemption of the National Debt 13, 138. 3 13. 7% Others 9, 656. 8 10. 1% Food Supply 1, 050. 7 (1. 1) Promotion of SMEs 185. 3 964. 2 444. 3 509. 8 6, 152. 6 350. 0 National Defense 4, 884. 8 Public Works 5. 1% 5, 968. 5 Education & 6. 2% Science 5, 442. 1 5. 7% Social Security 30, 517. 5 31. 8% General Primary Expenses Account 72, 612. 1 75. 7% Total Expenditure s 95, 882. 3 (100. 0%) Local Allocation Tax Grants, etc. 161, 424 16. 8% (0. 2) Energy Former Military Personal Pensions Economic Assistance Miscellaneous Contingency Reserves (1. 0) (0. 5) (6. 4) (0. 4) (Note 1)Figures may not add up to the totals due to rounding. (Note 2)The ratio of Social Security expenses to General Expenditures* : 54. 0% *General Expenditures equals to the Primary Expenditure minus Local Allocation Tax Grants, etc.
 Main results Population aging reduces aggregate output, consumption, and investment by reducing total labor supply in the long-run Population aging weakens the effectiveness of fiscal and monetary policies to boost an economy Implication: necessary policy to cope with population aging is to keep the elderly people working and productivity base wage rather than seniority wage system. Reform the seniority-based wage system
 1. Infrastructure investors are difficult to obtain adequate rate of return despite") Outlines (Infrastructure) 1. Infrastructure investors are difficult to obtain adequate rate of return despite its risks. Therefore, the bankable infrastructure projects were scarce in Asian region. 2. This paper proposes the increment of tax revenues along the highway or railway which are derived from the spillover effects of infrastructure should contribute certain fraction of tax revenues (say 20% or 30%) to investors in infrastructure. 3. Furthermore, tax revenues accrued from spillover effects were paid every year to next neighbor countries where the highway or the railway will run through, the cross border infrastructure will become easier to construct. 4. The paper addresses the importance of financing local companies including SMEs so that they can utilize the benefits of infrastructure. 21
Outlines (Infrastructure) 1. Infrastructure investors are difficult to obtain adequate rate of return despite its risks. Therefore, the bankable infrastructure projects were scarce in Asian region. 2. This paper proposes the increment of tax revenues along the highway or railway which are derived from the spillover effects of infrastructure should contribute certain fraction of tax revenues (say 20% or 30%) to investors in infrastructure. 3. Furthermore, tax revenues accrued from spillover effects were paid every year to next neighbor countries where the highway or the railway will run through, the cross border infrastructure will become easier to construct. 4. The paper addresses the importance of financing local companies including SMEs so that they can utilize the benefits of infrastructure. 21
 Output Direct") Direct Effect and Spill-over Effects Production Function Y=F( Kp, L, Kg ) Output Direct Effect Y= Output, Kp= private capital, L = 22
Direct Effect and Spill-over Effects Production Function Y=F( Kp, L, Kg ) Output Direct Effect Y= Output, Kp= private capital, L = 22
 Non-affected region Highway Spillover effect Employment Non-affected region Private investment SME development Spillover effect 23
 Spillover effects Return to investors 1956 -60 1961 -65 1966 -70 1971 -75 1976 -80 1981 -85 Direct Effect (Kg) 0. 696 0. 737 0. 638 0. 508 0. 359 0. 275 Indirect Effect (Kp) 0. 453 0. 553 0. 488 0. 418 0. 304 0. 226 Indirect Effect (L) 1. 071 0. 907 0. 740 0. 580 0. 407 0. 317 0. 3048 0. 292 0. 2456 0. 1996 0. 1422 0. 1086 43. 8 39. 6 38. 5 39. 3 39. 6 39. 5 20%Returned %Increment 1986 -90 1991 -95 1996 -00 2001 -05 2006 -10 0. 215 0. 193 0. 0776 36. 1 0. 181 0. 162 0. 155 0. 0634 35. 0 24 0. 135 0. 122 0. 105 0. 0454 33. 6 0. 114 0. 1 0. 09 0. 038 0. 108 0. 1 0. 085 0. 037 33. 3 34. 3
 , Philippines Micro-data • The Southern Tagalog") Case Study: Southern Tagalog Arterial Road (STAR) , Philippines Micro-data • The Southern Tagalog Arterial Road (STAR) project in Batangas province, Philippines (south of Metro Manila) is a modified Built-Operate. Transfer (BOT) project. • The 41. 9 km STAR tollway was built to improve road linkage between Metro Manila and Batangas City, provide easy access to the Batangas International Port, and thereby accelerate industrial 25
Case Study: Southern Tagalog Arterial Road (STAR) , Philippines Micro-data • The Southern Tagalog Arterial Road (STAR) project in Batangas province, Philippines (south of Metro Manila) is a modified Built-Operate. Transfer (BOT) project. • The 41. 9 km STAR tollway was built to improve road linkage between Metro Manila and Batangas City, provide easy access to the Batangas International Port, and thereby accelerate industrial 25
, Philippines, Manila Tax Revenues in three cities") The Southern Tagalog Arterial Road (STAR Highway), Philippines, Manila Tax Revenues in three cities Yoshino and Pontines (2015) ADBI Discussion paper 549 Completio n 26
The Southern Tagalog Arterial Road (STAR Highway), Philippines, Manila Tax Revenues in three cities Yoshino and Pontines (2015) ADBI Discussion paper 549 Completio n 26
 27
27
 Cross-border Infrastructure Investment Role of Multilateral Institution Large Country A City Country B Spillover effect, Promote SMEs Spillover effect Increase in Tax revenues 28
 GDP growth rate Railway Uzbekistan Railway Time Divide regions affected and not affected by railway connection to “Treated group” and “Control group” Naoyuki Yoshino - Umid Abidhadjaev. “Impact evaluation of infrastructure provision: case studies from Japan and Uzbekistan”. December 14 -15, 2015. Islamabad, Pakistan 29
![GDP Term Launchin g Effects Short 2. 83***[4. 48] 0. 70[0. 45] 1. 33[1.](https://present5.com/presentation/724aa07142424eec6685617b59a5b106/image-30.jpg "GDP Term Launchin g Effects Short 2. 83***[4. 48] 0. 70[0. 45] 1. 33[1.") GDP Term Launchin g Effects Short 2. 83***[4. 48] 0. 70[0. 45] 1. 33[1. 14] Mid 2. 5***[6. 88] 0. 36[0. 29] 1. 27[1. 46] Long 2. 06***[3. 04] -0. 42[-0. 29] 2. 29**[2. 94] Short 0. 19[0. 33] 0. 85[1. 75] -0. 18[-0. 20] Mid 0. 31[0. 51] 0. 64[1. 30] -0. 02[-0. 03] Long 0. 07[0. 13] -0. 006[-0. 01] 0. 50[0. 67] Postponed Effects 1. 76*[1. 95] -1. 49[-0. 72] 2. 58*[2. 03] Anticipat ed -1. 54[-1. 66] 1. 42[0. 78] -1. 32[-0. 92] 0. 32[0. 44] 0. 84[1. 42] 0. 13[0. 13] 2 years 1 year GDP Anticipat ed Short Mid Connectivity spillover effect Regional spillover Neighboring effect spillover effect Long 0. 11[0. 15] 0. 10[0. 16] 0. 87[1. 19] Note: t-values are in parenthesis. t-value measures how many standard errors the coefficient is away from zero. legend: * p<. 1; ** p<. 05; *** p<. 01 Postponed Effects -0. 14[-0. 20] -1. 71[-1. 35] 1. 05[1. 44] Naoyuki Yoshino - Umid Abidhadjaev. “Impact evaluation of infrastructure provision: case studies from Japan and Uzbekistan”. December 14 -15, 2015.
GDP Term Launchin g Effects Short 2. 83***[4. 48] 0. 70[0. 45] 1. 33[1. 14] Mid 2. 5***[6. 88] 0. 36[0. 29] 1. 27[1. 46] Long 2. 06***[3. 04] -0. 42[-0. 29] 2. 29**[2. 94] Short 0. 19[0. 33] 0. 85[1. 75] -0. 18[-0. 20] Mid 0. 31[0. 51] 0. 64[1. 30] -0. 02[-0. 03] Long 0. 07[0. 13] -0. 006[-0. 01] 0. 50[0. 67] Postponed Effects 1. 76*[1. 95] -1. 49[-0. 72] 2. 58*[2. 03] Anticipat ed -1. 54[-1. 66] 1. 42[0. 78] -1. 32[-0. 92] 0. 32[0. 44] 0. 84[1. 42] 0. 13[0. 13] 2 years 1 year GDP Anticipat ed Short Mid Connectivity spillover effect Regional spillover Neighboring effect spillover effect Long 0. 11[0. 15] 0. 10[0. 16] 0. 87[1. 19] Note: t-values are in parenthesis. t-value measures how many standard errors the coefficient is away from zero. legend: * p<. 1; ** p<. 05; *** p<. 01 Postponed Effects -0. 14[-0. 20] -1. 71[-1. 35] 1. 05[1. 44] Naoyuki Yoshino - Umid Abidhadjaev. “Impact evaluation of infrastructure provision: case studies from Japan and Uzbekistan”. December 14 -15, 2015.
") Additional tax revenue, Regional GDP growth and Railway Company Net Income, LCU (bln. ) T(20)*∆Y ∆Y Affected Coefficients (Tax (Direct + Spillover revenue) effects) Period Company net income (Revenue Costs) Short term (2009 -2010) 2. 83*** [4. 48] 16. 0 79. 9 315. 5 Mid-term (2009 -2011) 2. 48*** [6. 88] 16. 3 81. 5 411. 7 Long-term (2009 -2012) 2. 06*** [3. 04] 14. 7 73. 5 509. 0 Source: Authors’ calculations 31
Additional tax revenue, Regional GDP growth and Railway Company Net Income, LCU (bln. ) T(20)*∆Y ∆Y Affected Coefficients (Tax (Direct + Spillover revenue) effects) Period Company net income (Revenue Costs) Short term (2009 -2010) 2. 83*** [4. 48] 16. 0 79. 9 315. 5 Mid-term (2009 -2011) 2. 48*** [6. 88] 16. 3 81. 5 411. 7 Long-term (2009 -2012) 2. 06*** [3. 04] 14. 7 73. 5 509. 0 Source: Authors’ calculations 31
 Japanese Bullet Train 32
 Impact of Kyushu Shinkansen Rail on CORPORATE TAX revenue during 1 st PHASE OF OPERATION period {2004 -2010} , mln. JPY (adjusted for CPI, base 1982) 1 9 8 2 1 9 8 3 1 9 8 4 1 9 8 5 Variable Treatment 2 Number of tax payers 1 9 8 6 1 9 8 7 1 9 8 8 1 9 8 9 1 9 9 0 1 9 9 1 1 9 9 2 1 9 9 3 1 9 9 4 1 9 9 5 1 9 9 6 1 9 9 7 1 9 9 8 1 9 9 9 2 0 0 0 2 0 0 1 2 0 0 2 2 0 0 4 2 0 0 5 2 0 0 6 Regression 1 Regression 2 Regression 3 Regression 4 Regression 5 -4772. 54 [-0. 2] 5. 8952514* [1. 95] Treatment 3 5. 8957045* [1. 95] -15947. 8 [-0. 87] 5. 896112* [1. 95] 5. 8953585* [1. 95] 5. 8629645* [1. 91] -13250. 4 [-1. 06] Treatment 5 -6883. 09 [-0. 7] Treatment 7 Treatment. Constant 2 0 0 3 -665679 [-1. 35] -665418 [-1. 35] -665323 [-1. 35] -665358 [-1. 35] -28030. 8 [-0. 65] -658553 [-1. 32] 2 0 0 7 2 0 0 8 2 0 0 9 2 0 1 0 2 0 1 1 2 0 1 2 2 0 1 3 COMPOSITION OF GROUPS Group 2 Group 5 Kagoshim a a Kumamot o o Fukuoka Group 3 Oita Kagoshim Miyazaki a Kumamot o Fukuoka Group. Co n Group 7 Kagoshim 799 799 799 N a 0. 269215 0. 269281 0. 269291 0. 269241 0. 269779 R 2 Kagoshim Kumamot F 1. 934589 2. 106448 2. 074548 2. 100607 8. 497174 a o Note: Treatment 2 = Time Dummy {1991 -2003} x Group 2. etc. t-values are in parenthesis. Legend: * p<. 1; ** p<. 05; *** p<. 01. Clustering standard errors are used, allowing for heteroscedasticity and arbitrary autocorrelation within a prefecture, Kumamot Fukuoka but treating the errors as uncorrelated across prefectures o 33
 Impact of Kyushu Shinkansen Rail on CORPORATE TAX revenue during 2 nd PHASE OF OPERATION period {2011 -2013} , mln. JPY (adjusted for CPI, base 1982) 1 9 8 2 1 9 8 3 1 9 8 4 1 9 8 5 Variable Treatment 2 Number of tax payers 1 9 8 6 1 9 8 7 1 9 8 8 1 9 8 9 1 9 9 0 1 9 9 1 1 9 9 2 1 19 9 94 9 3 1 9 9 5 1 9 9 6 1 9 9 7 1 9 9 8 1 9 9 9 2 0 0 0 2 0 0 1 2 0 0 2 2 0 0 4 2 0 0 5 2 0 0 6 Regression 1 Regression 2 Regression 3 Regression 4 Regression 5 72330. 012** [2. 2] 5. 5277056*** [3. 13] Treatment 3 5. 5585431*** [3. 14] 104664. 34* [2] 5. 558603*** [3. 14] 5. 5706545*** [3. 14] 5. 9640287*** [3. 07] 82729. 673** [2. 1] Treatment 5 80998. 365** [2. 34] Treatment 7 Treatment. Constant 2 0 0 3 -568133. 98** [-2. 07] -573747. 28** [-2. 08] -574245. 87** [-2. 08] -576867. 56** [-2. 09] 179632 [1. 58] -642138. 87** [-2. 1] 2 0 0 7 2 0 0 8 2 0 0 9 2 0 1 0 2 0 1 1 2 0 1 2 2 0 1 3 COMPOSITION OF GROUPS Group 2 Group 5 Kagoshim a a Kumamot o o Fukuoka Group 3 Oita Kagoshim Miyazaki a Kumamot o Fukuoka Group. Co n Group 7 Kagoshim 611 611 611 N a 0. 350653 0. 352058 0. 352144 0. 352874 0. 364088 R 2 Kagoshim Kumamot F 5. 062509 5. 486197 5. 351791 5. 431088 16. 55518 a o Note: Treatment 2 = Time Dummy {1991 -2003} x Group 2. etc. t-values are in parenthesis. Legend: * p<. 1; ** p<. 05; *** p<. 01. Clustering standard errors are used, allowing for heteroscedasticity and arbitrary autocorrelation within a prefecture, Kumamot Fukuoka but treating the errors as uncorrelated across prefectures 34 o
 Total tax revenue, mln. JPY 600000 500000 Group 7 mln. JPY 400000 300000 Group 5 200000 Group 3 100000 0 Group 2 Group 8 Previous Construction Operation 1 Operation 2 period [1991 -2003] [2004 -2010] [2011 -2013] [1982 -1990] 35
 Give incentives to operating entity 36") Public-Private Partnership (PPP) Give incentives to operating entity 36
Public-Private Partnership (PPP) Give incentives to operating entity 36
 Enhance regional economy Start up businesses, farmers, SMEs Hometown Investment Trust Funds -------------------------A Stable Way to Supply Risk Capital Yoshino, Naoyuki; Kaji, Sahoko (Eds. ) 2013, IX, 98 p. 41 illus. , 20 illus. in color Available Formats: ebook Hardcover Japan, Cambodia Springer Vietnam, Peru 37
 Investment in SMEs and start up businesses 38 38
 39
39
 10/14/2016 40
 Infrastructure Finance Government Budget Infrastructure investment Tax Postal Government Saving Post Viability Fund Insurance Domestic Private Investors (Pension Funds, Overseas’ Private Insurance) Investors Asian Financial Crisis ODA 41
 Long term and Patient investors are needed 1. Bank deposits – Bank loans (2 -5 years) 2. Life insurance (20 years, 30 years) 3. Pension funds (20, 30, 40 years) Long term financing 4. Asset Management of long term instruments 5. Financial education has to be 42
 SME finance, innovation and Credit Scoring of SMEs Naoyuki Yoshino Dean, Asian Development Bank Institute (ADBI) Professor Emeritus, Keio University, Japan nyoshino@adbi. org, yoshino@econ. keio. ac. jp
 Access to Finance by SMEs and Large Firms in Japan 44
 Barriers for SMEs in Accessing Financial Institutions, Collateral, Higher rate Source: ADB–OECD study on enhancing financial accessibility for SMEs: Lessons from recent crises. Mandaluyong City, Philippines: Asian Development Bank, 2013 45
 SMEs in the People’s Republic of China 46
 Venture business Toyota, Honda, Seven. Eleven, Nintendo could") Small and Medium Sized Enterprise (SME) Venture business Toyota, Honda, Seven. Eleven, Nintendo could not borrow from Mitsubishi. HONDA was not supported by government. Mr. HONDA worked at SME as a repairman. HONDA could not borrow money Mitsubishi-bank made loans to HONDA. How to finance start-up business ? 47
Small and Medium Sized Enterprise (SME) Venture business Toyota, Honda, Seven. Eleven, Nintendo could not borrow from Mitsubishi. HONDA was not supported by government. Mr. HONDA worked at SME as a repairman. HONDA could not borrow money Mitsubishi-bank made loans to HONDA. How to finance start-up business ? 47
 48
48
 Regulation of Money Lenders in Rural Regions 1, Money lenders, Interest rate = 96% in Japan 2, License --- Banks Registration --- Finance companies 3, New Finance Company Law (i) Highest interest rate = 20% (ii) Amount of borrowing < 1/3 of Income (iii) Minimum Capital requirement (iv) Paper test to run business (v) Self regulatory organization was set up two steps of monitoring and supervision (vi) Consumers’ complaints (hotline) 49
 50
50
 51
51
 Optimal Credit Guarantee Ratio 52
 Cluster Analysis of SMES 53
 54
54
 Data Collected 55
 Factor Loadings of Financial Variables after Direct Oblimin Rotation 56
 Sales (ii) Assets (iii) Liquidity (Cash)") Credit Rating of SMEs using Asian Data (i) Sales (ii) Assets (iii) Liquidity (Cash) (iv) Total Debt 57
Credit Rating of SMEs using Asian Data (i) Sales (ii) Assets (iii) Liquidity (Cash) (iv) Total Debt 57
 and Cluster Analysis 58") Grouping Based on Principal Component (Z 1 -Z 2) and Cluster Analysis 58
Grouping Based on Principal Component (Z 1 -Z 2) and Cluster Analysis 58
 model and we ran the regression by") A maximum likelihood-binary probit (Quadratic hill climbing) model and we ran the regression by using ordinary least square method. Using probit models for assessing the impact of macro-level variables as well as microlevel variables on default is popular among scholars since decades ago up to the most recent (Mizen and Tsoukas, 2012, Amaral et al. 2014, and Moulton et al. , 2015). However, the advantage of our method comparing to a normal probit just by employing financial ratios as the explanatory variables is that our prediction is based on the factors analysis. Each of these factors are containing information of several of variables (financial ratios), and in preparation of these factors the unnecessary information is eliminated by statistical techniques. Table 6: Probit regression result 59
A maximum likelihood-binary probit (Quadratic hill climbing) model and we ran the regression by using ordinary least square method. Using probit models for assessing the impact of macro-level variables as well as microlevel variables on default is popular among scholars since decades ago up to the most recent (Mizen and Tsoukas, 2012, Amaral et al. 2014, and Moulton et al. , 2015). However, the advantage of our method comparing to a normal probit just by employing financial ratios as the explanatory variables is that our prediction is based on the factors analysis. Each of these factors are containing information of several of variables (financial ratios), and in preparation of these factors the unnecessary information is eliminated by statistical techniques. Table 6: Probit regression result 59
 Credit Rating for SMEs by Use of SME Database 1, Credit Rating is only applicable to large companies 2, Credit Rating for SMEs based on SME Data 3, Three ranking of SMEs (Asian country) Five ranking of SMEs (Japan’s case) 4, SME data can produce default risk ratio 5, Risk based Interest rate 60
 Financial Education for SMEs 1, Bookkeeping 2, Daily revenue and expenses 3, Long-term planning 4, Accurate reporting of their business 5, Reduce default loan losses SME database 6, Asset Management by SME 7, Pension Contribution by SME (50%) Asset Management of Reserves 61
 62
62
 63
63
 64
64
, “The Optimal Basel Capital Requirement") References Naoyuki Yoshino, Tomohiro Hirano, and Kakeru Miura, (2009), “The Optimal Basel Capital Requirement to Cope with Pro-cyclicality: A Theoretical Approach”, (Financial Research and Training Center, Financial Services Agency (FSA), Government of Japan. FRTS Discussion papers, DP 2009 -6) http: //www. fsa. go. jp/frtc/english/seika/discussion. html Naoyuki Yoshino and Tomohiro Hirano (2011) “Procyclicality of The Basel Capital Requirement Ratio and Its Impact on Banks” Asian Economic Papers, MIT Press, 2011, Vol. 10, Himino, Ryozo. , (2009), “A counter-cyclical Basel II, ” RISK magazine, 01, Mar 2009 Revankar N. and Yoshino, N. , (2008) “An Empirical Analysis of Japanese Banking Behavior in a Period of Financial Instability, ” Keio Economic Studies, Vol. 45 No. 1. Yoshino, Naoyuki and Tetsuro Mizoguchi (2010) “The Role of Public Works in the Political Business Cycle and the Instability of 65 the Budget Deficits in Japan” (Asian Economic Papers, MIT Press).
References Naoyuki Yoshino, Tomohiro Hirano, and Kakeru Miura, (2009), “The Optimal Basel Capital Requirement to Cope with Pro-cyclicality: A Theoretical Approach”, (Financial Research and Training Center, Financial Services Agency (FSA), Government of Japan. FRTS Discussion papers, DP 2009 -6) http: //www. fsa. go. jp/frtc/english/seika/discussion. html Naoyuki Yoshino and Tomohiro Hirano (2011) “Procyclicality of The Basel Capital Requirement Ratio and Its Impact on Banks” Asian Economic Papers, MIT Press, 2011, Vol. 10, Himino, Ryozo. , (2009), “A counter-cyclical Basel II, ” RISK magazine, 01, Mar 2009 Revankar N. and Yoshino, N. , (2008) “An Empirical Analysis of Japanese Banking Behavior in a Period of Financial Instability, ” Keio Economic Studies, Vol. 45 No. 1. Yoshino, Naoyuki and Tetsuro Mizoguchi (2010) “The Role of Public Works in the Political Business Cycle and the Instability of 65 the Budget Deficits in Japan” (Asian Economic Papers, MIT Press).