a4bb30a0188f4863d136c812bbb958a5.ppt
- Количество слайдов: 17
Digital Engineering & Mobile Solutions Performance Engineering Transformation Date: 03/11/2015 © 2013 Walgreen Co. All rights reserved.
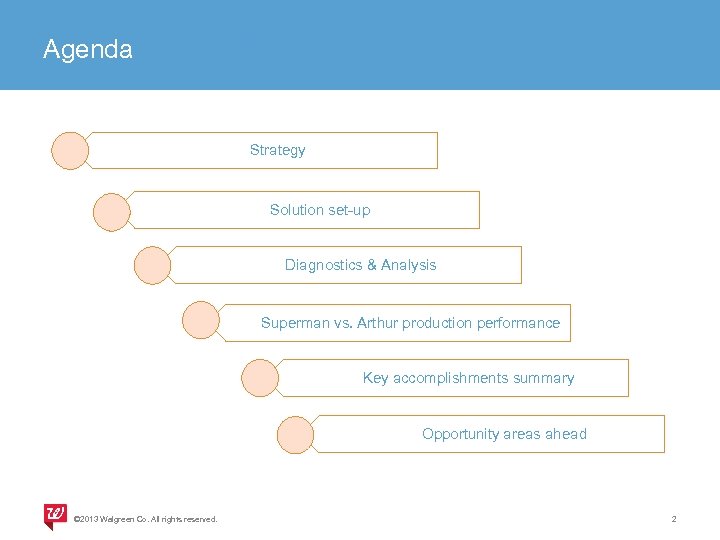
Agenda Strategy Solution set-up Diagnostics & Analysis Superman vs. Arthur production performance Key accomplishments summary Opportunity areas ahead © 2013 Walgreen Co. All rights reserved. 2
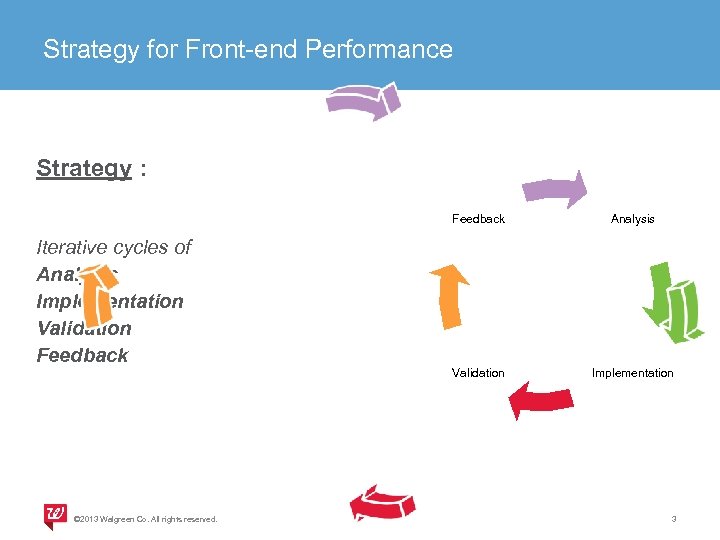
Strategy for Front-end Performance Strategy : Feedback Analysis Validation Implementation Iterative cycles of Analysis Implementation Validation Feedback © 2013 Walgreen Co. All rights reserved. 3
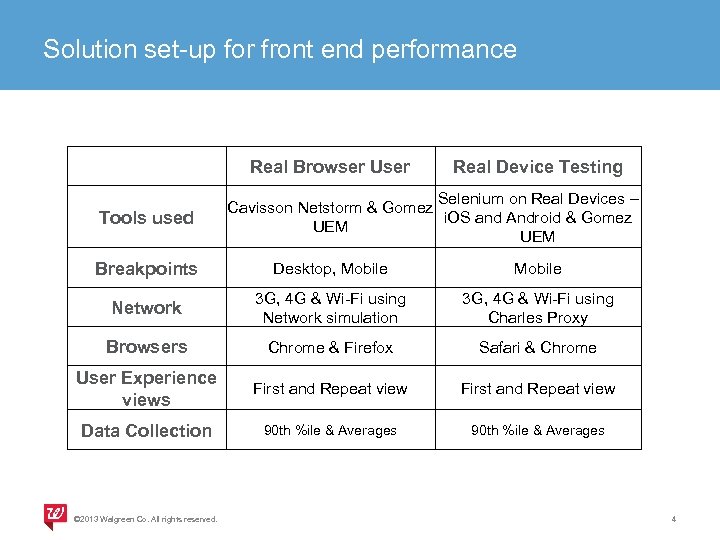
Solution set-up for front end performance Tools used Real Browser User Real Device Testing Selenium on Real Devices – Cavisson Netstorm & Gomez i. OS and Android & Gomez UEM Breakpoints Desktop, Mobile Network 3 G, 4 G & Wi-Fi using Network simulation 3 G, 4 G & Wi-Fi using Charles Proxy Browsers Chrome & Firefox Safari & Chrome User Experience views First and Repeat view Data Collection 90 th %ile & Averages © 2013 Walgreen Co. All rights reserved. 4
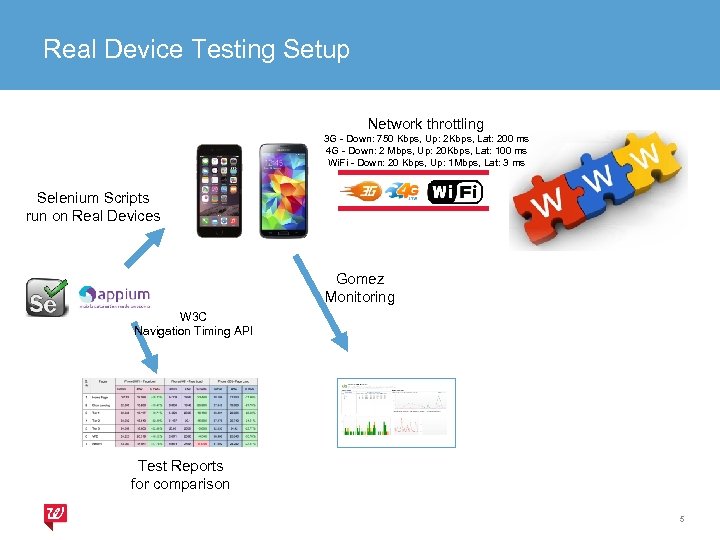
Real Device Testing Setup Network throttling 3 G - Down: 750 Kbps, Up: 2 Kbps, Lat: 200 ms 4 G - Down: 2 Mbps, Up: 20 Kbps, Lat: 100 ms Wi. Fi - Down: 20 Kbps, Up: 1 Mbps, Lat: 3 ms Selenium Scripts run on Real Devices Gomez Monitoring W 3 C Navigation Timing API Test Reports for comparison 5
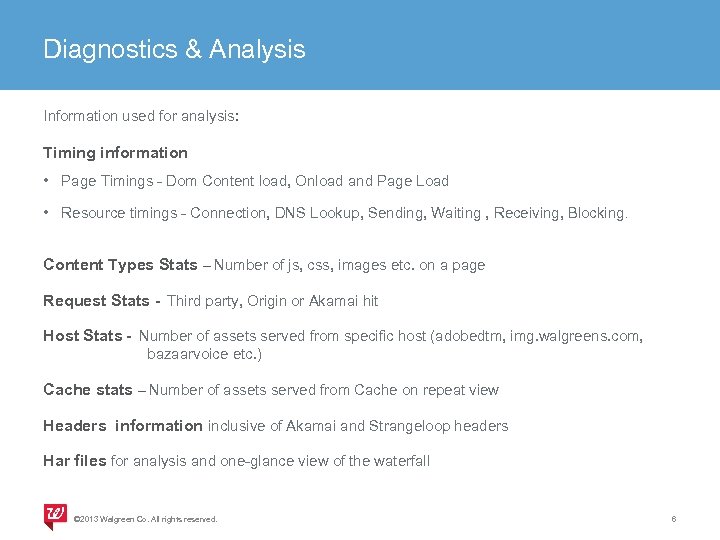
Diagnostics & Analysis Information used for analysis: Timing information • Page Timings - Dom Content load, Onload and Page Load • Resource timings - Connection, DNS Lookup, Sending, Waiting , Receiving, Blocking. Content Types Stats – Number of js, css, images etc. on a page Request Stats - Third party, Origin or Akamai hit Host Stats - Number of assets served from specific host (adobedtm, img. walgreens. com, bazaarvoice etc. ) Cache stats – Number of assets served from Cache on repeat view Headers information inclusive of Akamai and Strangeloop headers Har files for analysis and one-glance view of the waterfall © 2013 Walgreen Co. All rights reserved. 6
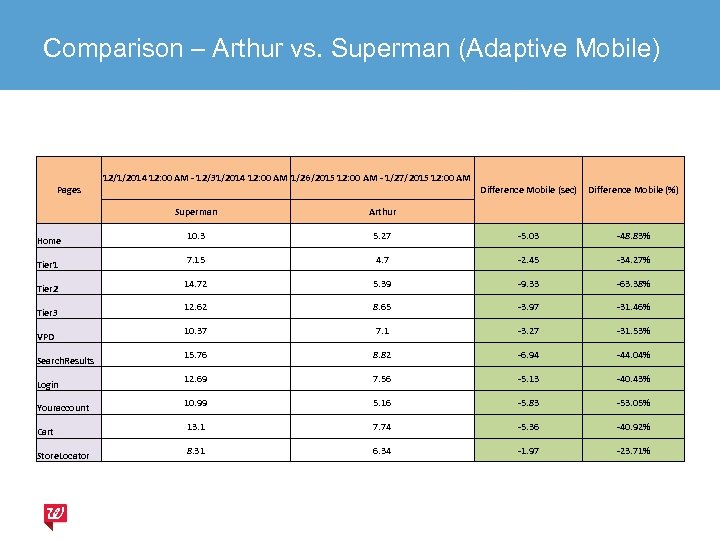
Comparison – Arthur vs. Superman (Adaptive Mobile) Pages 12/1/2014 12: 00 AM - 12/31/2014 12: 00 AM 1/26/2015 12: 00 AM - 1/27/2015 12: 00 AM Difference Mobile (sec) Difference Mobile (%) Superman Home Tier 1 Tier 2 Tier 3 VPD Search. Results Login Youraccount Cart Store. Locator Arthur 10. 3 5. 27 -5. 03 -48. 83% 7. 15 4. 7 -2. 45 -34. 27% 14. 72 5. 39 -9. 33 -63. 38% 12. 62 8. 65 -3. 97 -31. 46% 10. 37 7. 1 -3. 27 -31. 53% 15. 76 8. 82 -6. 94 -44. 04% 12. 69 7. 56 -5. 13 -40. 43% 10. 99 5. 16 -5. 83 -53. 05% 13. 1 7. 74 -5. 36 -40. 92% 8. 31 6. 34 -1. 97 -23. 71%
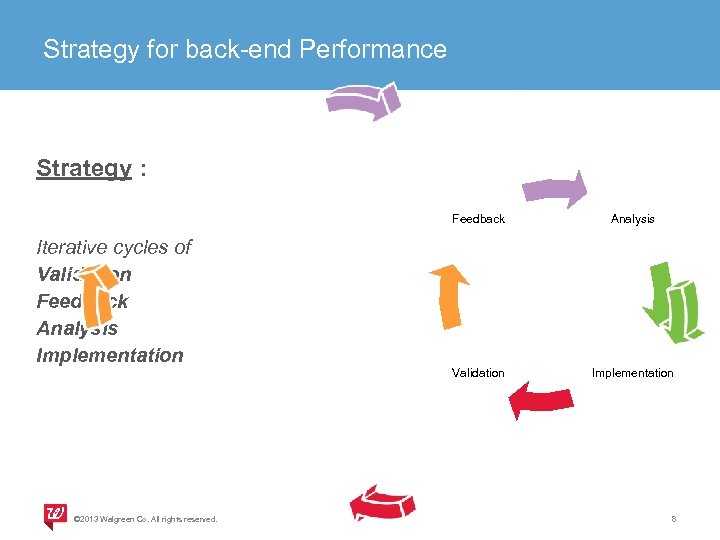
Strategy for back-end Performance Strategy : Feedback Analysis Validation Implementation Iterative cycles of Validation Feedback Analysis Implementation © 2013 Walgreen Co. All rights reserved. 8
Solution set-up for back-end performance | load test Tool used - Cavisson Netstorm & App Dynamics integration – correlation. Load Profile – 20% of transactions which represent 80% of our prod volume usage. Volume/Load profile is about 12% of production volumes. Data Collection – Client Side Metrics • Transaction Response Time • Throughput • Hits/second • Number of Passed/Failed transaction Server Side Metrics • Response time of services and pages from App Layer • Memory, Processor and Disk usage stats • Network Usage stats • Thread Pool stats • Apache server stats © 2013 Walgreen Co. All rights reserved. 9
Catching back end performance issues early | Cruella multi site Symptoms • • • High response time for all the transactions (from avg 0. 1 sec in Arthur to 7. 8 sec in Cruella) Large number of Young GCs (from 120 in Arthur to 250 in Cruella). Large number of Tenured GCs (from 4 in Arthur to 60 in Cruella). Load Averages on App server increased from 7 to 30 CPU utilization on App server increased from 10% to 45%. 'Number of request in process' on web server increased from 200 to 700. Resolution • • • Circular Reference in profile components were identified and were removed Profile Realm manager was disabled Proxy Factory was disabled © 2013 Walgreen Co. All rights reserved. 10
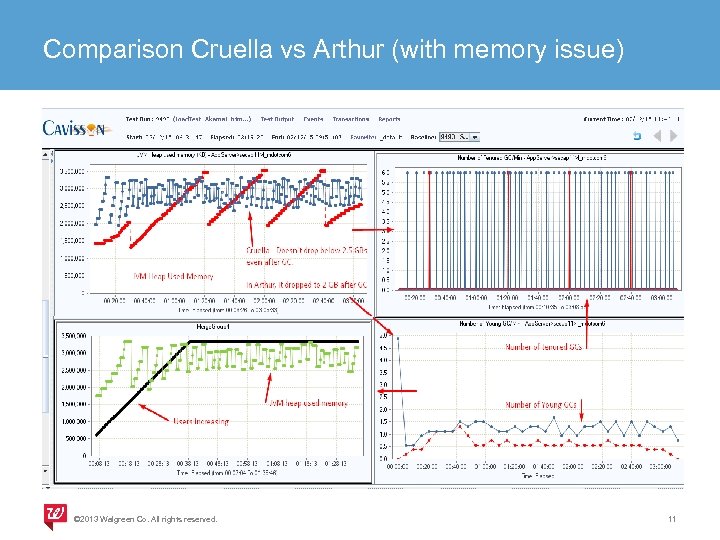
Comparison Cruella vs Arthur (with memory issue) © 2013 Walgreen Co. All rights reserved. 11
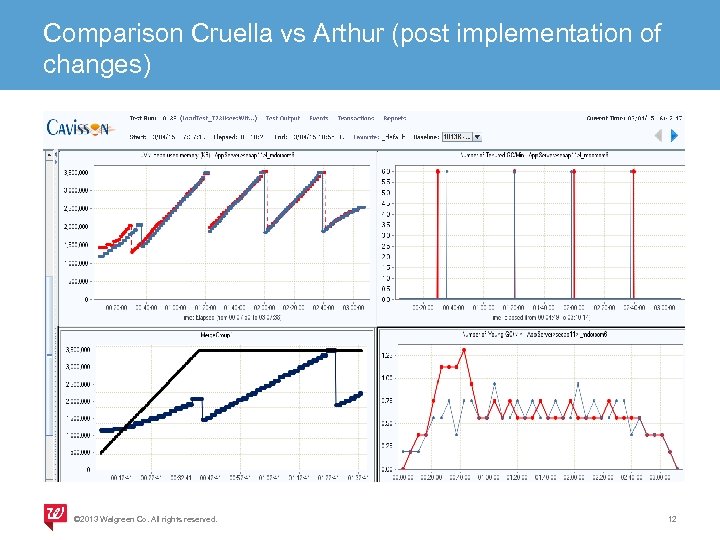
Comparison Cruella vs Arthur (post implementation of changes) © 2013 Walgreen Co. All rights reserved. 12
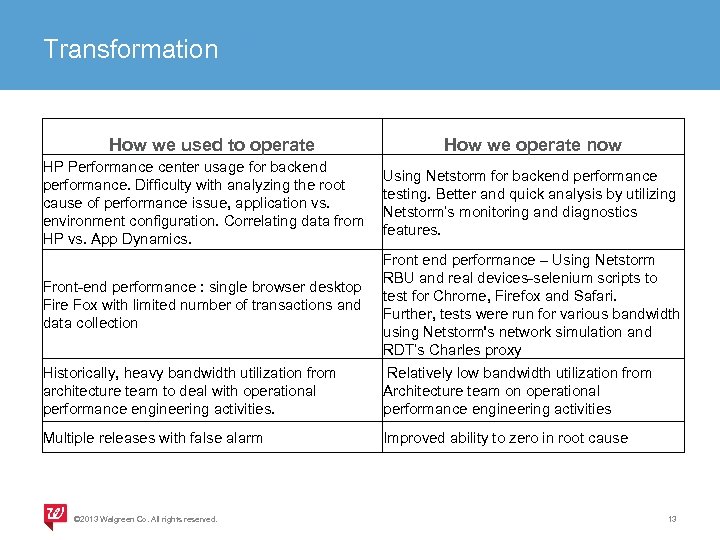
Transformation How we used to operate How we operate now HP Performance center usage for backend performance. Difficulty with analyzing the root cause of performance issue, application vs. environment configuration. Correlating data from HP vs. App Dynamics. Using Netstorm for backend performance testing. Better and quick analysis by utilizing Netstorm’s monitoring and diagnostics features. Front-end performance : single browser desktop Fire Fox with limited number of transactions and data collection Front end performance – Using Netstorm RBU and real devices-selenium scripts to test for Chrome, Firefox and Safari. Further, tests were run for various bandwidth using Netstorm's network simulation and RDT’s Charles proxy Historically, heavy bandwidth utilization from architecture team to deal with operational performance engineering activities. Relatively low bandwidth utilization from Architecture team on operational performance engineering activities Multiple releases with false alarm Improved ability to zero in root cause © 2013 Walgreen Co. All rights reserved. 13
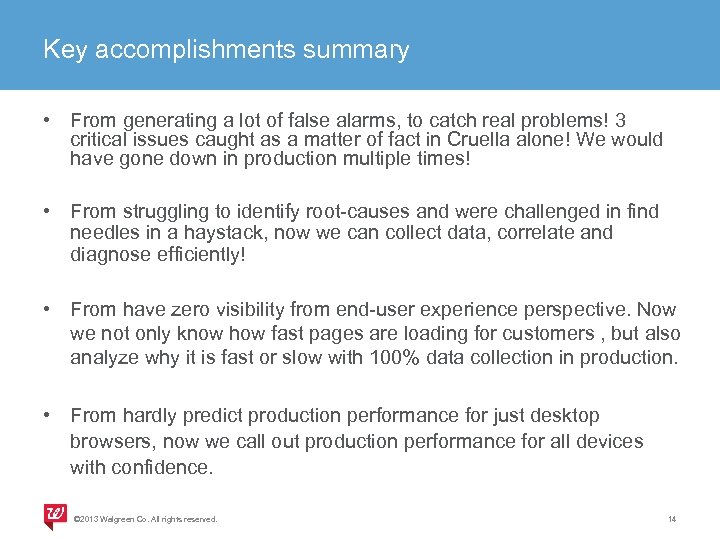
Key accomplishments summary • From generating a lot of false alarms, to catch real problems! 3 critical issues caught as a matter of fact in Cruella alone! We would have gone down in production multiple times! • From struggling to identify root-causes and were challenged in find needles in a haystack, now we can collect data, correlate and diagnose efficiently! • From have zero visibility from end-user experience perspective. Now we not only know how fast pages are loading for customers , but also analyze why it is fast or slow with 100% data collection in production. • From hardly predict production performance for just desktop browsers, now we call out production performance for all devices with confidence. © 2013 Walgreen Co. All rights reserved. 14
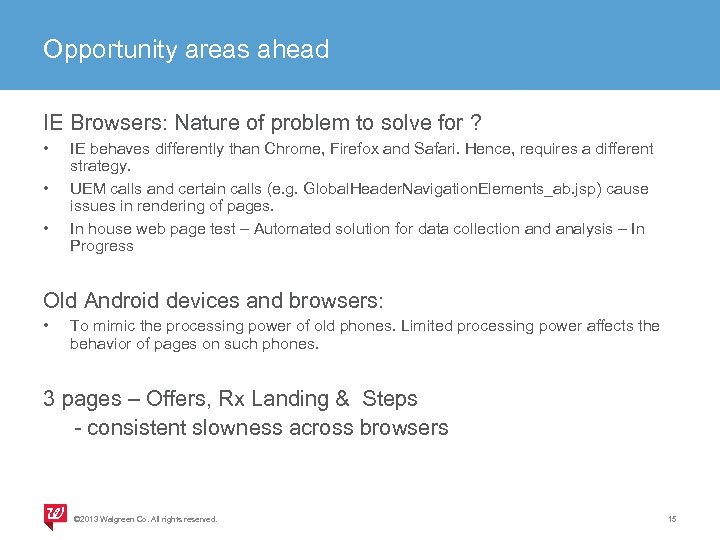
Opportunity areas ahead IE Browsers: Nature of problem to solve for ? • • • IE behaves differently than Chrome, Firefox and Safari. Hence, requires a different strategy. UEM calls and certain calls (e. g. Global. Header. Navigation. Elements_ab. jsp) cause issues in rendering of pages. In house web page test – Automated solution for data collection and analysis – In Progress Old Android devices and browsers: • To mimic the processing power of old phones. Limited processing power affects the behavior of pages on such phones. 3 pages – Offers, Rx Landing & Steps - consistent slowness across browsers © 2013 Walgreen Co. All rights reserved. 15
Q & A ? © 2013 Walgreen Co. All rights reserved. 16

Thank You
a4bb30a0188f4863d136c812bbb958a5.ppt