c5fe255384f47404f69c043c2bf4310e.ppt
- Количество слайдов: 25

Diagnostic Tools: Debug Recording © 2005 Audio. Codes Ltd. All rights reserved.
What is Debug Recording ► The Debug Recording (DR) is a mechanism that is used to capture and record the traffic that is sent / received from / to the gateway: ► Media streams (RTP, T. 38 and PCM) ► PSTN messages (ISDN, CAS, SS 7) ► Control messages (SIP, MGCP, MEGACO) ► Networking streams (such as HTTP and SCTP) ► Other internal information (such as DSP Events).
The Main Advantages of DR ► Can be used to record all IP traffic that is sent / received from / by the gateway ► Can be used to record the actual messages that are exchanged between the gateway and the PBX/PSTN switch ► Can be used to record the actual voice signal that arrives from the TDM (before it enters the DSP) ► Can be used to record network traffic in environments in which hub / port mirroring isn’t available ► Can be used to record internal traffic between two endpoints on the same gateway
Collecting DR Messages ► DR packets are captured using Wireshark ► Audio. Codes’ proprietary plugins (supplied in the software kit) must be placed in the 'plugin' folder of the installed Wireshark version (typically, c: Program FilesWire. Sharkpluginsxxx, where xxx is the installed version). ► Use the filter ‘acdr’ (on Wireshark version 0. 99. 4) to view the DR messages
Activating the DR ► Start a CLI management session (via the FAE page or telnet/ssh) ► Enter DR to access the Debug. Recording directory. ► Enter STOP to terminate all active recordings, if any. ► Enter RTR ALL to remove all previous recording rules. ► Enter RT ALL to remove all DR targets (i. e. , client IP addresses) ► Enter AIT <IP address of the target> to define the IP address of the PC to which the gateway sends its debug packets. ► Enter relevant trace rules (continued on next slide)
Trace Rules ► Add. IPControl. Trace – capture Control protocol (SIP, MGCP, MEGACO) signaling ► Add. Pstn. Signaling. Trace – capture ISDN, CAS, SS 7 signaling between switch/PBX and gateway ► Add. Next. Call. Trace – capture RTP or PCM audio of a set number of calls ► Add. Channel. Id. Trace – capture RTP or PCM audio for a specific channel ID or range of channel ID’s
Trace Rules Continued ► Add. Trunk. Bchannel. Trace – capture PCM audio for a specific B-channel or range of B-channels ► Add. IPTraffic. Trace – capture all or a specific type of IP packets (ARP, SNMP, HTTP, etc)
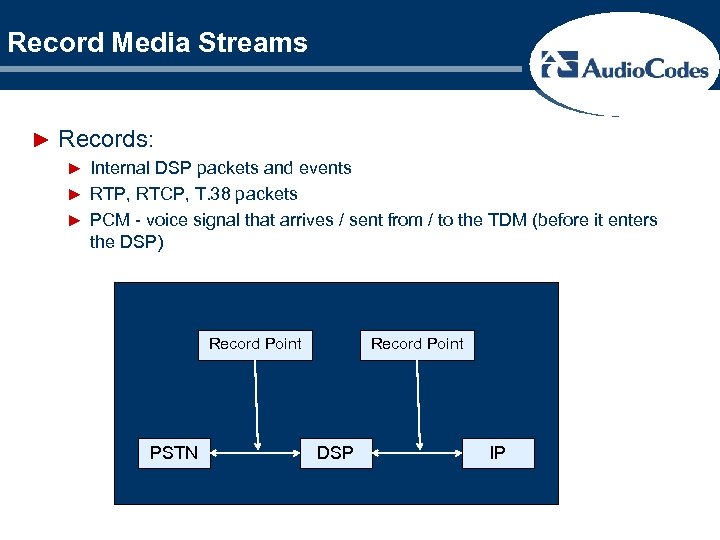
Record Media Streams ► Records: ► Internal DSP packets and events ► RTP, RTCP, T. 38 packets ► PCM - voice signal that arrives / sent from / to the TDM (before it enters the DSP) Record Point PSTN Record Point DSP IP
Record Media Streams (cont. ) ► Add. Next. Call. Trace ► Add. Trunk. Bchannel. Trace ► Add. Channel. Id. Trace ► To record all media traffic (including PCM) of the next call enter: ANCT ALL-WITH-PCM 1 See Trace Files: DR on internal MP call
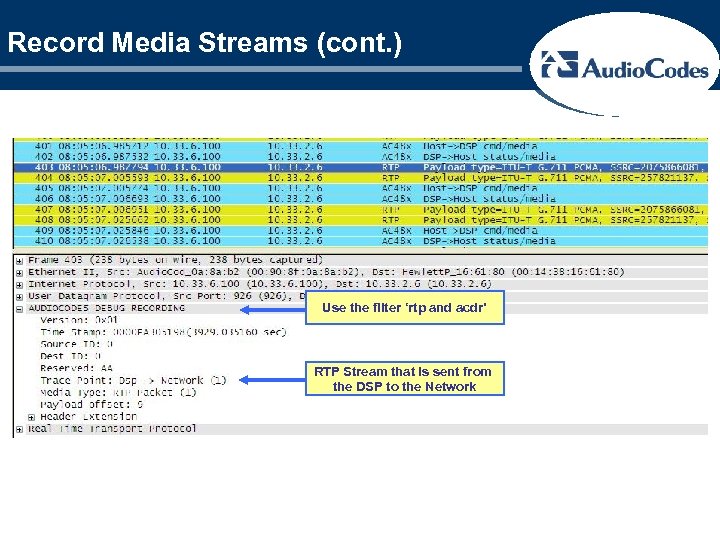
Record Media Streams (cont. ) Use the filter ‘rtp and acdr’ RTP Stream that is sent from the DSP to the Network
Record PSTN Messages ► Add. Pstn. Signaling. Trace: Records ISDN, CAS or SS 7 messages that are exchanged between the gateway and the PSTN/PBX switch. ► First enable PSTN traces on the required trunk: ► Via Web Interface (stopping the trunk is required): Access the ‘Trunk Settings’ screen Stop the trunk Select the ‘Advanced Parameter List’ option Set the trace level to ‘Full ISDN Trace’ Press the Apply Trunk Settings button ► Via cmd shell (without stopping the trunk) enter: pstn Pstn. COmmon Pstn. Set. Trace. Level <Trunk. Id> <BChannel> <Trace. Level> For example, to enable PSTN traces on the first trunk: Pstn. Set. Trace. Level 0 -1 1 ► For SS 7 only, set the Trace Level of the SNs and Links tables to 1.
Record PSTN Messages (cont. ) ► At the prompt, type Add. Pstn. Signaling. Trace <packet type - ISDN, CAS, or SS 7>. For example, APST ISDN. ► At the prompt, type START. See Trace Files: PSTN Trace with DR
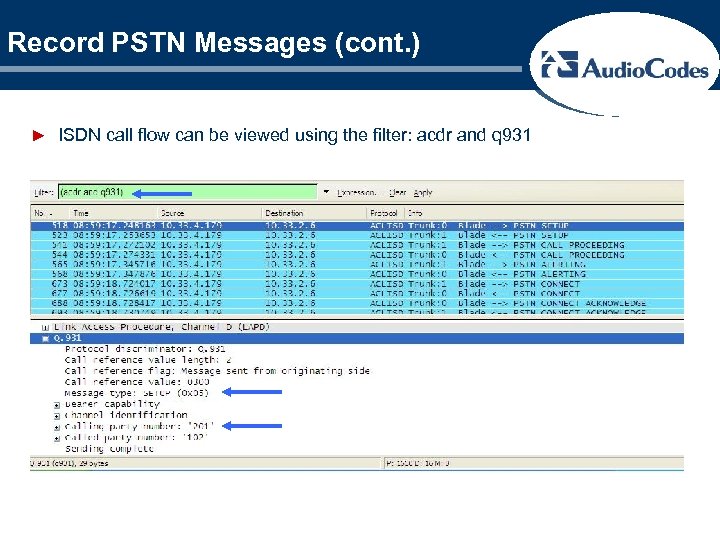
Record PSTN Messages (cont. ) ► ISDN call flow can be viewed using the filter: acdr and q 931
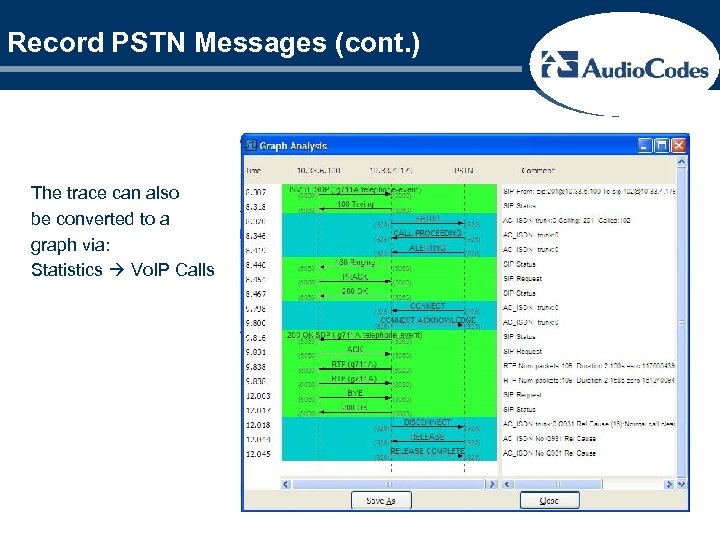
Record PSTN Messages (cont. ) The trace can also be converted to a graph via: Statistics Vo. IP Calls
Record Control Messages ► Records SIP, MEGACO, MGCP or TPNCP messages. ► Add. IPControl. Trace. Point Control. Type ► Trace point (on SIP a single direction is sufficient): Net 2 Host = Inbound non-media traffic Host 2 Net = Outbound non-media traffic ► Control. Type: SIP, MEGACO, MGCP or TPNCP ► At the prompt, type START.
Record IP Traffic ► Used to record IP streams that are not associated with media or control. Such as HTTP and SCTP. ► Format: Add. IPTraffic. Trace. Point PDUType Source. Port Dest. Port ► Trace Point: Net 2 Host or Host 2 Net ► PDUType: UDP, TCP, ICMP or IPType# Any other protocol type (as defined by http: //www. iana. org/assignments/protocol-numbers). A = All traffic types. ► Source. Port: source port number (or A for all ports). ► Dest. Port: destination port number (or A for all ports). ► To record SCTP traffic: aiptt n 2 h 132 a a aiptt h 2 n 132 a a
Activating DR Summary 1. 2. 3. 4. 5. 6. 7. 8. 9. 10. 11. 12. 13. 14. 15. 16. Log on to the FAE web interface to the gateway (http: //<IPof. Gateway>/FAE) and select ‘Cmd Shell’ Enter ‘Debug. Recording’ or ‘DR’ in the command window Stop any running traces with the command ‘Stop’ Remove all targets with command ‘Remove. Targets All’ Add the IP address and port of the laptop or pc to the list of available targets Remove the current trace rules with the command ‘Remove. Trace. Rules All’ Determine which CID’s or resources will need to be captured by the traces and use them to develop the rules in step 7 below. Add applicable rules for debug recording: AIPCT, ANCT, APST, etc If PSTN tracing is to be utilized, navigate to PSTN Pstn. COmmon Pstn. Set. Trace. Level <Trunk. Id> <BChannel> <Trace. Level> For example, to enable PSTN traces on the first trunk: Pstn. Set. Trace. Level 0 -1 1 (DIGITAL GATEWAYS ONLY) Enable Syslogs on the gateway and point them to the IP address of the laptop/pc. Set the verbosity level to ‘ 5’ for SIP. Start the Wireshark packet trace Enter ‘Start’ at the command line in the web interface to kick off the recording Make the calls and capture the data Stop the Debug Recording in the web interface Stop the Wireshark trace Validate the expected trace points have been captured in the Wireshark trace.
DR General Notes ► All PSTN, Media, Control and IP recording can be performed simultaneously ► All DR rules are deleted after the gateway is reset. ► Save the information that was captured in Wireshark and send it to Audio. Codes support ► DR recording must only be used for debugging purposes. On normal operation (if not requested differently from Audio. Codes’ support) DR should be disabled. ► To stop the DR, enter the command STOP in the command shell
Validating the traces ►Validate proper data collection ►Control Signaling ►PSTN trace ►IP audio streams ►PCM audio streams ►Extract audio
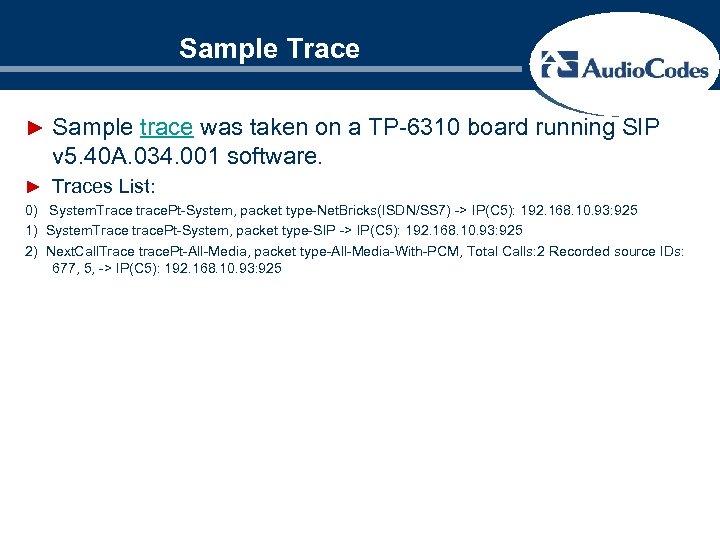
Sample Trace ► Sample trace was taken on a TP-6310 board running SIP v 5. 40 A. 034. 001 software. ► Traces List: 0) System. Trace trace. Pt-System, packet type-Net. Bricks(ISDN/SS 7) -> IP(C 5): 192. 168. 10. 93: 925 1) System. Trace trace. Pt-System, packet type-SIP -> IP(C 5): 192. 168. 10. 93: 925 2) Next. Call. Trace trace. Pt-All-Media, packet type-All-Media-With-PCM, Total Calls: 2 Recorded source IDs: 677, 5, -> IP(C 5): 192. 168. 10. 93: 925
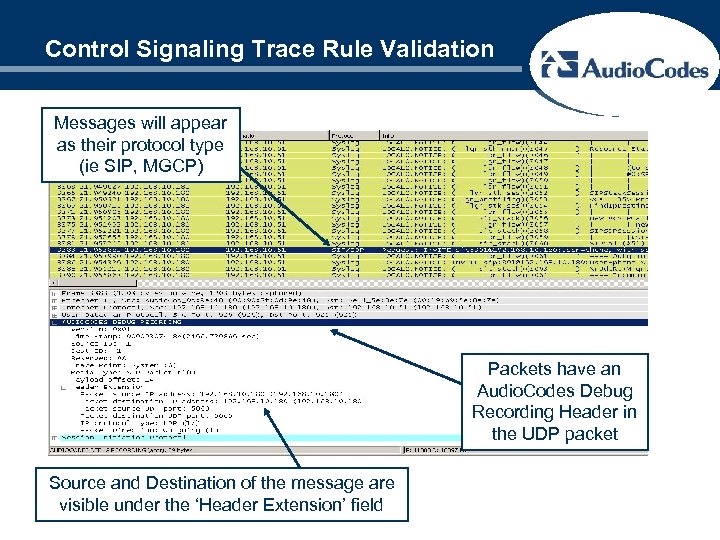
Control Signaling Trace Rule Validation Messages will appear as their protocol type (ie SIP, MGCP) Packets have an Audio. Codes Debug Recording Header in the UDP packet Source and Destination of the message are visible under the ‘Header Extension’ field
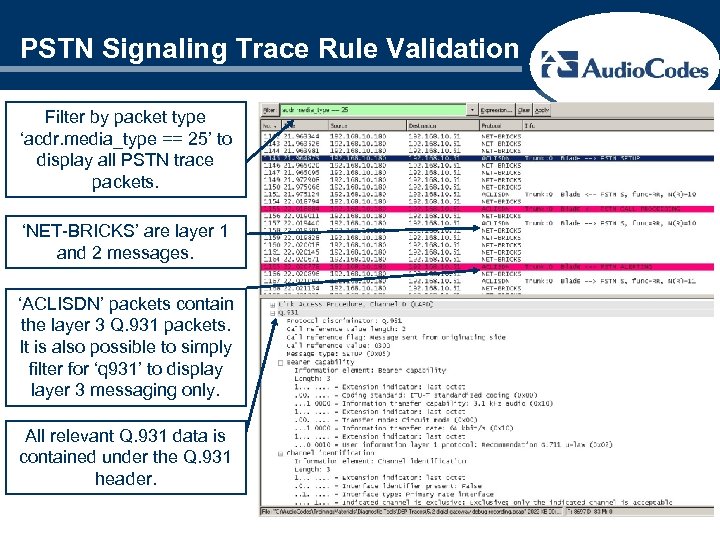
PSTN Signaling Trace Rule Validation Filter by packet type ‘acdr. media_type == 25’ to display all PSTN trace packets. ‘NET-BRICKS’ are layer 1 and 2 messages. ‘ACLISDN’ packets contain the layer 3 Q. 931 packets. It is also possible to simply filter for ‘q 931’ to display layer 3 messaging only. All relevant Q. 931 data is contained under the Q. 931 header.
Validating Audio Stream Capture ► Each audio trace (PCM or IP) will contain 2 streams: ►IP: ► DSP Network (outbound from gateway) ► Network DSP (inbound to gateway) ► Audio payloads will vary based on selected coder ►PCM: ► DSP TDM (outbound from gateway) ► TDM DSP (inbound to gateway) ► PCM Audio will always be either G. 711 mu-law or a-law
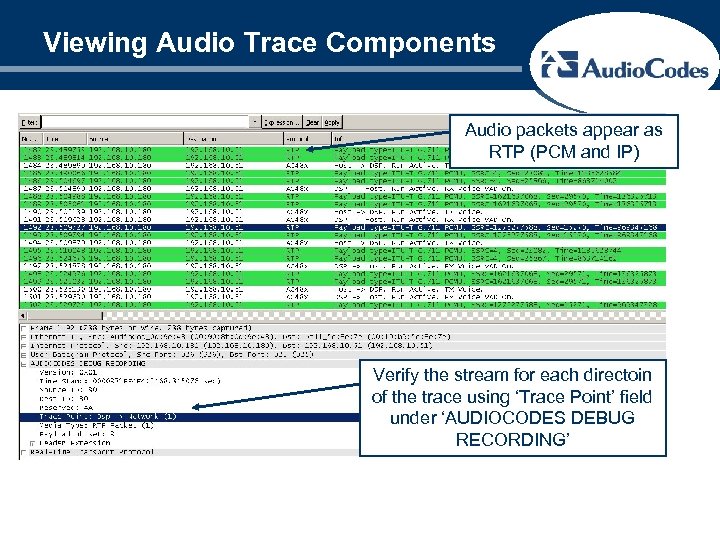
Viewing Audio Trace Components Audio packets appear as RTP (PCM and IP) Verify the stream for each directoin of the trace using ‘Trace Point’ field under ‘AUDIOCODES DEBUG RECORDING’
Extracting Audio From Traces ► Follow the same procedures for extracting audio from Debug Recording traces as for standard network traces using Wire. Shark. ► PCM audio can be saved off and listened to in the appropriate G. 711 format without any modification ► IP audio may have to be converted (i. e. G. 729) or otherwise manipulated to be played back
c5fe255384f47404f69c043c2bf4310e.ppt