

1384cb2d920c0ca28b65752f31e12cac.ppt
- Количество слайдов: 18
 Development of a 103 -Year High. Resolution Climate Data Set for the Conterminous United States Wayne Gibson 1, Christopher Daly 1, Tim Kittel 2, Doug Nychka 2, Craig Johns 2, Nan Rosenbloom 2, Alan Mc. Nab 3, and George Taylor 1 Spatial Climate Analysis Service, Oregon State University, Corvallis, OR 97331, USA 1 2 National Center for Atmospheric Research, Boulder, CO 80307, USA 3 National Climatic Data Center, Asheville, NC 29901, USA
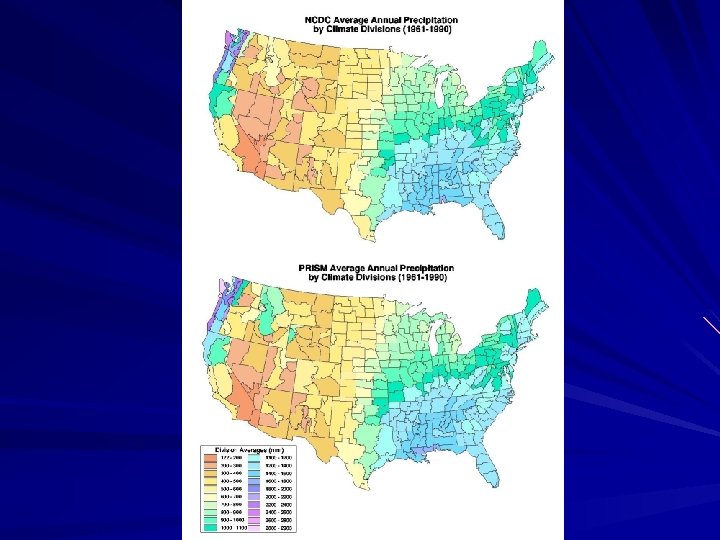
 Introduction Why is the data set so useful? • • • unique complete in space and time for long time period (US, 103 years) high resolution (4 km) spatial QC of the station data prior to modeling many applications need this type of data Methodology used to create grids • Statistical infilling of incomplete station data (NCAR) • PRISM model used to spatially map the station data PRISM products - Official USDA 1961 -1990 normals for the US - New NCDC Climate Atlas of the US (48 parameters) - Canada, China, European Alps, Pacific Islands, Puerto Rico
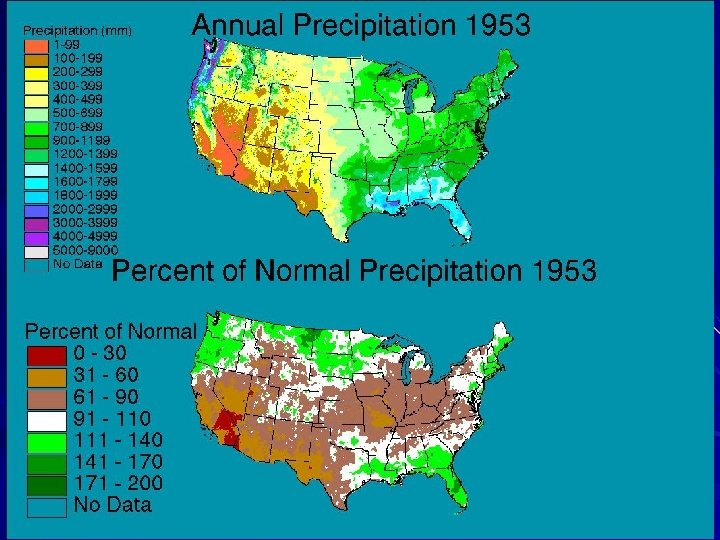
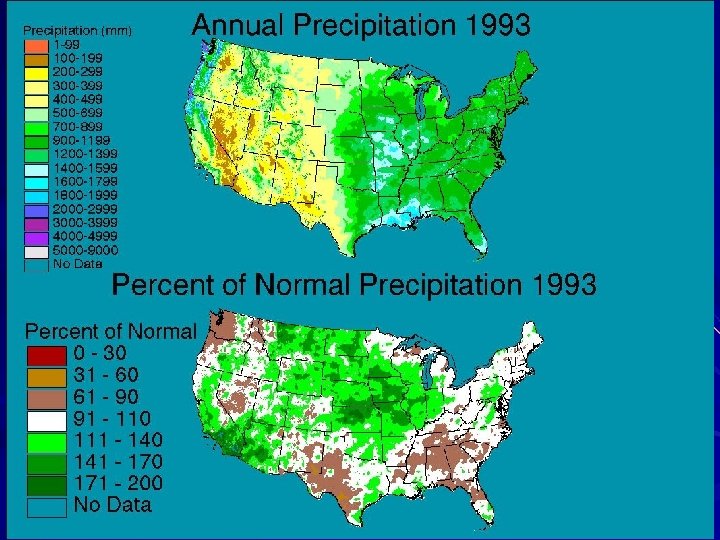
 Project Overview Main objective • To create serially complete, high quality, topographically sensitive, high resolution grids for the conterminous United States (ppt, Tmin, and Tmax) • To create a serially complete infilled station data set Progression • Year 1: Preliminary precipitation grids created for 1948 -1993 • Year 2: Development of a semi-automated Quality Control (QC) system (ASSAY QC, based on PRISM) • Year 3: Development of a more robust methodology for station data infilling (National Center for Atmospheric Research) • Year 4: Creation of final grids for the time period 1895 -1997
 COOP: National Weather Service") Collection of Station Data HCN: Historical Climate Network (1895 -1997) COOP: National Weather Service Cooperative Network (1895 -1997) MCC: COOP data from the Midwestern Climate Center (1895 -1947) SNOTEL: SNOwpack TELemetry Network, National Resource Conservation Service (1978 -1997) AG: Agricultural climate data (1961 -1993) MISC: Miscellaneous data (storage gauges, snow course) Inconsistencies between Station Data Networks
Collection of Station Data HCN: Historical Climate Network (1895 -1997) COOP: National Weather Service Cooperative Network (1895 -1997) MCC: COOP data from the Midwestern Climate Center (1895 -1947) SNOTEL: SNOwpack TELemetry Network, National Resource Conservation Service (1978 -1997) AG: Agricultural climate data (1961 -1993) MISC: Miscellaneous data (storage gauges, snow course) Inconsistencies between Station Data Networks
 Observation Networks over Time
 Observation Networks vs Elevation
 Latitude, longitude,") Data QC: Station Metadata Checks Elevation • Using Geographical Information Systems (GIS) Latitude, longitude, and elevation: • Analyzed each stations metadata for changes Total of 100 metadata errors • Horizontal position errors <= 2 degrees • Elevation errors <= 1200 m
Data QC: Station Metadata Checks Elevation • Using Geographical Information Systems (GIS) Latitude, longitude, and elevation: • Analyzed each stations metadata for changes Total of 100 metadata errors • Horizontal position errors <= 2 degrees • Elevation errors <= 1200 m
 Data QC: PRISM based QC system – ASSAY QC What is Bad Data • Data having transcription errors • We are not attempting to identify errors such as gauge under catch, observation methods, or instrumentation changes. ASSAY QC – automated method • • Jackknifed prediction Compare predicted to observed value Tag large differences as “candidate” outliers. Process of evaluating detection of outliers with actual station data (monthly and daily observations) Post Processing • Additional Check to “Candidates” Applied Based on Closest/Highest Weighted Station: - • Distance Elevation Precipitation Amount Large Outliers in the Observations Manual Checks List of “Bad” Observation. Mark as Missing.
 QC Results - Precipitation 2371 monthly data errors out of 6, 345, 675 station-months for a detection rate of 0. 0374% This are about 2 errors per monthly grid, not insignificant Also keep in mind that there is a propagation of errors in space. (50 km radius or greater)
 Example Outlier
 • HCN vs") Issues § Inconsistencies among Observation Networks • SNOTEL vs COOP (ppt) • HCN vs COOP (adjusted vs raw) § Station data infilling errors • Climatologically aided interpolation (climate as predictor) § ASSAY QC improvements • Easily detects outliers • Run iteratively § Independent evaluation • Long term runoff
Issues § Inconsistencies among Observation Networks • SNOTEL vs COOP (ppt) • HCN vs COOP (adjusted vs raw) § Station data infilling errors • Climatologically aided interpolation (climate as predictor) § ASSAY QC improvements • Easily detects outliers • Run iteratively § Independent evaluation • Long term runoff
 Fullerton: Location to Other Stations
 HCN vs COOP: Inconsistencies
 HCN vs COOP: Inconsistencies
 Summary • Important data set. High quality, high resolution, and long duration. • Can be used to support a variety of research topics in many disciplines. • Precipitation, Tmin, and Tmax – Summer 2002 • ftp: //ftp. ncdc. noaa. gov/pub/data/prism 100 http: //www. ocs. oregonstate. edu/prism