b20353d1197f849e383c16c8283339ab.ppt
- Количество слайдов: 12


Developing renewable energy cost effectively 3/16/2018 EUROPEAN COMMISSION Tom Howes European Commission

Progress to date… Eurostat
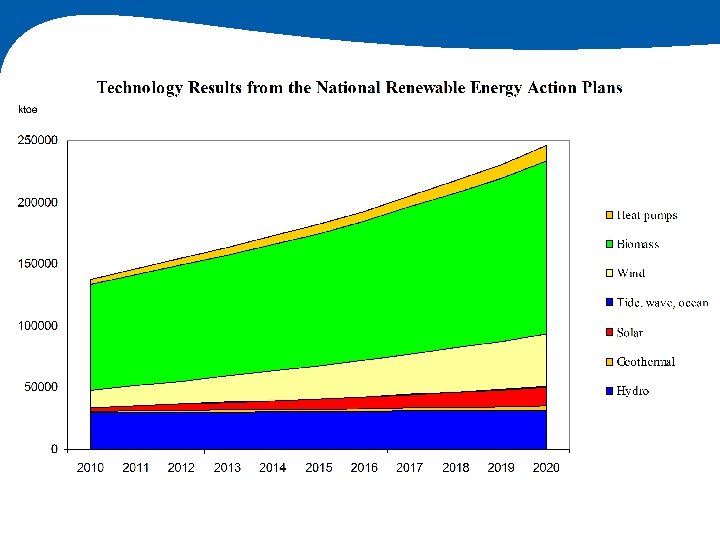

Technology breakdown - electricity

Cost estimations • Total investments in renewables are currently at a level of approximately € 35 bn/y • Most analysis predict this has to double to reach our 2020 targets • Unit cost of renewables, contrary to other forms of energy, are declining; for certain technologies sharply • • PV module costs around € 500/k. W Producing (and generating) renewables where most costefficient offers significant potential for lowering overall cost

Merit order effect • • • Denmark 2005: saving of 0. 3 to 0. 5 €cents per k. Wh consumed. Spain 2005: a reduction of about 0. 5 €cents/k. Wh at peak hour for each additional GWh Germany 2006: € 5 bn electricity price saving + CO 2 exp. = cost of EEG Ireland 2011: neutral impact EWEA EU 2020 estimate (265 GW wind): € 41. 7 bn/year savings (gross)
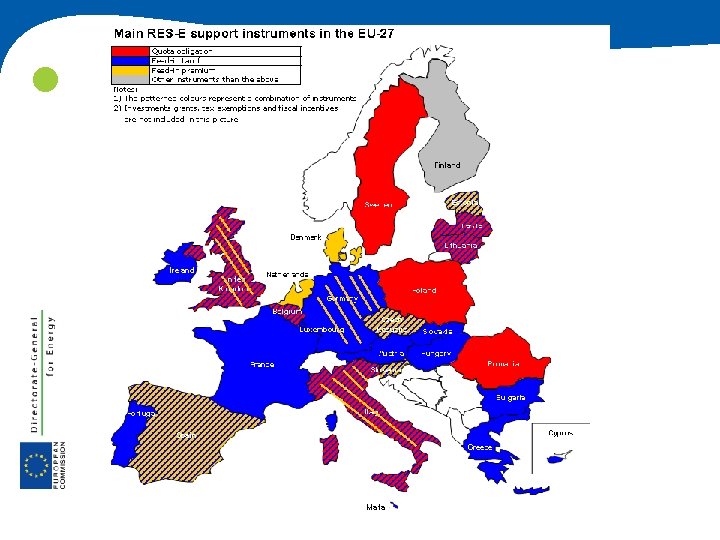

Feed in tariffs, Feed in Premiums & Quotas TGC revenues RES-support Market price FIT FIPs Quota stability of revenues and their composition (TGC=tradable green certificate) Fixed feed-in tariff (FIT) Quota Gov fixes price, market decides quantity Gov fixes quantity, market decides price § Fixed tariff (€/MWh) § Guaranteed during lifetime or x years § Minimum RES-E share § Purchase obligation § Increasing over time § (Grid (access & use) priority) § Penalty § Obligation for suppliers: § Feed-in premium (FIP) § Fixed premium (€/MWh) § Guaranteed during lifetime or x years § Tradable certificates for RES-E production (‘market’ price) § Obligation is met by submission of certificates to competent authority § Power sold on conventional markets Source: RE Shaping project
 Provide policy stability (for FIT /")
Points for reflection on support schemes (electricity) Provide policy stability (for FIT / FIP / Quota): è Retroactive / sudden changes should be avoided. è Move away from annual budgeting (creates stop and go) Reduce revenue risk: è Long term contracts are most relevant (15 -25 years) è Priority dispatch/curtailment compensation Apply automatic degression formulae for tariffs and premiums. è New tariffs (or premiums) fall according to learning curve of technology. è Other reductions in FIT/FIP require well planned, public tariff adjustment cycles or mechanisms (e. g. DE tariff falls if capacity grows by more than 3. 5 GW. . . ) Small scale development is a different market: è Many quota countries offer separate incentives: BE minimum prices for PV, IT FIP for PV, UK FIT for small-scale applications. Technology-banding within the quota as applied in UK can help to support cost-intensive technologies like wind offshore, but is less suitable for small-scale projects.

. The other elements of European energy policy: . EU policies working in tandem to provide a stable long term framework: » » » The creation of competition and the single market in energy The development of European infrastructure (@1 c/k. Wh) Europe's R&D programme for new technologies Energy Efficiency proposal to reduce consumption and transform the market 2050 – decarbonisation… 2030 milestones? . . . Impact of costs is clearly important: » » » Explore net impact (merit order effect) Recall the whole 2008 energy and climate package price estimate was “up to 10%” Operating costs of non renewable energy rising (again) 2050 energy scenarios explore cost consequences of decarbonisation RES costs driven by capital costs, driven by risk, driven partly by regulatory framework

2020/2050 Key Challenges » Increasing importance of RES increases requirements on: • Capacity and flexibility of electricity grids, of power plants, of energy storage of demand side management (~smart) » Energy Roadmap 2050 – due December » Renewable energy Communication on “post 2020” - due 2012 » • (public consultation imminent) Update on state of internal market - due 2012

you for your attention Thank http: //ec. europa. eu/energy/renewables/index_en. htm
b20353d1197f849e383c16c8283339ab.ppt