6c00e68d6f8ccb1da1a67693b4ffcf23.ppt
- Количество слайдов: 89
 Developing Efficient Graphics Software
 Developing Efficient Graphics Software • Intent of Course • • Identify application and hardware interaction Quantify and optimize interaction Identify efficient software structure Balance software and hardware component use
 Developing Efficient Graphics Software: Agenda • • 1: 35 General Performance Overview 2: 15 Software and System Performance 3: 00 Break 3: 15 Software profiling / Performance analysis 3: 40 Compiler and language issues 4: 00 Graphics techniques and algorithms 4: 45 Wrap-up and questions
 Developing Efficient Graphics Software • Speakers • Engineers for SGI • optimizing, differentiating graphics applications • Keith Cok, Bob Kuehne, Thomas True, Roger Corron • CAL content • reality. sgi. com/cok_newport/s 2000/index. htm CAL
 Software and System Performance Thomas J. True, SGI
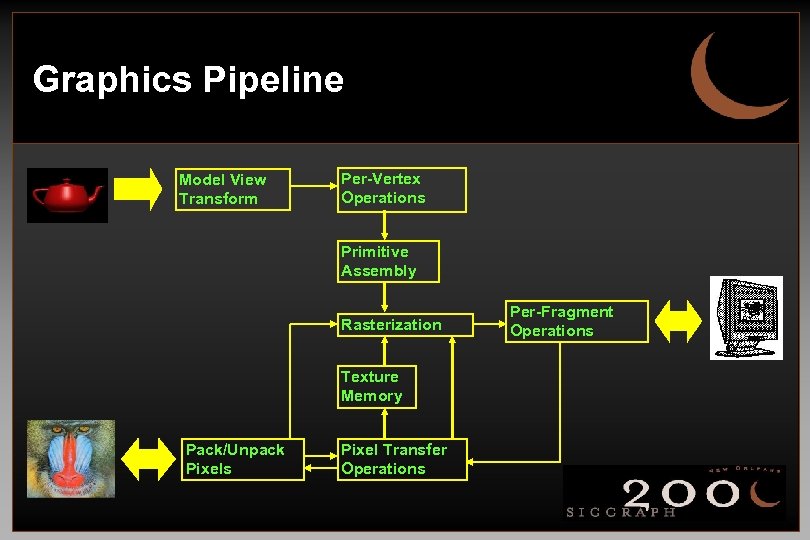 Graphics Pipeline Model View Transform Per-Vertex Operations Primitive Assembly Rasterization Texture Memory Pack/Unpack Pixels Pixel Transfer Operations Per-Fragment Operations
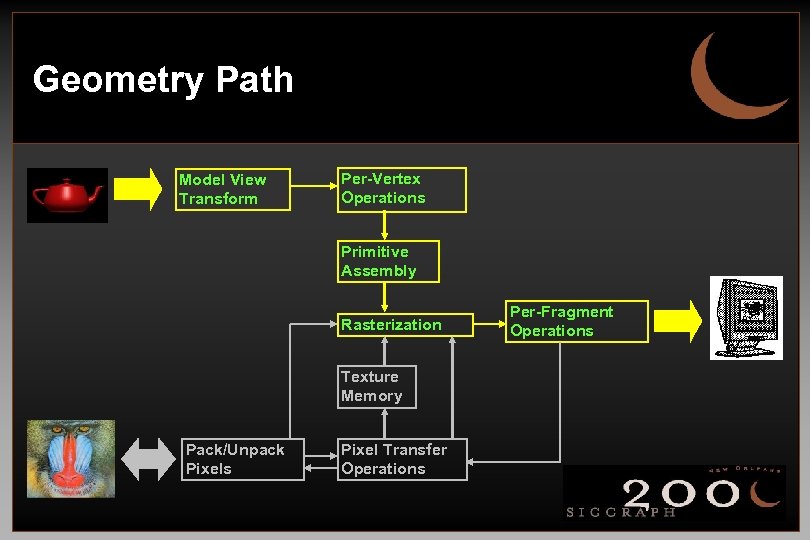 Geometry Path Model View Transform Per-Vertex Operations Primitive Assembly Rasterization Texture Memory Pack/Unpack Pixels Pixel Transfer Operations Per-Fragment Operations
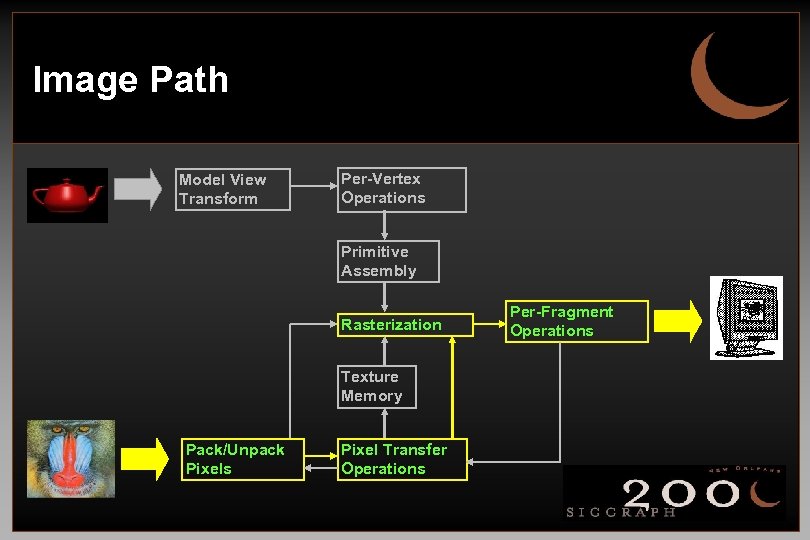 Image Path Model View Transform Per-Vertex Operations Primitive Assembly Rasterization Texture Memory Pack/Unpack Pixels Pixel Transfer Operations Per-Fragment Operations
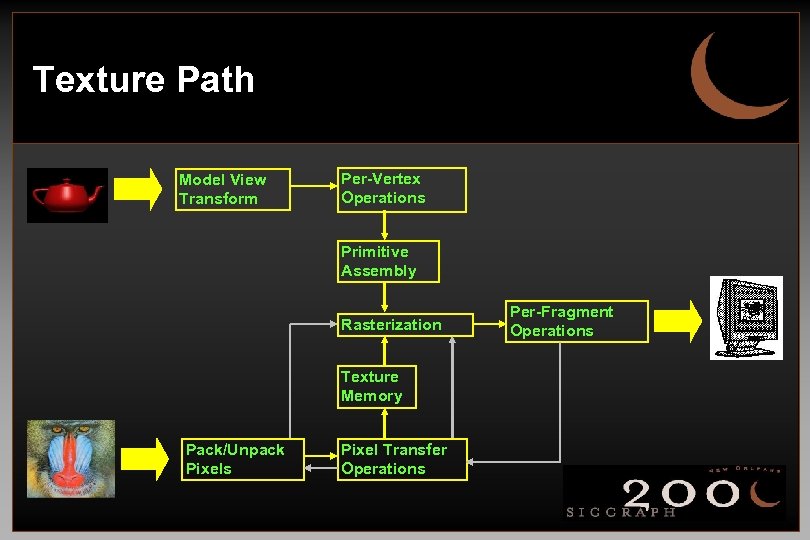 Texture Path Model View Transform Per-Vertex Operations Primitive Assembly Rasterization Texture Memory Pack/Unpack Pixels Pixel Transfer Operations Per-Fragment Operations
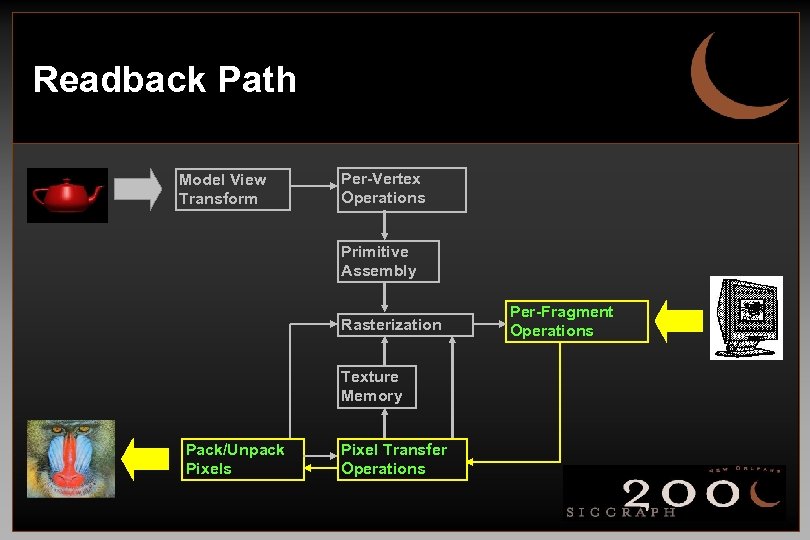 Readback Path Model View Transform Per-Vertex Operations Primitive Assembly Rasterization Texture Memory Pack/Unpack Pixels Pixel Transfer Operations Per-Fragment Operations
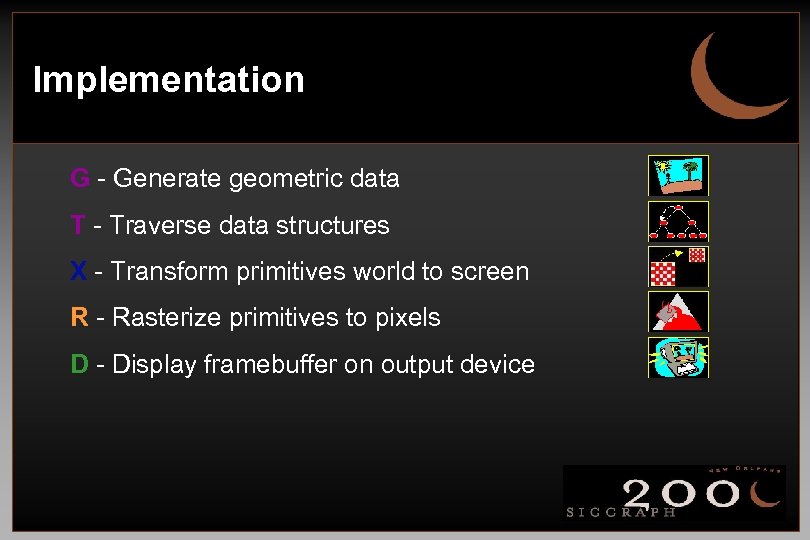 Implementation G - Generate geometric data T - Traverse data structures X - Transform primitives world to screen R - Rasterize primitives to pixels D - Display framebuffer on output device
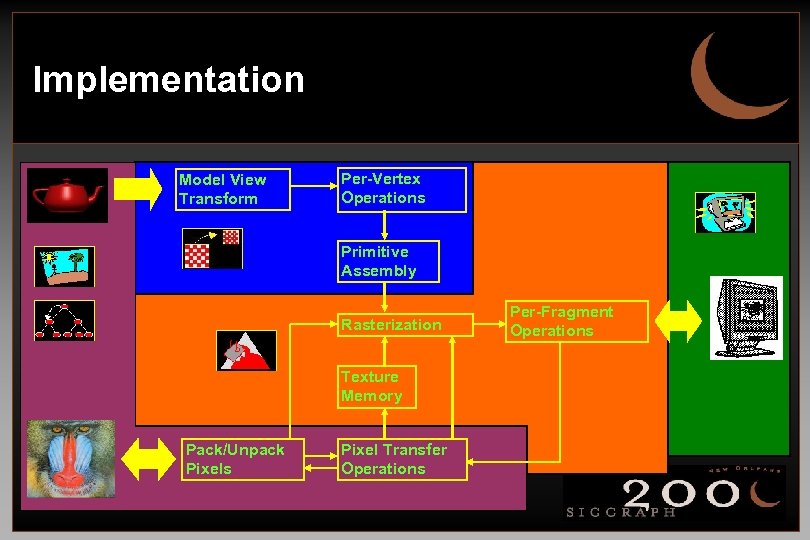 Implementation Model View Transform Per-Vertex Operations Primitive Assembly Rasterization Texture Memory Pack/Unpack Pixels Pixel Transfer Operations Per-Fragment Operations
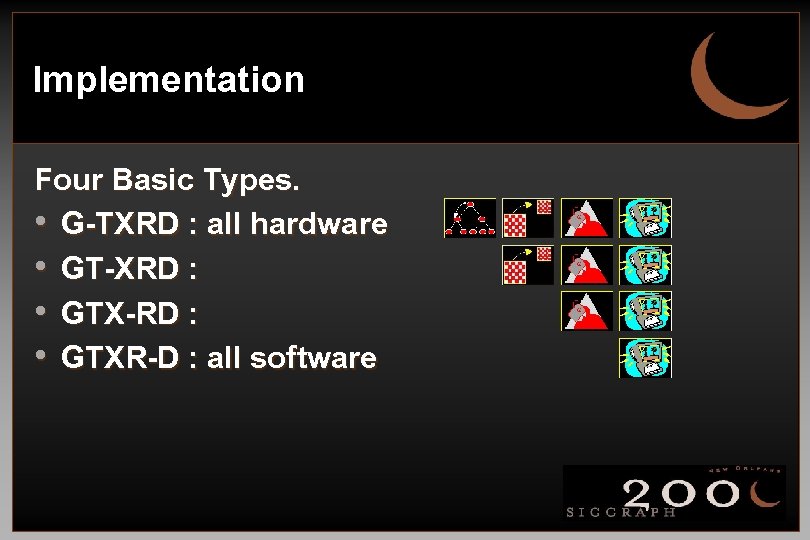 Implementation Four Basic Types. • G-TXRD : all hardware • GT-XRD : • GTX-RD : • GTXR-D : all software
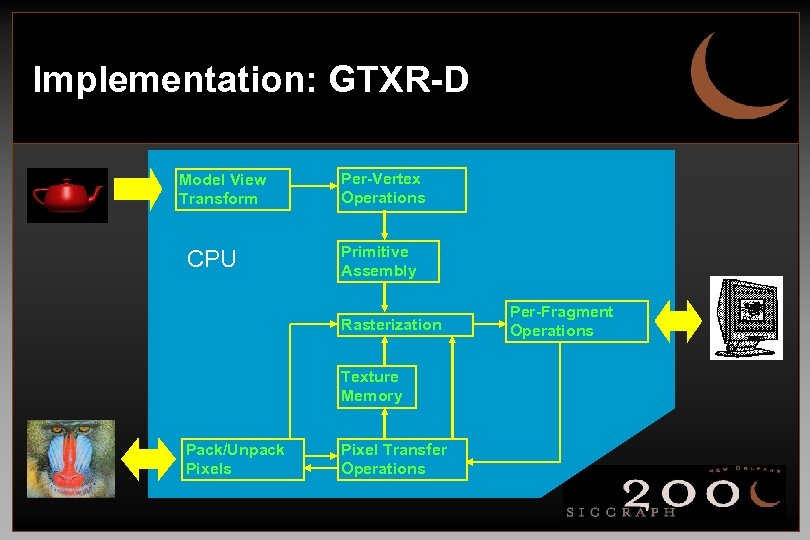 Implementation: GTXR-D Model View Transform CPU Per-Vertex Operations Primitive Assembly Rasterization Texture Memory Pack/Unpack Pixels Pixel Transfer Operations Per-Fragment Operations
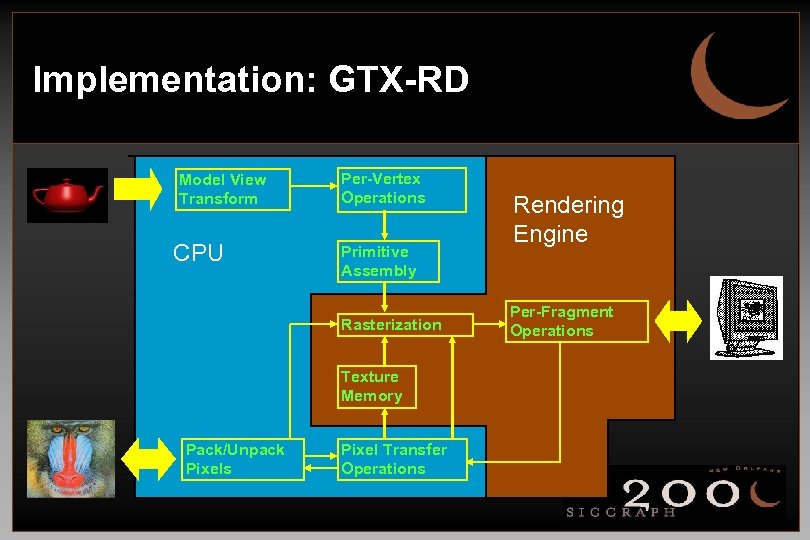 Implementation: GTX-RD Model View Transform CPU Per-Vertex Operations Primitive Assembly Rasterization Texture Memory Pack/Unpack Pixels Pixel Transfer Operations Rendering Engine Per-Fragment Operations
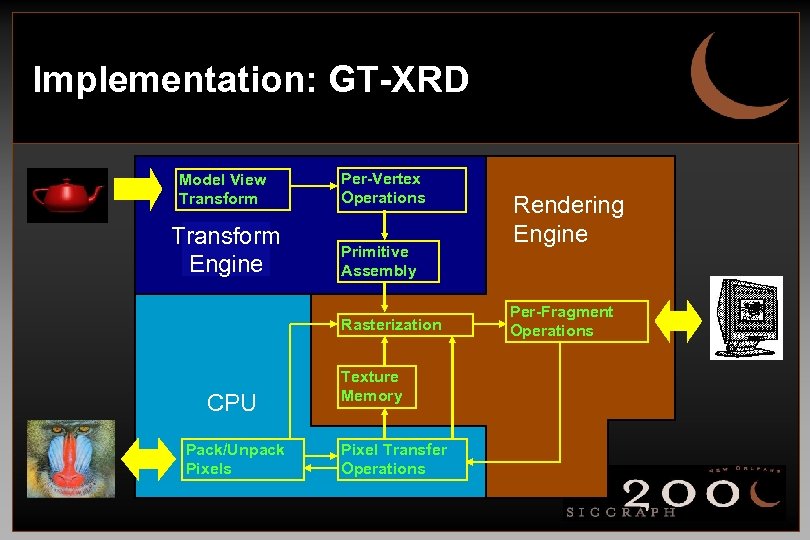 Implementation: GT-XRD Model View Transform Per-Vertex Operations Transform Engine Primitive Assembly Rasterization CPU Pack/Unpack Pixels Texture Memory Pixel Transfer Operations Rendering Engine Per-Fragment Operations
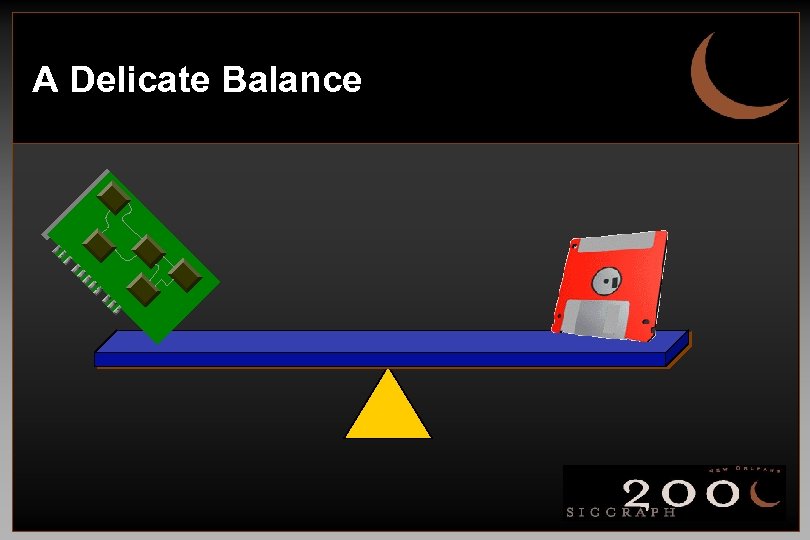 A Delicate Balance
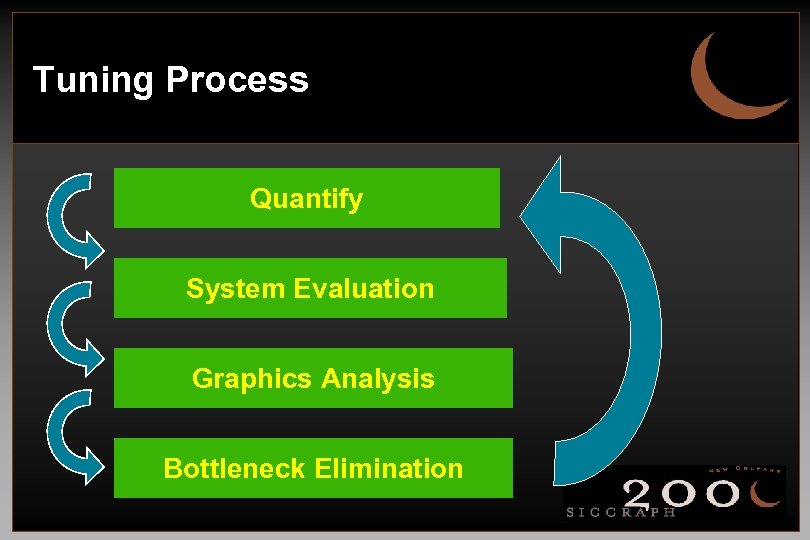 Tuning Process Quantify System Evaluation Graphics Analysis Bottleneck Elimination
 Quantify • Characterize • • • Application Space Primitive Types Primitive Counts Rendering Characteristics Frame Rate CAL
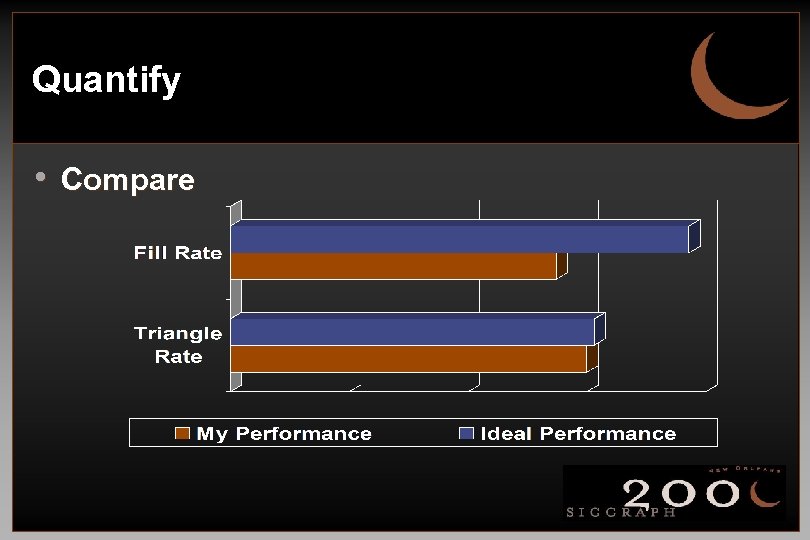 Quantify • Compare
 System Evaluation • • Physical memory. Disk bandwidth. Display configuration. Network characteristics.
 Graphics Analysis • Ideal Performance • Keep graphics pipeline full. • 100% CPU utilization running application code. • 100% graphics utilization.
 Graphics Analysis Graphics Bound • Graphics subsystem processes data slower • • than CPU can feed it. Graphics subsystem issues an interrupt which causes the CPU to stall. Data processing within application stops until graphics subsystem can again accept data.
 Graphics Analysis Graphics Bound CAL • Geometry Limited • Limited by the rate at which vertices can be transformed and clipped. • Fill Limited • Limited by the rate at which transformed vertices can be rasterized.
 Graphics Analysis CPU Bound • CPU at 100% utilization but can’t feed graphics • • fast enough. Graphics subsystem at less than 100% utilization. All CPU cycles consumed by data processing.
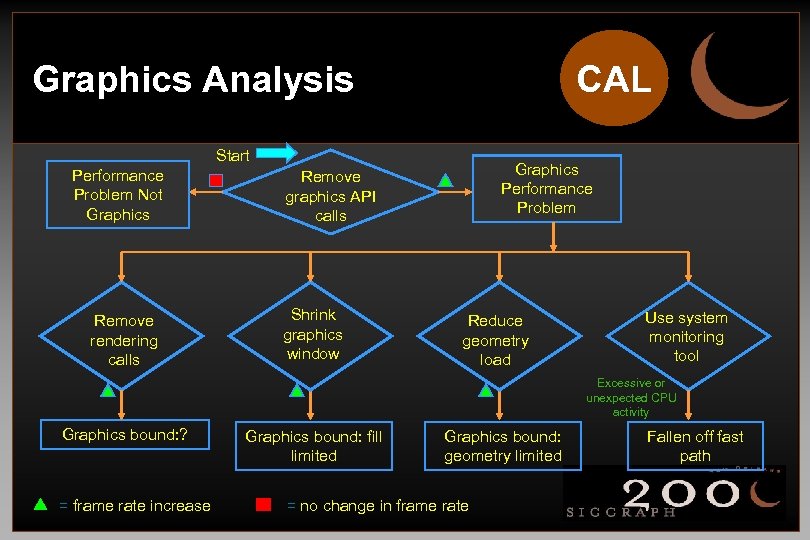 CAL Graphics Analysis Start Performance Problem Not Graphics Remove rendering calls Graphics Performance Problem Remove graphics API calls Shrink graphics window Reduce geometry load Use system monitoring tool Excessive or unexpected CPU activity Graphics bound: ? = frame rate increase Graphics bound: fill limited Graphics bound: geometry limited = no change in frame rate Fallen off fast path
 Graphics Analysis: GTXR-D (aka Dumb Frame Buffer) • • • CPU does everything. Typically CPU bound. To remedy, buy a “real” graphics board.
 Graphics Analysis: GTX-RD • • • Screen space operations performed by graphics. Object-space to screen-space transform on host. Can easily become CPU bound. “Roughly 100 single-precision floating point operations are required to transform, light, clip test, project and map an object-space vertex to screenspace. ” - K. Akeley & T. Jermoluk • Beware of fast-path and slow-path issues.
 Graphics Analysis: GTX-RD • If Graphics Bound: • Reduce per-pixel operations. • Reduce depth complexity. • Use native-format data.
 Graphics Analysis: GTX-RD • If CPU Bound: • Reduce scene complexity. • Use more efficient graphics algorithms.
 Graphics Analysis: GT-XRD • Transformations, lighting and rasterization • • • performed by graphics. Can be CPU or graphics bound. Beware of fast-path and slow-path issues. Subject to host bandwidth limitations.
 Graphics Analysis: GT-XRD • If Graphics Bound: • • Move lighting back to CPU. Use native data formats within application. Use display lists or vertex arrays. Use less expensive lighting modes.
 Graphics Analysis: GT-XRD • If CPU Bound: • Move lighting from CPU to graphics. • Do matrix operations in graphics hardware. • Profile in search of computational performance issues.
 Bottleneck Elimination • Bottlenecks • Understanding, crucial to effective tuning. • Will always exist, tune to balance. • Not always a bad thing.
 Bottleneck Elimination Graphics • • • Use native image formats. Remove excessive state changes. Avoid pipeline queries. Use texture cache efficiently. Disable unnecessary rendering features. Decrease scene complexity.
 Bottleneck Elimination Graphics • • • Use native image formats. Remove excessive state changes. Avoid pipeline queries. Use texture cache efficiently. Disable unnecessary rendering features. Decrease scene complexity.
 Bottleneck Elimination Graphics • • • Use native image formats. Remove excessive state changes. Avoid pipeline queries. Use texture cache efficiently. Disable unnecessary rendering features. Decrease scene complexity.
 Bottleneck Elimination Graphics • • • Use native image formats. Remove excessive state changes. Avoid pipeline queries. Use texture cache efficiently. Disable unnecessary rendering features. Decrease scene complexity.
 Bottleneck Elimination Graphics • • • Use native image formats. Remove excessive state changes. Avoid pipeline queries. Use texture cache efficiently. Disable unnecessary rendering features. Decrease scene complexity.
 Bottleneck Elimination Graphics • • • Use native image formats. Remove excessive state changes. Avoid pipeline queries. Use texture cache efficiently. Disable unnecessary rendering features. Decrease scene complexity.
 Bottleneck Elimination Code and Language • • Reduce API call overhead. Use native data types. Beware of contention for a single shared resource. Avoid application bottlenecks in non-graphics code.
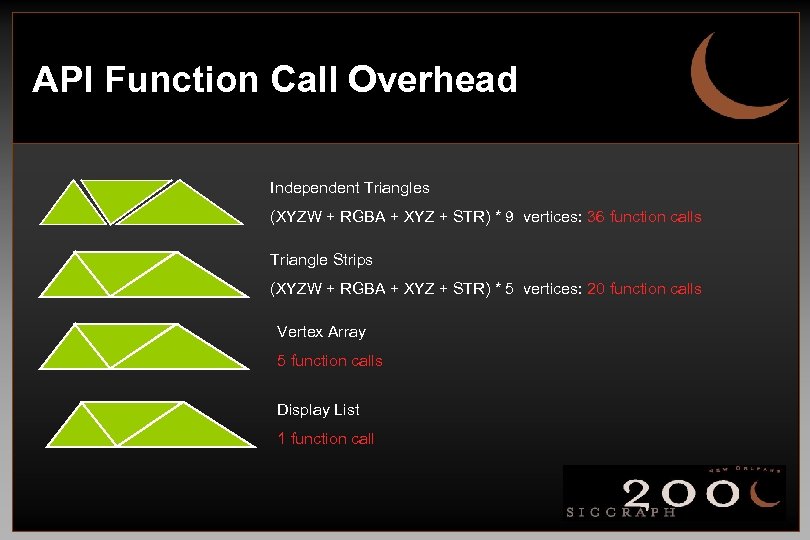 API Function Call Overhead Independent Triangles (XYZW + RGBA + XYZ + STR) * 9 vertices: 36 function calls Triangle Strips (XYZW + RGBA + XYZ + STR) * 5 vertices: 20 function calls Vertex Array 5 function calls Display List 1 function call
 Bottleneck Elimination Code and Language • • Reduce API call overhead. Use native data types. Beware of contention for a single shared resource. Avoid application bottlenecks in non-graphics code.
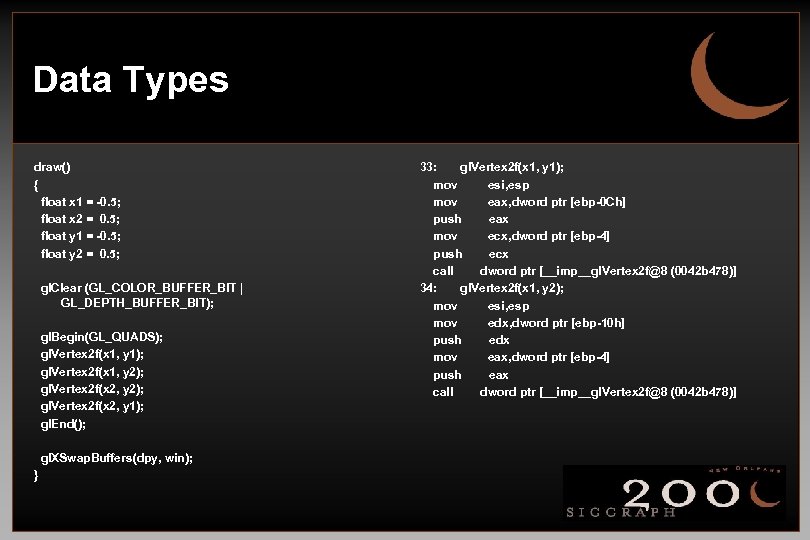 Data Types draw() { float x 1 = -0. 5; float x 2 = 0. 5; float y 1 = -0. 5; float y 2 = 0. 5; gl. Clear (GL_COLOR_BUFFER_BIT | GL_DEPTH_BUFFER_BIT); gl. Begin(GL_QUADS); gl. Vertex 2 f(x 1, y 1); gl. Vertex 2 f(x 1, y 2); gl. Vertex 2 f(x 2, y 1); gl. End(); gl. XSwap. Buffers(dpy, win); } 33: gl. Vertex 2 f(x 1, y 1); mov esi, esp mov eax, dword ptr [ebp-0 Ch] push eax mov ecx, dword ptr [ebp-4] push ecx call dword ptr [__imp__gl. Vertex 2 f@8 (0042 b 478)] 34: gl. Vertex 2 f(x 1, y 2); mov esi, esp mov edx, dword ptr [ebp-10 h] push edx mov eax, dword ptr [ebp-4] push eax call dword ptr [__imp__gl. Vertex 2 f@8 (0042 b 478)]
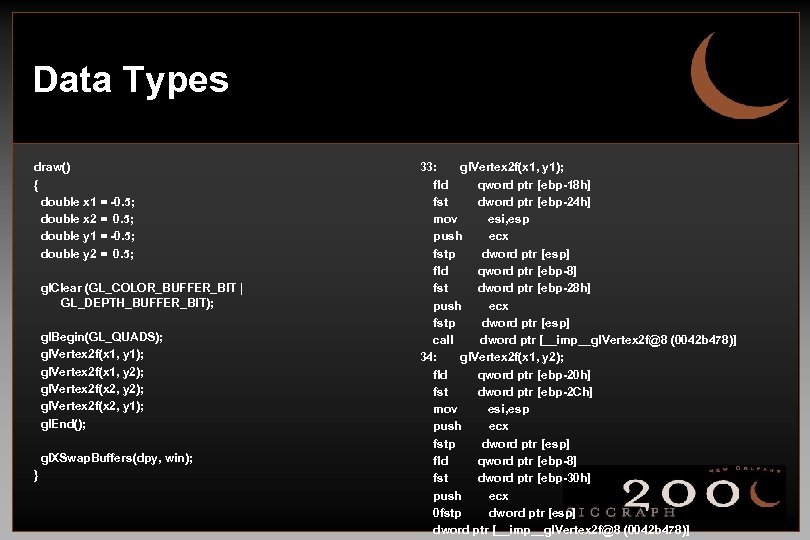 Data Types draw() { double x 1 = -0. 5; double x 2 = 0. 5; double y 1 = -0. 5; double y 2 = 0. 5; gl. Clear (GL_COLOR_BUFFER_BIT | GL_DEPTH_BUFFER_BIT); gl. Begin(GL_QUADS); gl. Vertex 2 f(x 1, y 1); gl. Vertex 2 f(x 1, y 2); gl. Vertex 2 f(x 2, y 1); gl. End(); gl. XSwap. Buffers(dpy, win); } 33: gl. Vertex 2 f(x 1, y 1); fld qword ptr [ebp-18 h] fst dword ptr [ebp-24 h] mov esi, esp push ecx fstp dword ptr [esp] fld qword ptr [ebp-8] fst dword ptr [ebp-28 h] push ecx fstp dword ptr [esp] call dword ptr [__imp__gl. Vertex 2 f@8 (0042 b 478)] 34: gl. Vertex 2 f(x 1, y 2); fld qword ptr [ebp-20 h] fst dword ptr [ebp-2 Ch] mov esi, esp push ecx fstp dword ptr [esp] fld qword ptr [ebp-8] fst dword ptr [ebp-30 h] push ecx 0 fstp dword ptr [esp] dword ptr [__imp__gl. Vertex 2 f@8 (0042 b 478)]
 Bottleneck Elimination Code and Language • Reduce API call overhead. • Use native data types. • Beware of contention for a single shared • resource. Avoid application bottlenecks in non-graphics code.
 Bottleneck Elimination Code and Language • • Reduce API call overhead. Use native data types. Beware of contention for a single shared resource. Avoid application bottlenecks in non-graphics code.
 Bottleneck Elimination Memory • • • Don’t allocate memory in rendering loop. Avoid copying and repackaging of graphics data. Organize graphics data to maximize bandwidth and avoid fragmentation.
 Bottleneck Elimination Memory • • • Don’t allocate memory in rendering loop. Avoid copying and repackaging of graphics data. Organize graphics data to maximize bandwidth and avoid fragmentation.
 Bottleneck Elimination Memory • Don’t allocate memory in rendering loop. • Avoid copying and repackaging of graphics data. • Organize graphics data to maximize bandwidth and avoid fragmentation.
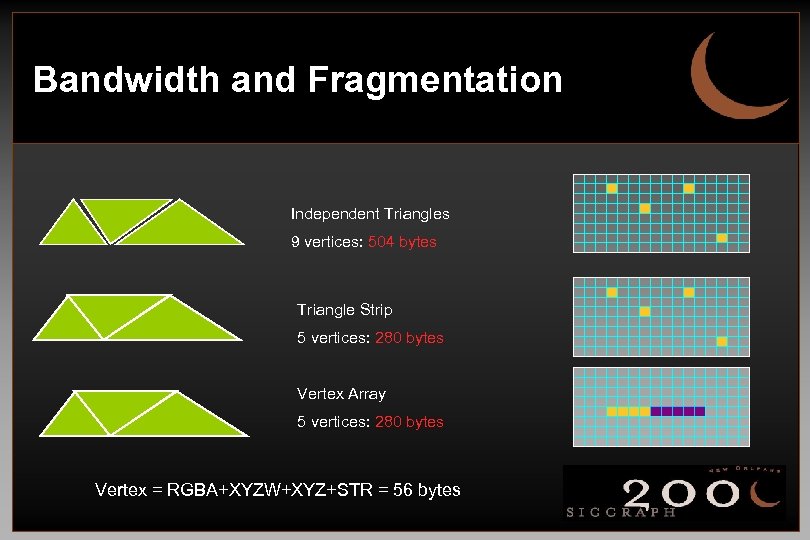 Bandwidth and Fragmentation Independent Triangles 9 vertices: 504 bytes Triangle Strip 5 vertices: 280 bytes Vertex Array 5 vertices: 280 bytes Vertex = RGBA+XYZW+XYZ+STR = 56 bytes
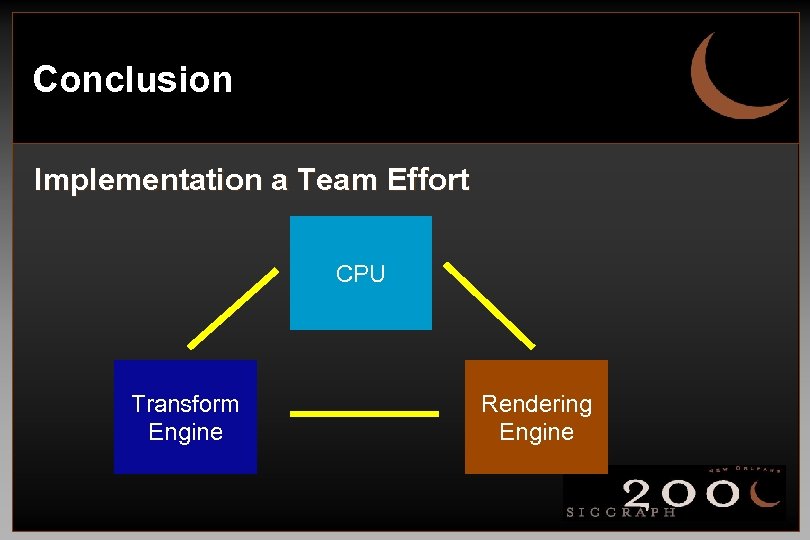 Conclusion Implementation a Team Effort CPU Transform Engine Rendering Engine
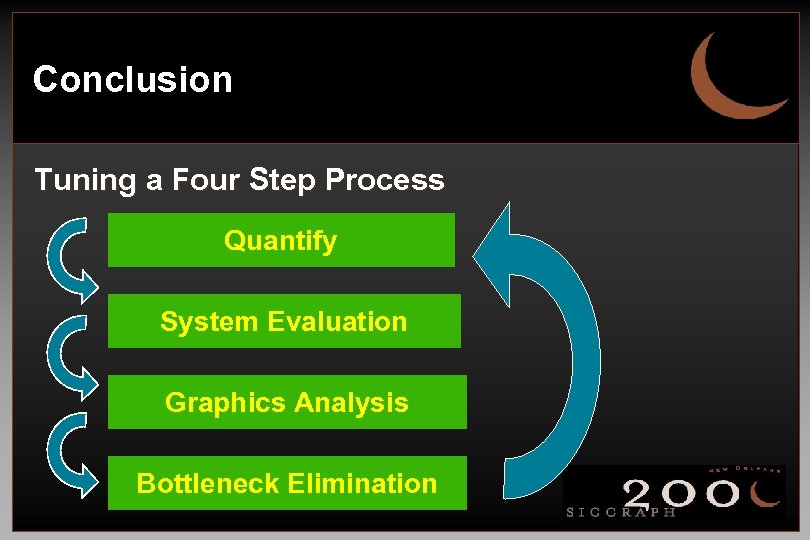 Conclusion Tuning a Four Step Process Quantify System Evaluation Graphics Analysis Bottleneck Elimination
 Conclusion It’s all about balance!
 Profiling and Performance Analysis Keith Cok, SGI
 Profile and Performance Analysis • Profiling points out code areas that take up most time • Imperative for well balanced application • Points out code and system bottlenecks
 Two Methods of Software Profiling • Basic block • a section of code that has one entry and one exit • measures ideal time • Statistical sampling • interrupts program execution and examines current location • measures actual CPU cycles spent executing a line of code
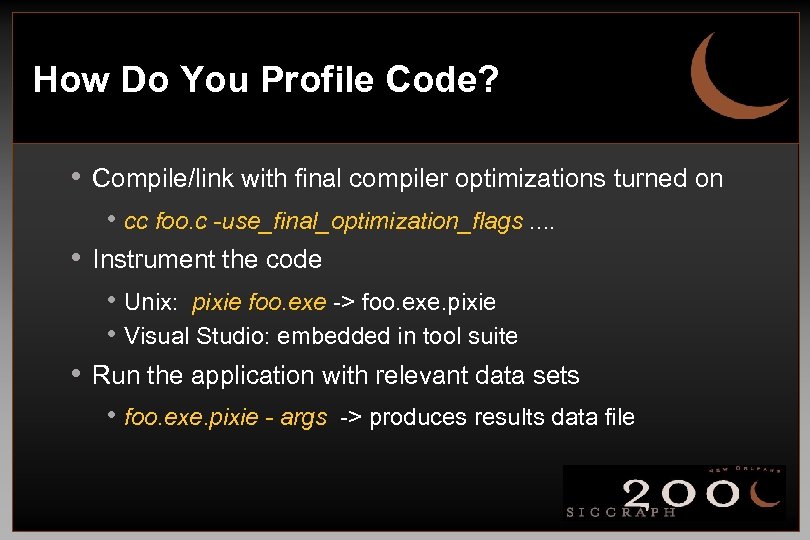 How Do You Profile Code? • Compile/link with final compiler optimizations turned on • cc foo. c -use_final_optimization_flags. . • Instrument the code • Unix: pixie foo. exe -> foo. exe. pixie • Visual Studio: embedded in tool suite • Run the application with relevant data sets • foo. exe. pixie - args -> produces results data file
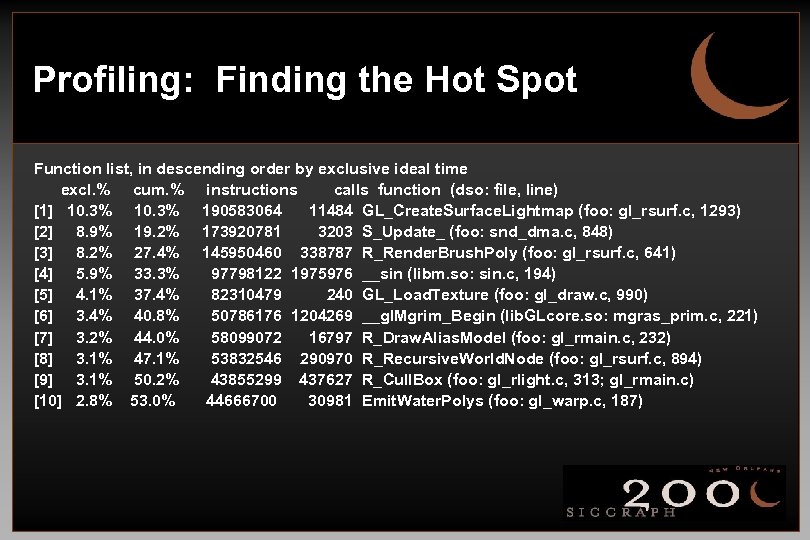 Profiling: Finding the Hot Spot Function list, in descending order by exclusive ideal time excl. % cum. % instructions calls function (dso: file, line) [1] 10. 3% 190583064 11484 GL_Create. Surface. Lightmap (foo: gl_rsurf. c, 1293) [2] 8. 9% 19. 2% 173920781 3203 S_Update_ (foo: snd_dma. c, 848) [3] 8. 2% 27. 4% 145950460 338787 R_Render. Brush. Poly (foo: gl_rsurf. c, 641) [4] 5. 9% 33. 3% 97798122 1975976 __sin (libm. so: sin. c, 194) [5] 4. 1% 37. 4% 82310479 240 GL_Load. Texture (foo: gl_draw. c, 990) [6] 3. 4% 40. 8% 50786176 1204269 __gl. Mgrim_Begin (lib. GLcore. so: mgras_prim. c, 221) [7] 3. 2% 44. 0% 58099072 16797 R_Draw. Alias. Model (foo: gl_rmain. c, 232) [8] 3. 1% 47. 1% 53832546 290970 R_Recursive. World. Node (foo: gl_rsurf. c, 894) [9] 3. 1% 50. 2% 43855299 437627 R_Cull. Box (foo: gl_rlight. c, 313; gl_rmain. c) [10] 2. 8% 53. 0% 44666700 30981 Emit. Water. Polys (foo: gl_warp. c, 187)
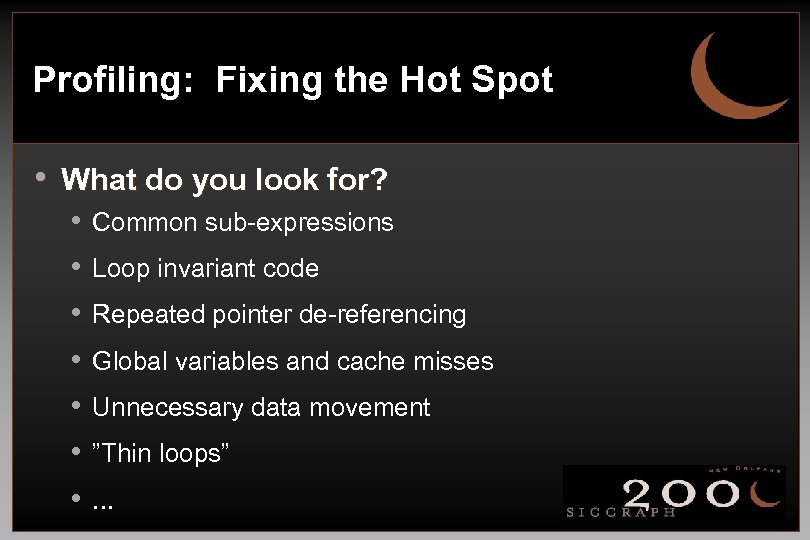 Profiling: Fixing the Hot Spot • What do you look for? • • Common sub-expressions Loop invariant code Repeated pointer de-referencing Global variables and cache misses Unnecessary data movement ”Thin loops”. . .
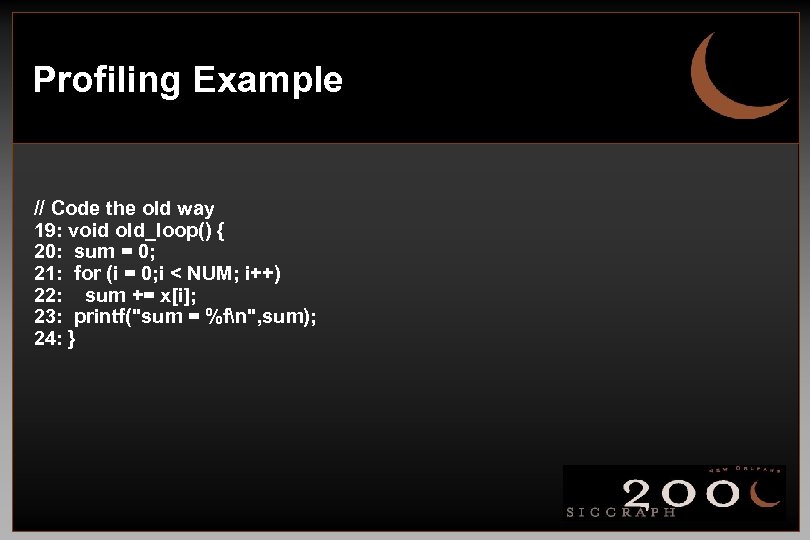 Profiling Example // Code the old way 19: void old_loop() { 20: sum = 0; 21: for (i = 0; i < NUM; i++) 22: sum += x[i]; 23: printf("sum = %fn", sum); 24: }
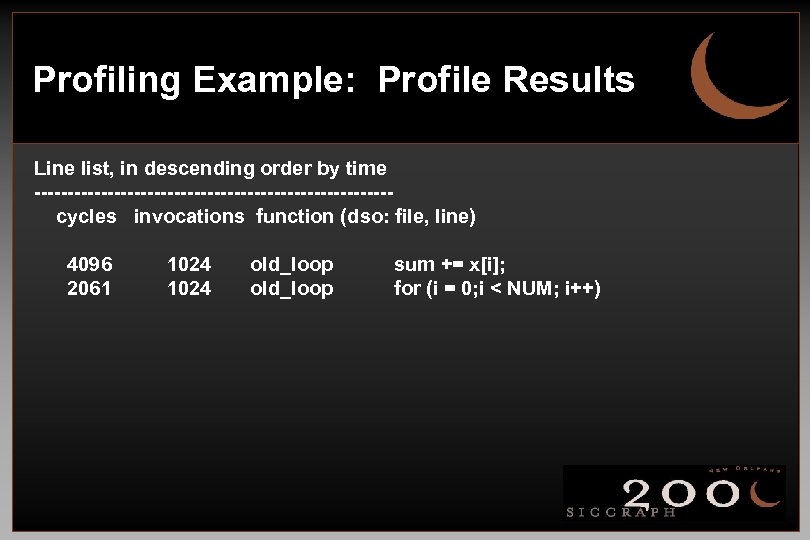 Profiling Example: Profile Results Line list, in descending order by time ---------------------------cycles invocations function (dso: file, line) 4096 2061 1024 old_loop sum += x[i]; for (i = 0; i < NUM; i++)
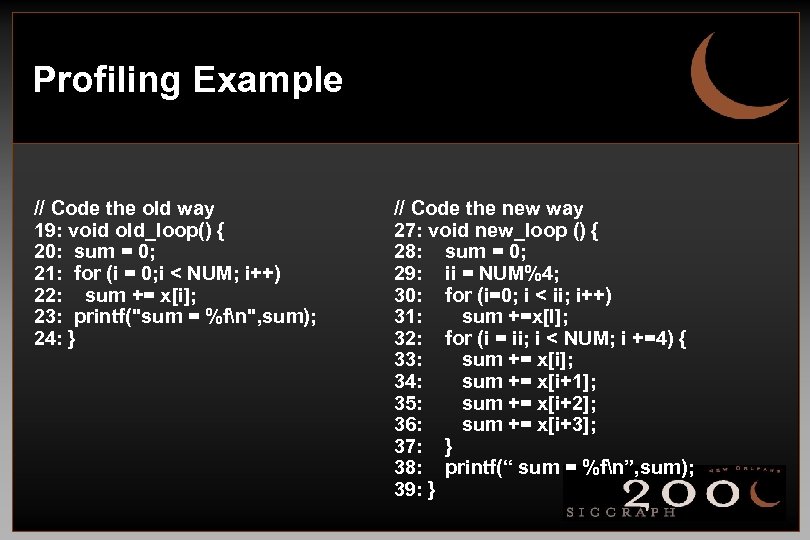 Profiling Example // Code the old way 19: void old_loop() { 20: sum = 0; 21: for (i = 0; i < NUM; i++) 22: sum += x[i]; 23: printf("sum = %fn", sum); 24: } // Code the new way 27: void new_loop () { 28: sum = 0; 29: ii = NUM%4; 30: for (i=0; i < ii; i++) 31: sum +=x[I]; 32: for (i = ii; i < NUM; i +=4) { 33: sum += x[i]; 34: sum += x[i+1]; 35: sum += x[i+2]; 36: sum += x[i+3]; 37: } 38: printf(“ sum = %fn”, sum); 39: }
![Profiling Example: Profile Results Old_loop: cycles instructions [1] 6160 6168 [2] 4869 8714 calls Profiling Example: Profile Results Old_loop: cycles instructions [1] 6160 6168 [2] 4869 8714 calls](https://present5.com/presentation/6c00e68d6f8ccb1da1a67693b4ffcf23/image-64.jpg) Profiling Example: Profile Results Old_loop: cycles instructions [1] 6160 6168 [2] 4869 8714 calls 1 1 function (dso: file: line) old_loop (blahdso. so: blahdso. c, 19) setup_data (blahdso. so: blahdso. c, 11) New_loop: [1] 4869 8714 1 setup_data (blahdso. so: blahdso. c, 11) [2] 4891 1 new_loop 4625 (blahdso. so: blahdso. c, 27)
Profiling Example: Profile Results Old_loop: cycles instructions [1] 6160 6168 [2] 4869 8714 calls 1 1 function (dso: file: line) old_loop (blahdso. so: blahdso. c, 19) setup_data (blahdso. so: blahdso. c, 11) New_loop: [1] 4869 8714 1 setup_data (blahdso. so: blahdso. c, 11) [2] 4891 1 new_loop 4625 (blahdso. so: blahdso. c, 27)
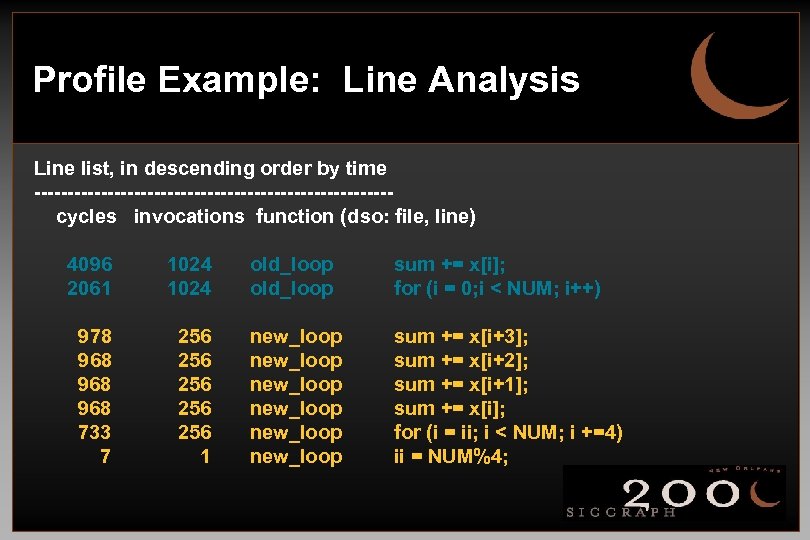 Profile Example: Line Analysis Line list, in descending order by time ---------------------------cycles invocations function (dso: file, line) 4096 2061 1024 old_loop sum += x[i]; for (i = 0; i < NUM; i++) 978 968 968 733 7 256 256 256 1 new_loop new_loop sum += x[i+3]; sum += x[i+2]; sum += x[i+1]; sum += x[i]; for (i = ii; i < NUM; i +=4) ii = NUM%4;
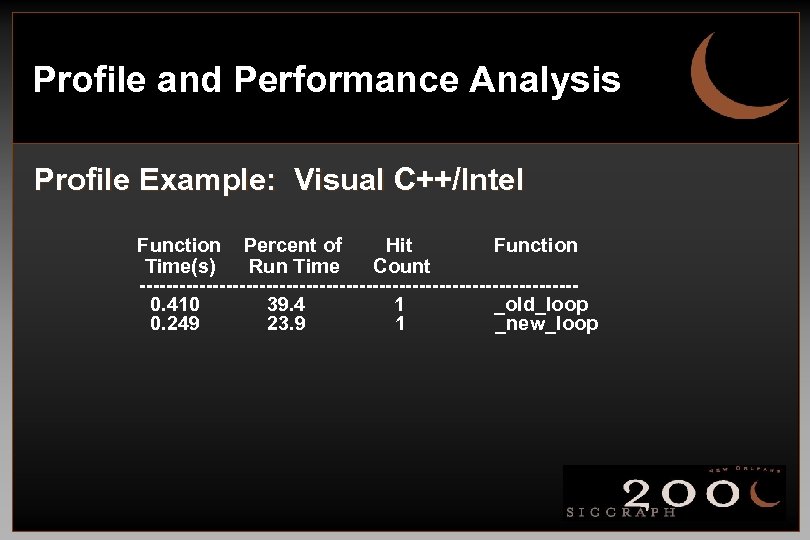 Profile and Performance Analysis Profile Example: Visual C++/Intel Function Percent of Hit Function Time(s) Run Time Count ---------------------------------0. 410 39. 4 1 _old_loop 0. 249 23. 9 1 _new_loop
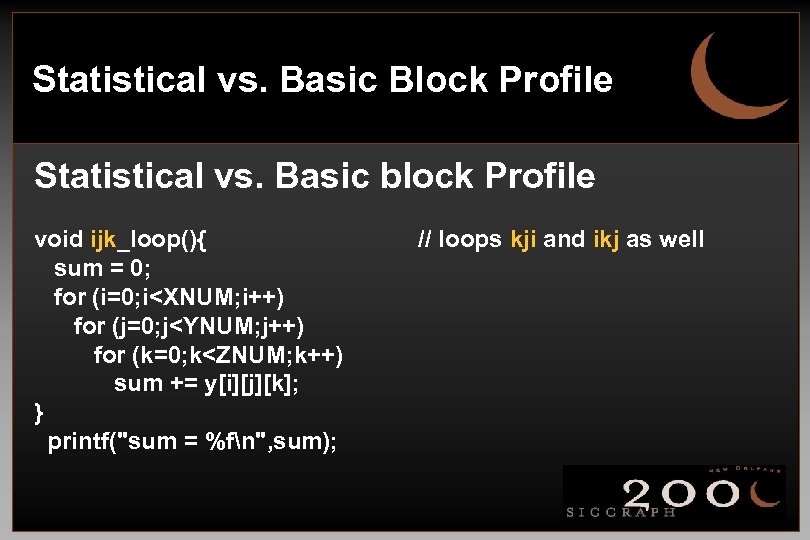 Statistical vs. Basic Block Profile Statistical vs. Basic block Profile void ijk_loop(){ sum = 0; for (i=0; i
![Basic Block vs. Statistical Sampling Basic Block: Percent [1] 25. 3% [2] 25. 3% Basic Block vs. Statistical Sampling Basic Block: Percent [1] 25. 3% [2] 25. 3%](https://present5.com/presentation/6c00e68d6f8ccb1da1a67693b4ffcf23/image-68.jpg) Basic Block vs. Statistical Sampling Basic Block: Percent [1] 25. 3% [2] 25. 3% [3] 25. 3% cycles 51141434 Statistical Sampling: Percent Samples [1] 38. 0% 2700 [2] 23. 9% 1700 [3] 19. 7% 1400 [4] 18. 3% 1300 inst calls function 37101028 1 ijk_loop foo. c, 47 37101028 1 kji_loop foo. c, 57 37101028 1 ikj_loop foo. c, 66 Procedure kji_loop setup_data ikj_loop ijk_loop Function foo. c, 57 foo. c, 15 foo. c, 66 foo. c, 47
Basic Block vs. Statistical Sampling Basic Block: Percent [1] 25. 3% [2] 25. 3% [3] 25. 3% cycles 51141434 Statistical Sampling: Percent Samples [1] 38. 0% 2700 [2] 23. 9% 1700 [3] 19. 7% 1400 [4] 18. 3% 1300 inst calls function 37101028 1 ijk_loop foo. c, 47 37101028 1 kji_loop foo. c, 57 37101028 1 ikj_loop foo. c, 66 Procedure kji_loop setup_data ikj_loop ijk_loop Function foo. c, 57 foo. c, 15 foo. c, 66 foo. c, 47
 Now We Know About Hot Spots. . . • What do we do next? • Use compilers to fine-tune code • Use knowledge of language to optimize • Hand-tune code • Profiling is fun, hard, and iterative…. And it can be highly effective
 Compiler and Language Issues Keith Cok, SGI Bob Kuehne, SGI
 Compiler and Language Issues • Compiler Optimizations: • Occur within a compromise of speed and memory space vs. time to compile and link • An iterative process discovering what works/doesn't work • Important to work at it
 Compiler Issues: Trade-Offs • Trade-offs: • • Round-off vs. needed precision Inter-procedural analysis vs. link time Pointer aliasing vs. coding constraints Optimizing for processor architectures vs. work of multiple binaries (support, test) • Explore other compilers than your first choice
 Compiler and Language Issues • Comments on 32 vs. 64 bit code • Benefits of 64 bit code: • Increased address space • Downsides of 64 bit code: • Memory space will increase • The port can be difficult! • Open. GL is float, not double based • Performance issues
 Language Issue • Data Management • Unrolling loops • Arrays • Temporary variables • Pointer aliasing • Software Pipelining
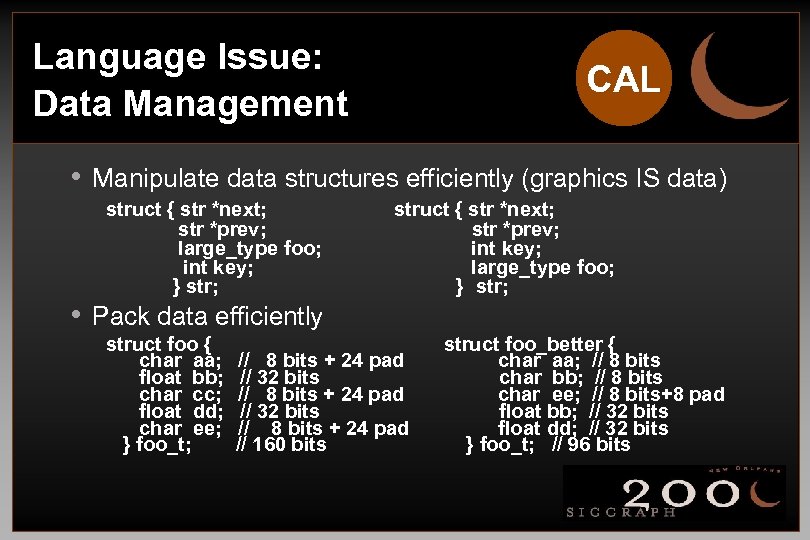 Language Issue: Data Management CAL • Manipulate data structures efficiently (graphics IS data) struct { str *next; str *prev; large_type foo; int key; } str; • Pack data efficiently struct foo { char aa; float bb; char cc; float dd; char ee; } foo_t; struct { str *next; str *prev; int key; large_type foo; } str; // 8 bits + 24 pad // 32 bits // 8 bits + 24 pad // 160 bits struct foo_better { char aa; // 8 bits char bb; // 8 bits char ee; // 8 bits+8 pad float bb; // 32 bits float dd; // 32 bits } foo_t; // 96 bits
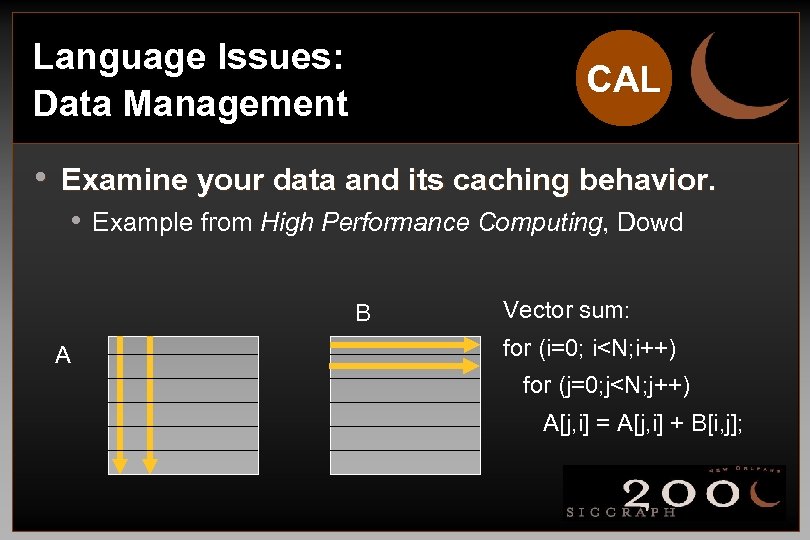 Language Issues: Data Management CAL • Examine your data and its caching behavior. • Example from High Performance Computing, Dowd B A Vector sum: for (i=0; i
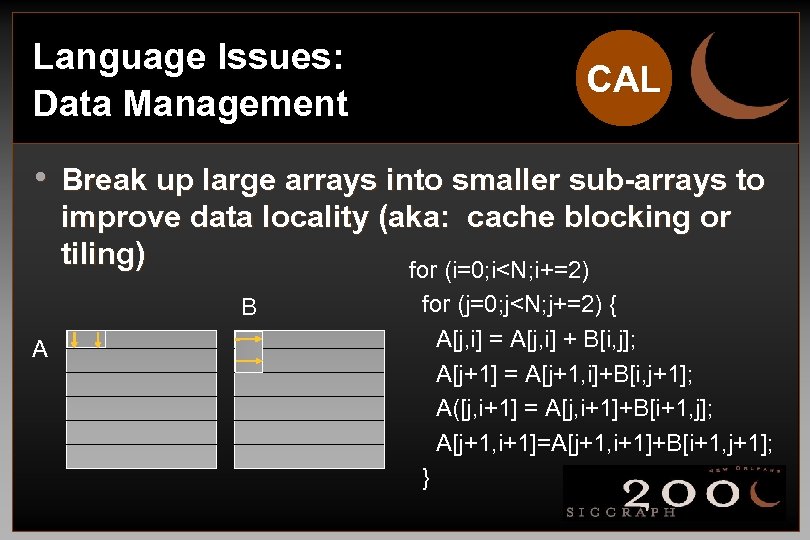 Language Issues: Data Management CAL • Break up large arrays into smaller sub-arrays to improve data locality (aka: cache blocking or tiling) for (i=0; i
 Language Issues: Loop Unrolling • Issues with loop unrolling • • Code complexity Clutter Compiler may do this Flags may affect compiler time spent optimizing • Only “thin” loops gain performance
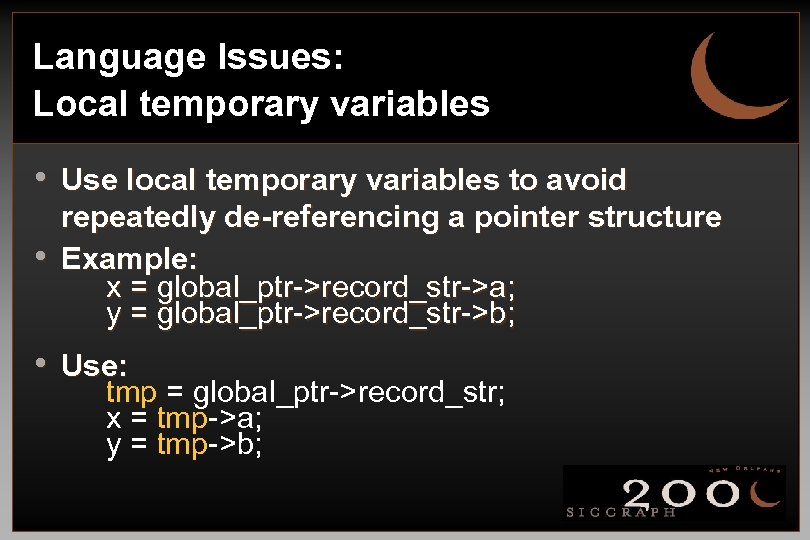 Language Issues: Local temporary variables • Use local temporary variables to avoid • repeatedly de-referencing a pointer structure Example: x = global_ptr->record_str->a; y = global_ptr->record_str->b; • Use: tmp = global_ptr->record_str; x = tmp->a; y = tmp->b;
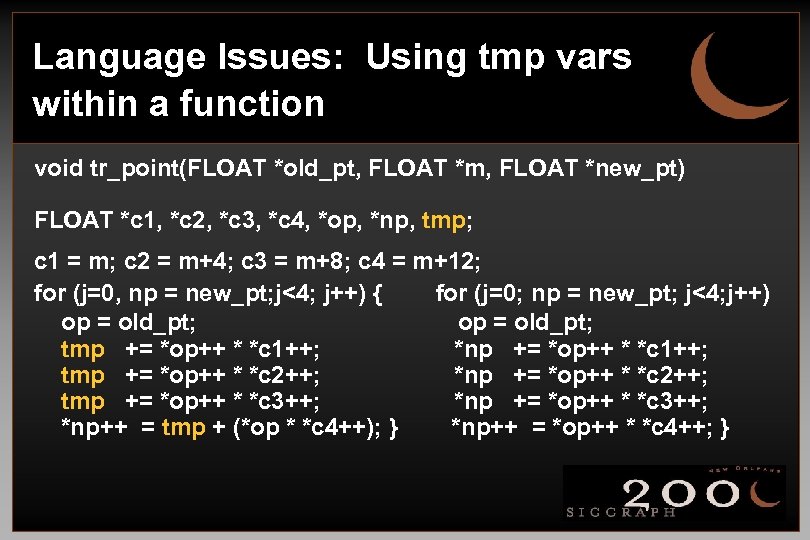 Language Issues: Using tmp vars within a function void tr_point(FLOAT *old_pt, FLOAT *m, FLOAT *new_pt) FLOAT *c 1, *c 2, *c 3, *c 4, *op, *np, tmp; c 1 = m; c 2 = m+4; c 3 = m+8; c 4 = m+12; for (j=0, np = new_pt; j<4; j++) { for (j=0; np = new_pt; j<4; j++) op = old_pt; tmp += *op++ * *c 1++; *np += *op++ * *c 1++; tmp += *op++ * *c 2++; *np += *op++ * *c 2++; tmp += *op++ * *c 3++; *np++ = tmp + (*op * *c 4++); } *np++ = *op++ * *c 4++; }
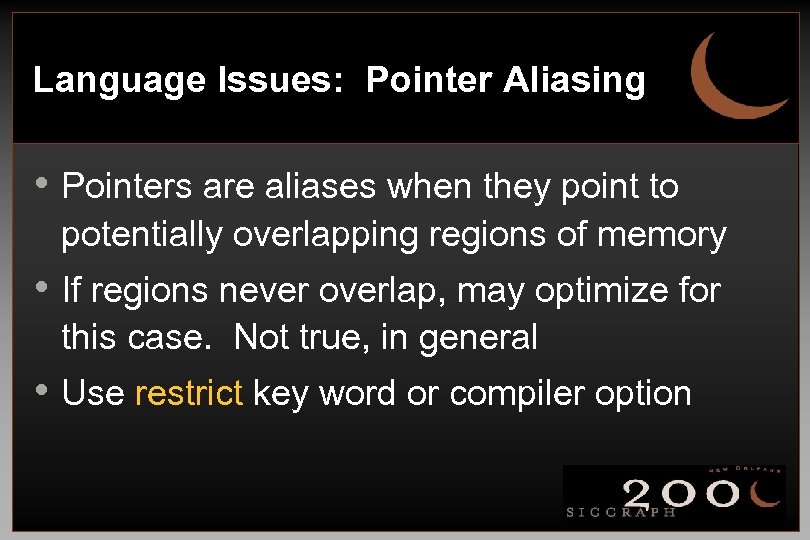 Language Issues: Pointer Aliasing • Pointers are aliases when they point to potentially overlapping regions of memory • If regions never overlap, may optimize for this case. Not true, in general • Use restrict key word or compiler option
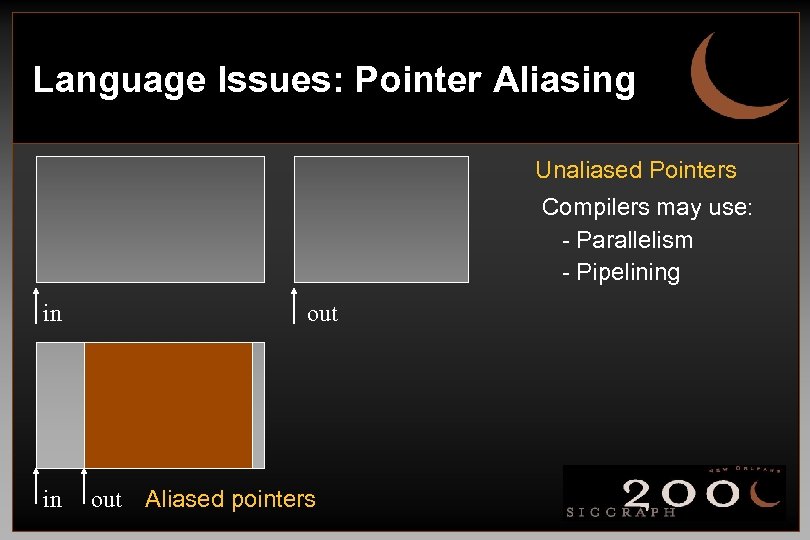 Language Issues: Pointer Aliasing Unaliased Pointers Compilers may use: - Parallelism - Pipelining in in out Aliased pointers
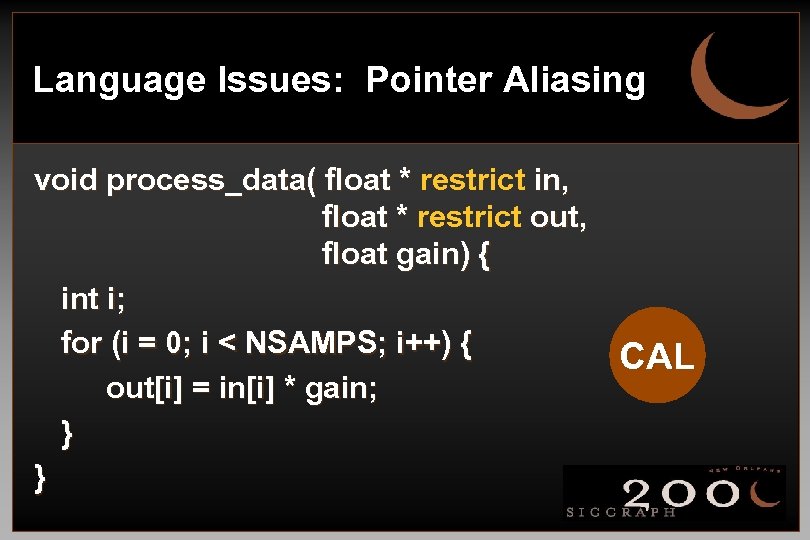 Language Issues: Pointer Aliasing void process_data( float * restrict in, float * restrict out, float gain) { int i; for (i = 0; i < NSAMPS; i++) { out[i] = in[i] * gain; } } CAL
 Language Issues: Software Pipelining • Compiler restructures statements within body of loop so that one • iteration of loop can start before prior iteration finishes Help your compiler: • Works on inner loops • No conditionals or function calls • Loop too small? (unrolling may help) • Potential for aliasing may prevent pipelining • Only some CPU’s/compilers do this (IA 64, MIPS, PA 8000, …)
 Language Issues: Code Parallelization • Algorithm or application dependent • Data/Computational code • No graphics code (typically one graphics pipeline) • Difficult but rewarding • Open. MP simplifies life tremendously • directive-based parallelizing optimization API for SMP • (www. openmp. org)
 C++: General Issues • Language features • RTTI, safe casts, etc. • Use const, mutable, volatile, & inline • hints to compilers • Object construction • arrays, default constructors, arguments, etc. • Method invocation issues • operators, overloads, conversion, etc.
 C++: Virtual Functions • Good - used to invoke child method when managing baseclass handles • Expensive - incur an additional pointer de-reference • one, find VTBL, two, find method, invoke • bad for caching • Use when necessary, but not for common objects • Good for ‘large’ methods that do lots of work • Bad for ‘small’ methods, like a vertex query
 C++: Exceptions & Templates • Exceptions • Great for error checking • Performance penalty • Additional stack information required • Templates • Great for code re-use • Memory penalty • Across libraries, across object files
 Code & Language Issues: The End • Balance • Know your compiler • Features & performance • Know your language • Features & performance • Know your app • Features & performance


