aec8c17ad9e28048fe17756469178b39.ppt
- Количество слайдов: 72

Debugging Techniques Ted Baker Andy Wang COP 5641 / CIS 4930
Overview n n n Several tools are available Some are more difficult to set up and learn All of them have inherent limitations n n Intrusive, may change the kernel behavior Kernel might crash the tool
Debugging Support in the Kernel n Under the “kernel hacking” menu n n CONFIG_DEBUG_KERNEL n n Not supported by all architectures Enables other debugging features CONFIG_DEBUG_SLAB n Checks kernel memory allocation functions n n Memory overrun Missing initialization
Debugging Support in the Kernel n CONFIG_DEBUG_PAGEALLOC n n Pages are removed from the kernel address space when freed CONFIG_DEBUG_SPINLOCK n Catches operations on uninitialized spinlocks and double unlocking
Debugging Support in the Kernel n CONFIG_DEBUG_SPINLOCK_SLEEP n n CONFIG_INIT_DEBUG n n Checks for attempts to sleep while holding a spinlock Checks for attempts to access initializationtime memory CONFIG_DEBUG_INFO n Enables gdb debugging
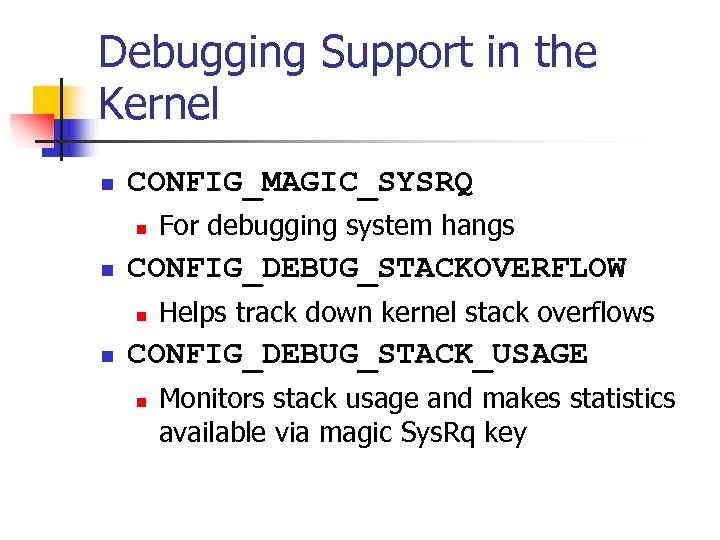
Debugging Support in the Kernel n CONFIG_MAGIC_SYSRQ n n CONFIG_DEBUG_STACKOVERFLOW n n For debugging system hangs Helps track down kernel stack overflows CONFIG_DEBUG_STACK_USAGE n Monitors stack usage and makes statistics available via magic Sys. Rq key
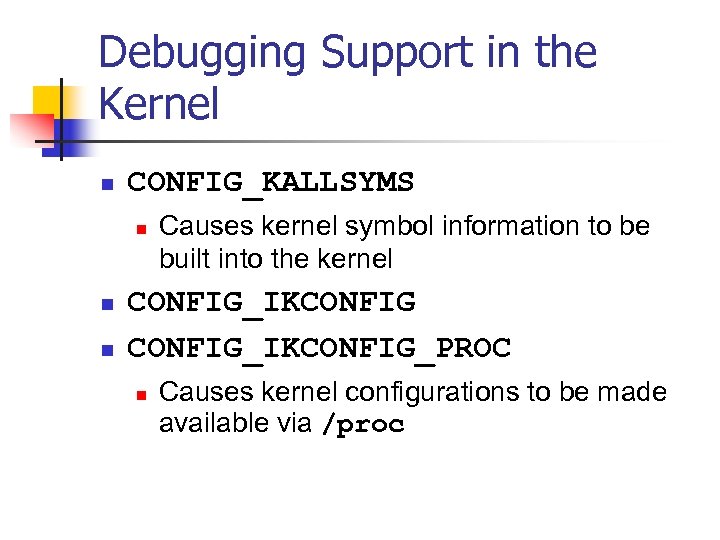
Debugging Support in the Kernel n CONFIG_KALLSYMS n n n Causes kernel symbol information to be built into the kernel CONFIG_IKCONFIG_PROC n Causes kernel configurations to be made available via /proc
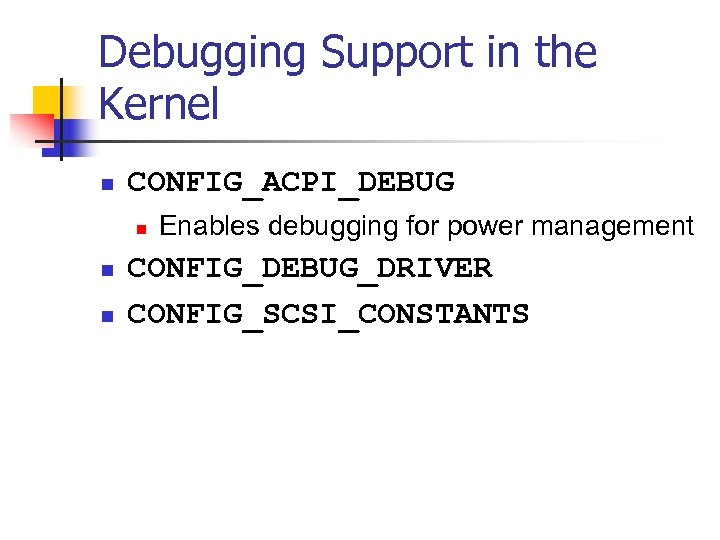
Debugging Support in the Kernel n CONFIG_ACPI_DEBUG n n n Enables debugging for power management CONFIG_DEBUG_DRIVER CONFIG_SCSI_CONSTANTS

Debugging Support in the Kernel n CONFIG_INPUT_DEBUG n n Turns on verbose logging of input events CONFIG_PROFILING n For performance tuning
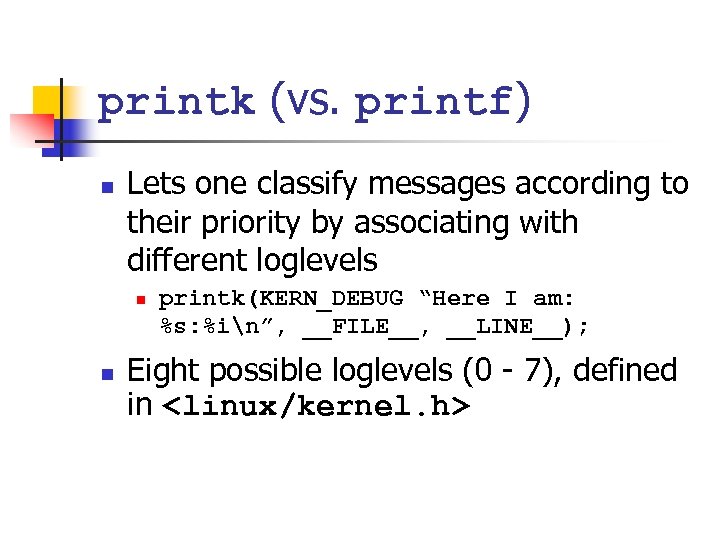
printk (vs. printf) n Lets one classify messages according to their priority by associating with different loglevels n n printk(KERN_DEBUG “Here I am: %s: %in”, __FILE__, __LINE__); Eight possible loglevels (0 - 7), defined in <linux/kernel. h>
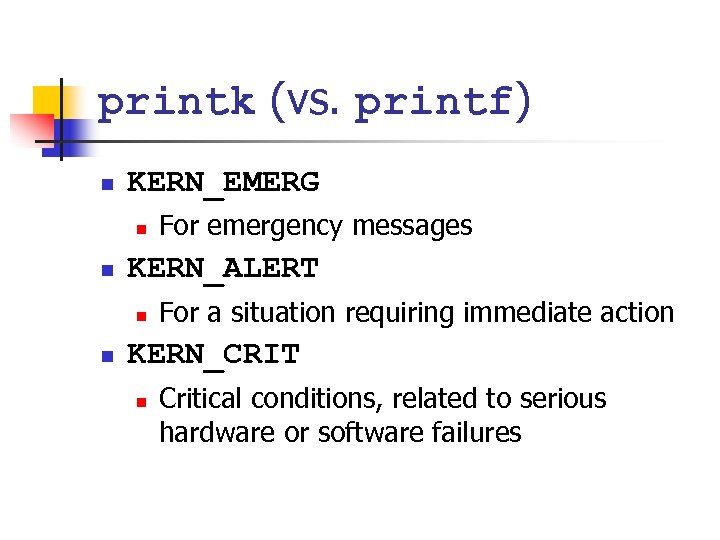
printk (vs. printf) n KERN_EMERG n n KERN_ALERT n n For emergency messages For a situation requiring immediate action KERN_CRIT n Critical conditions, related to serious hardware or software failures
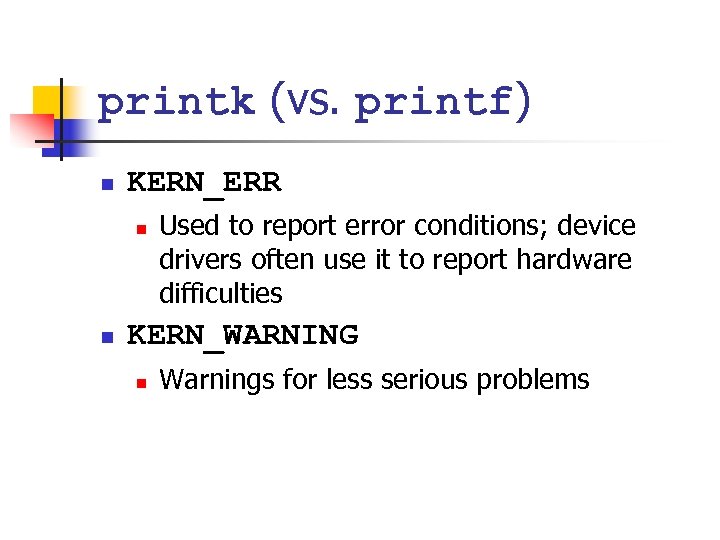
printk (vs. printf) n KERN_ERR n n Used to report error conditions; device drivers often use it to report hardware difficulties KERN_WARNING n Warnings for less serious problems
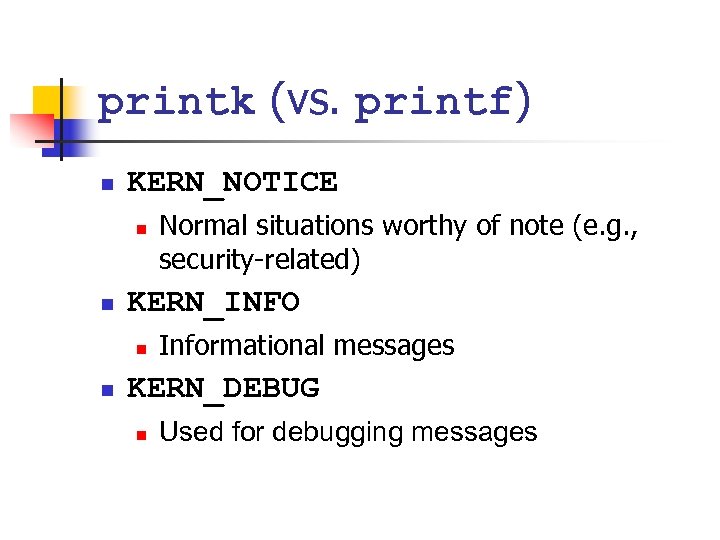
printk (vs. printf) n KERN_NOTICE n n KERN_INFO n n Normal situations worthy of note (e. g. , security-related) Informational messages KERN_DEBUG n Used for debugging messages
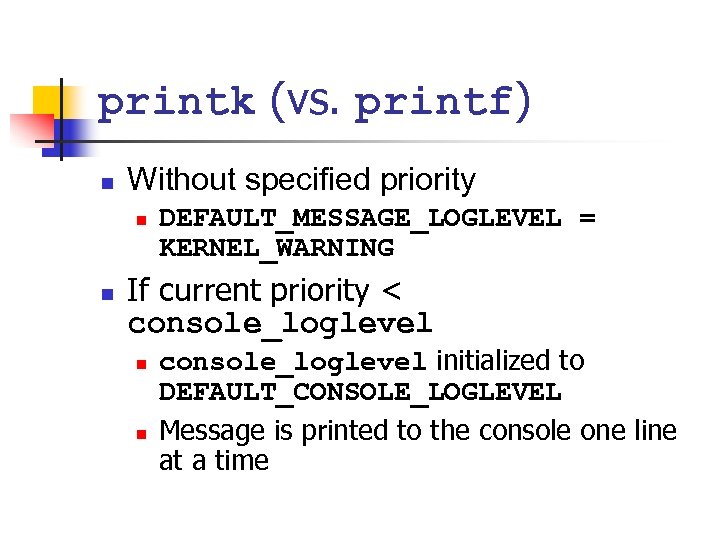
printk (vs. printf) n Without specified priority n n DEFAULT_MESSAGE_LOGLEVEL = KERNEL_WARNING If current priority < console_loglevel n n console_loglevel initialized to DEFAULT_CONSOLE_LOGLEVEL Message is printed to the console one line at a time
printk (vs. printf) n If both klogd and syslogd are running n n Messages are appended to /var/log/messages klog daemon doesn’t save consecutive identical lines, only the first line + the number of repetitions
printk (vs. printf) n console_loglevel can be modified using /proc/sys/kernel/printk n Contains 4 values n n n Current loglevel Default log level Minimum allowed loglevel Boot-timed default loglevel echo 6 > /proc/sys/kernel/printk
How Messages Get Logged n printk writes messages into a circular buffer that is __LOG_BUF_LEN bytes n n n Wakes any process that is waiting for messages If the buffer fills up, printk wraps around and overwrite the beginning of the buffer Can specify the –f <file> option to klogd to save messages to a specific file
How Messages Get Logged n n Reading from /proc/kmsg consumes data syslog system call can leave data for other processes (try dmesg command)
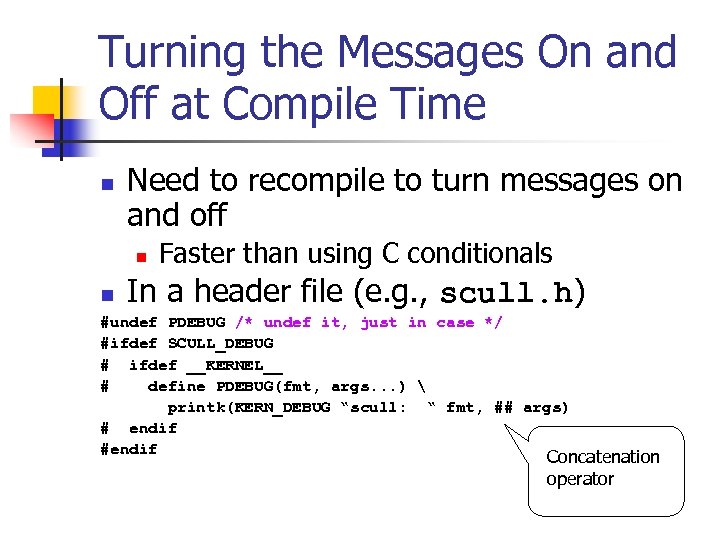
Turning the Messages On and Off at Compile Time n Need to recompile to turn messages on and off n n Faster than using C conditionals In a header file (e. g. , scull. h) #undef PDEBUG /* undef it, just in case */ #ifdef SCULL_DEBUG # ifdef __KERNEL__ # define PDEBUG(fmt, args. . . ) printk(KERN_DEBUG “scull: “ fmt, ## args) # endif #endif Concatenation operator
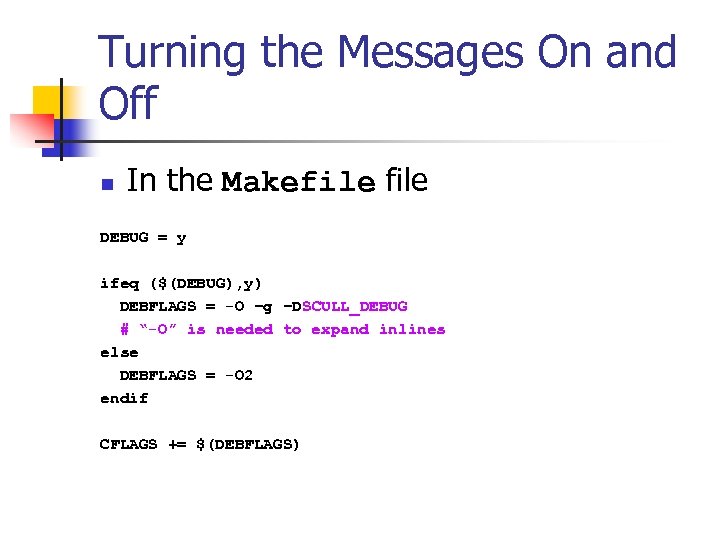
Turning the Messages On and Off n In the Makefile DEBUG = y ifeq ($(DEBUG), y) DEBFLAGS = -O –g –DSCULL_DEBUG # “-O” is needed to expand inlines else DEBFLAGS = -O 2 endif CFLAGS += $(DEBFLAGS)
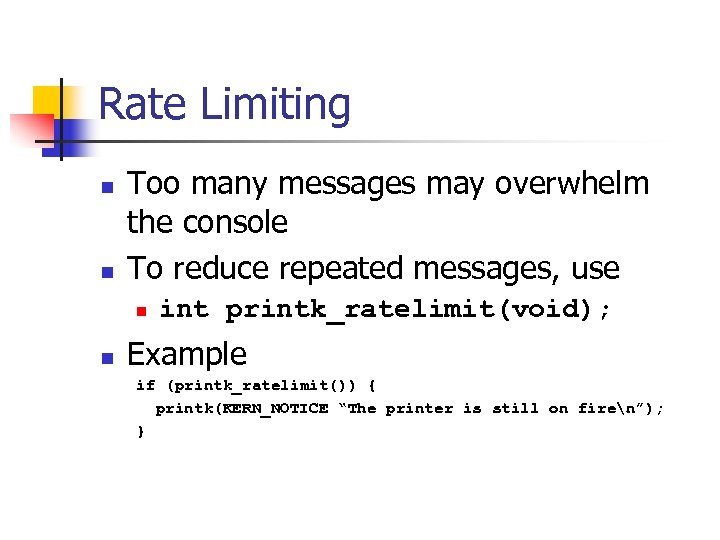
Rate Limiting n n Too many messages may overwhelm the console To reduce repeated messages, use n n int printk_ratelimit(void); Example if (printk_ratelimit()) { printk(KERN_NOTICE “The printer is still on firen”); }
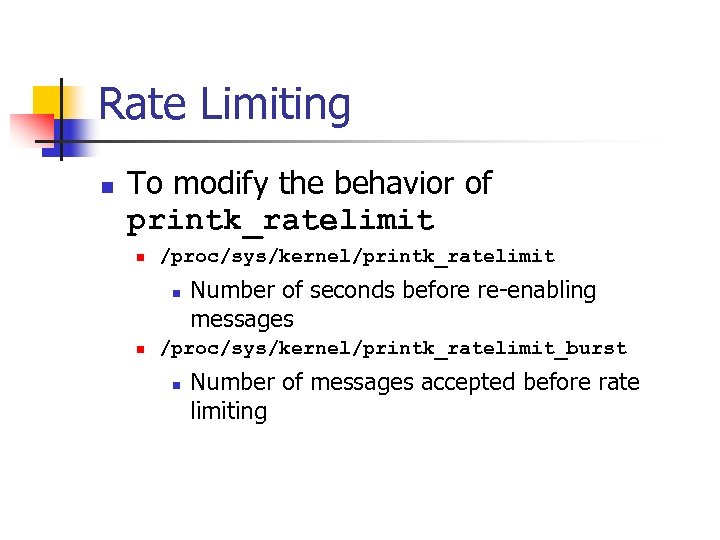
Rate Limiting n To modify the behavior of printk_ratelimit n /proc/sys/kernel/printk_ratelimit n n Number of seconds before re-enabling messages /proc/sys/kernel/printk_ratelimit_burst n Number of messages accepted before rate limiting
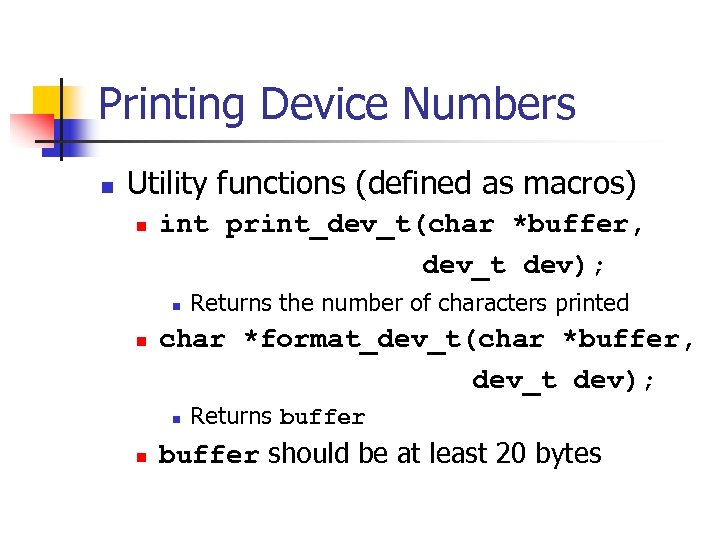
Printing Device Numbers n Utility functions (defined as macros) n int print_dev_t(char *buffer, dev_t dev); n n char *format_dev_t(char *buffer, dev_t dev); n n Returns the number of characters printed Returns buffer should be at least 20 bytes
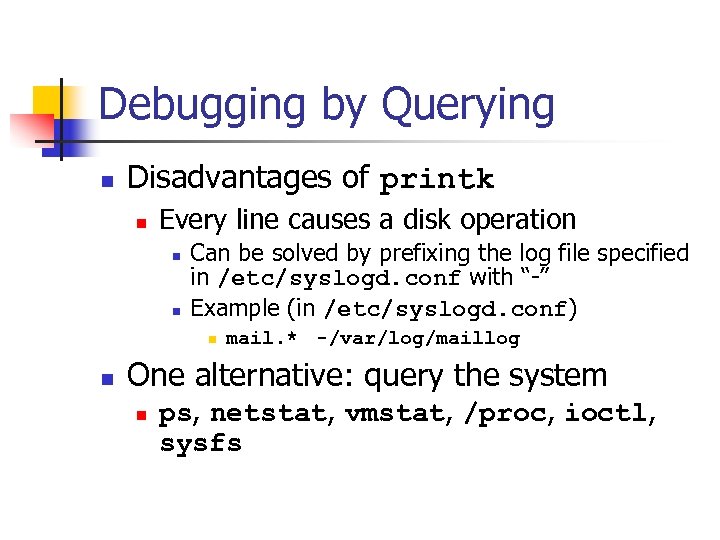
Debugging by Querying n Disadvantages of printk n Every line causes a disk operation n n Can be solved by prefixing the log file specified in /etc/syslogd. conf with “-” Example (in /etc/syslogd. conf) n n mail. * -/var/log/maillog One alternative: query the system n ps, netstat, vmstat, /proc, ioctl, sysfs
Using the /proc Filesystem n n Exports kernel information Each file under /proc tied to a kernel function
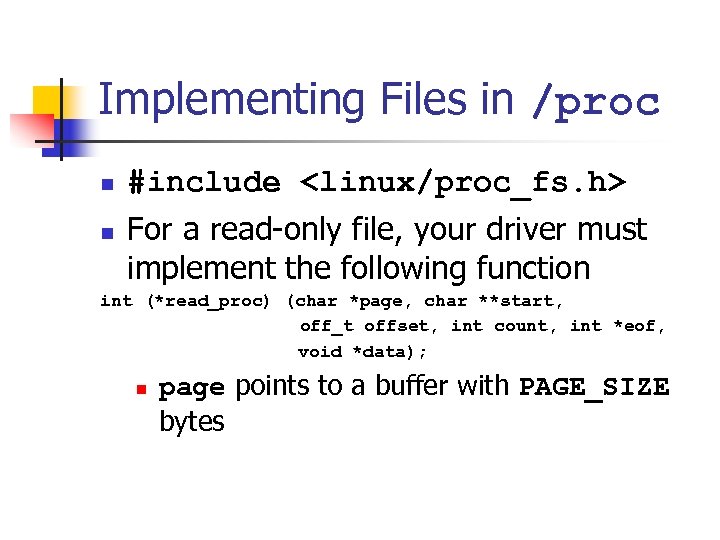
Implementing Files in /proc n n #include <linux/proc_fs. h> For a read-only file, your driver must implement the following function int (*read_proc) (char *page, char **start, off_t offset, int count, int *eof, void *data); n page points to a buffer with PAGE_SIZE bytes
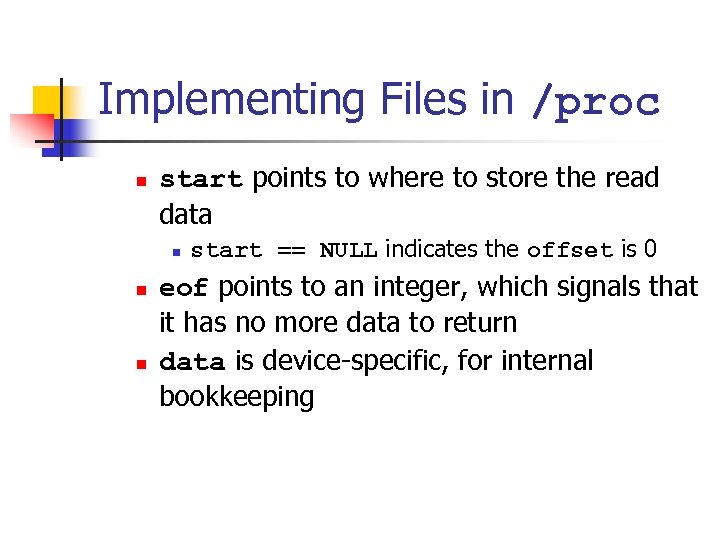
Implementing Files in /proc n start points to where to store the read data n n n start == NULL indicates the offset is 0 eof points to an integer, which signals that it has no more data to return data is device-specific, for internal bookkeeping
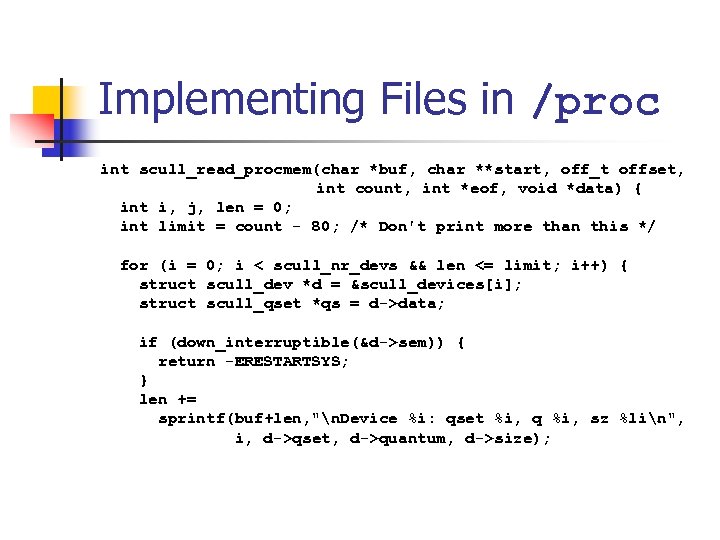
Implementing Files in /proc int scull_read_procmem(char *buf, char **start, off_t offset, int count, int *eof, void *data) { int i, j, len = 0; int limit = count - 80; /* Don't print more than this */ for (i = 0; i < scull_nr_devs && len <= limit; i++) { struct scull_dev *d = &scull_devices[i]; struct scull_qset *qs = d->data; if (down_interruptible(&d->sem)) { return -ERESTARTSYS; } len += sprintf(buf+len, "n. Device %i: qset %i, q %i, sz %lin", i, d->qset, d->quantum, d->size);
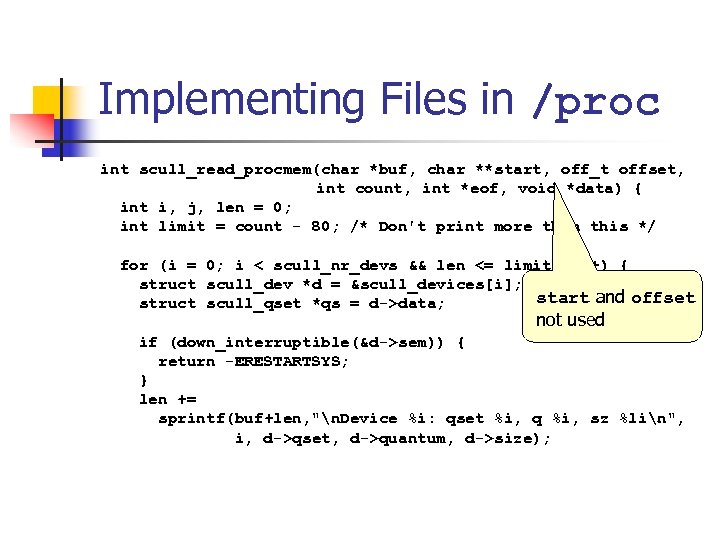
Implementing Files in /proc int scull_read_procmem(char *buf, char **start, off_t offset, int count, int *eof, void *data) { int i, j, len = 0; int limit = count - 80; /* Don't print more than this */ for (i = 0; i < scull_nr_devs && len <= limit; i++) { struct scull_dev *d = &scull_devices[i]; start and offset struct scull_qset *qs = d->data; not used if (down_interruptible(&d->sem)) { return -ERESTARTSYS; } len += sprintf(buf+len, "n. Device %i: qset %i, q %i, sz %lin", i, d->qset, d->quantum, d->size);
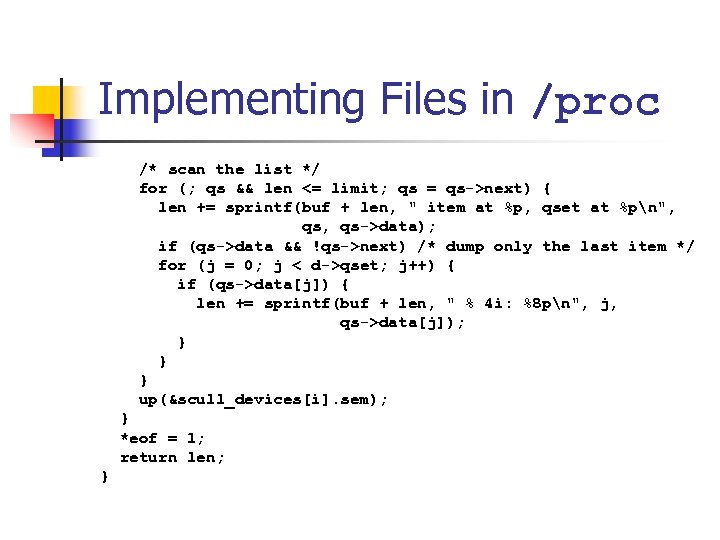
Implementing Files in /proc /* scan the list */ for (; qs && len <= limit; qs = qs->next) { len += sprintf(buf + len, " item at %p, qset at %pn", qs->data); if (qs->data && !qs->next) /* dump only the last item */ for (j = 0; j < d->qset; j++) { if (qs->data[j]) { len += sprintf(buf + len, " % 4 i: %8 pn", j, qs->data[j]); } } } up(&scull_devices[i]. sem); } *eof = 1; return len; }
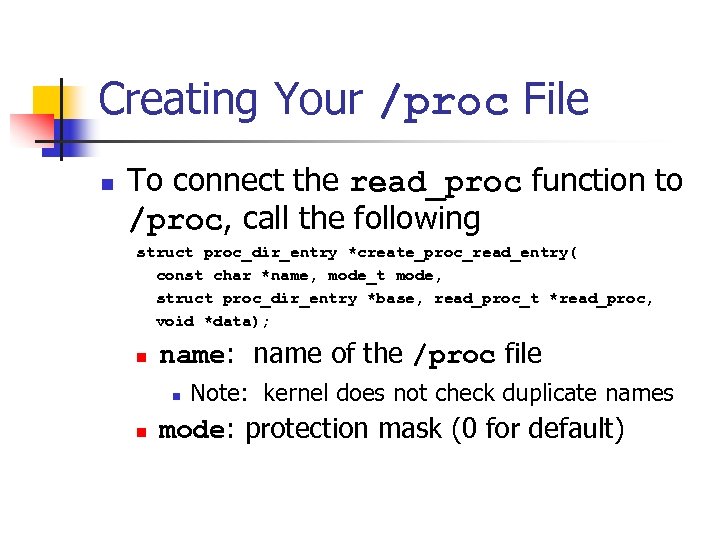
Creating Your /proc File n To connect the read_proc function to /proc, call the following struct proc_dir_entry *create_proc_read_entry( const char *name, mode_t mode, struct proc_dir_entry *base, read_proc_t *read_proc, void *data); n name: name of the /proc file n n Note: kernel does not check duplicate names mode: protection mask (0 for default)
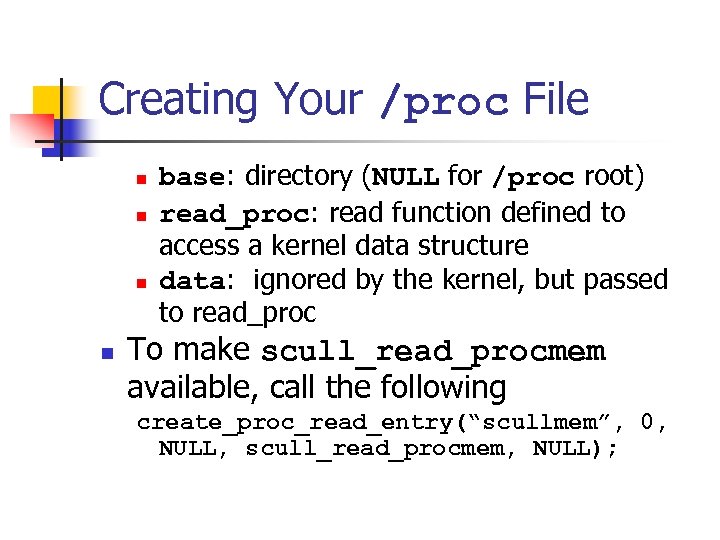
Creating Your /proc File n n base: directory (NULL for /proc root) read_proc: read function defined to access a kernel data structure data: ignored by the kernel, but passed to read_proc To make scull_read_procmem available, call the following create_proc_read_entry(“scullmem”, 0, NULL, scull_read_procmem, NULL);
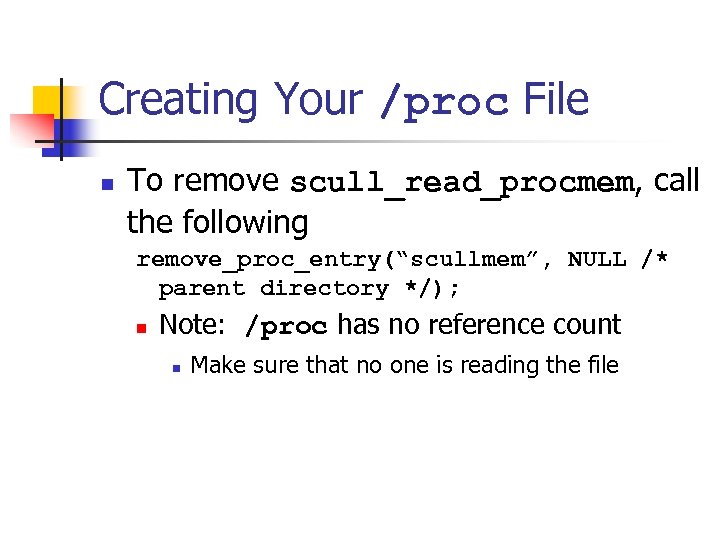
Creating Your /proc File n To remove scull_read_procmem, call the following remove_proc_entry(“scullmem”, NULL /* parent directory */); n Note: /proc has no reference count n Make sure that no one is reading the file
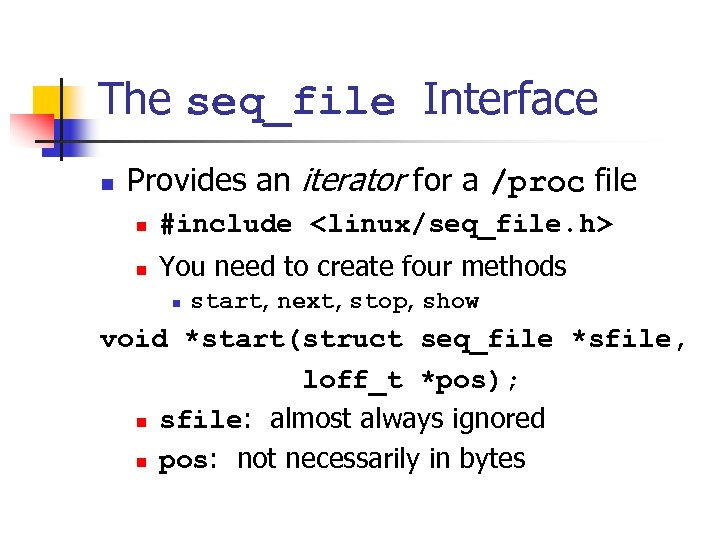
The seq_file Interface n Provides an iterator for a /proc file n #include <linux/seq_file. h> n You need to create four methods n start, next, stop, show void *start(struct seq_file *sfile, loff_t *pos); n sfile: almost always ignored n pos: not necessarily in bytes
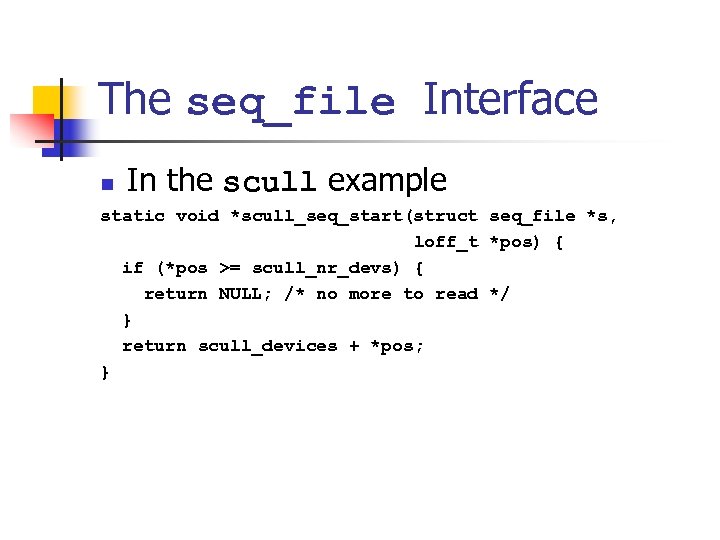
The seq_file Interface n In the scull example static void *scull_seq_start(struct seq_file *s, loff_t *pos) { if (*pos >= scull_nr_devs) { return NULL; /* no more to read */ } return scull_devices + *pos; }
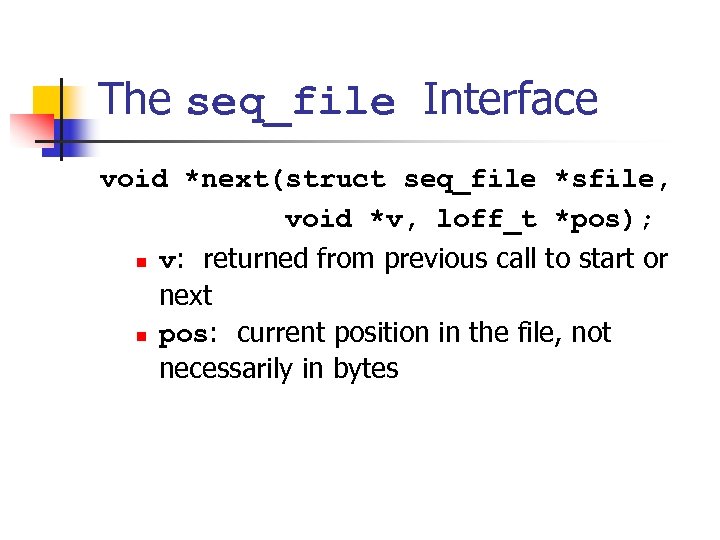
The seq_file Interface void *next(struct seq_file *sfile, void *v, loff_t *pos); n v: returned from previous call to start or next n pos: current position in the file, not necessarily in bytes
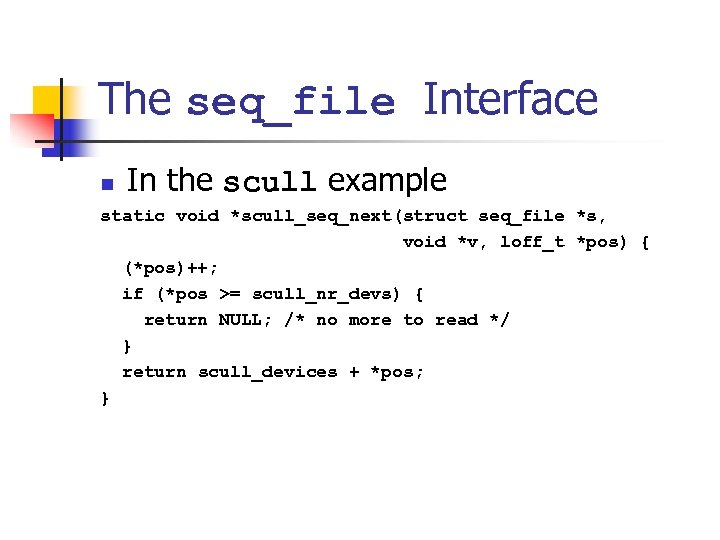
The seq_file Interface n In the scull example static void *scull_seq_next(struct seq_file *s, void *v, loff_t *pos) { (*pos)++; if (*pos >= scull_nr_devs) { return NULL; /* no more to read */ } return scull_devices + *pos; }
The seq_file Interface void *stop(struct seq_file *sfile, void *v); n n Cleans up An empty function for the scull example
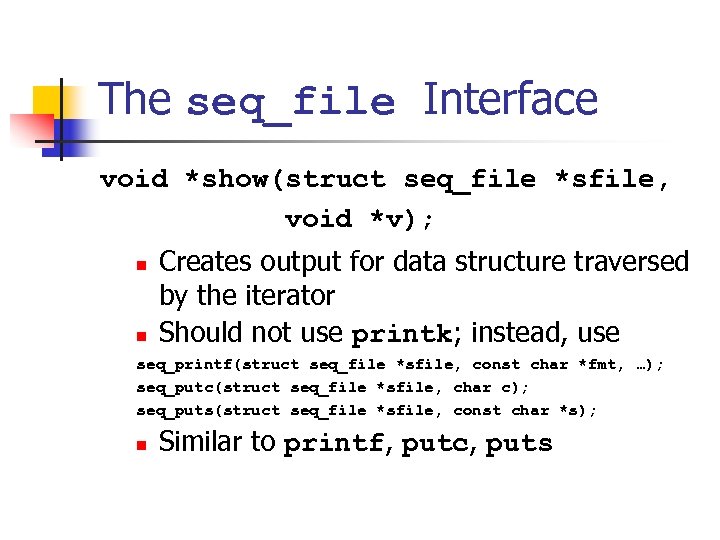
The seq_file Interface void *show(struct seq_file *sfile, void *v); n n Creates output for data structure traversed by the iterator Should not use printk; instead, use seq_printf(struct seq_file *sfile, const char *fmt, …); seq_putc(struct seq_file *sfile, char c); seq_puts(struct seq_file *sfile, const char *s); n Similar to printf, putc, puts
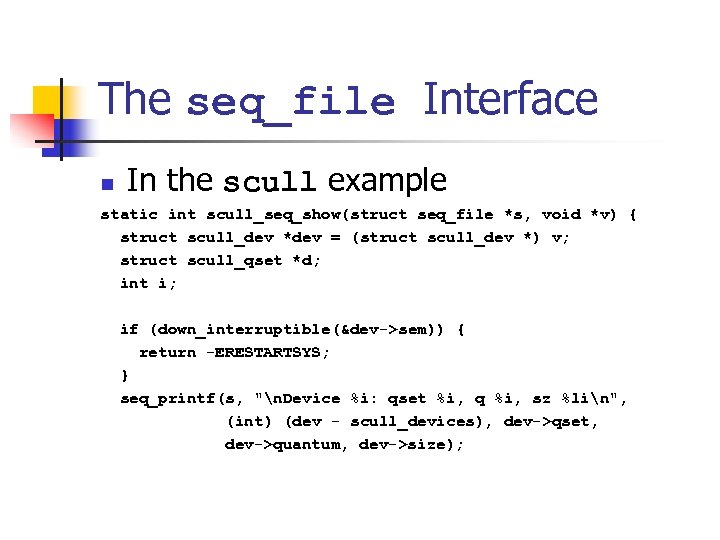
The seq_file Interface n In the scull example static int scull_seq_show(struct seq_file *s, void *v) { struct scull_dev *dev = (struct scull_dev *) v; struct scull_qset *d; int i; if (down_interruptible(&dev->sem)) { return -ERESTARTSYS; } seq_printf(s, "n. Device %i: qset %i, q %i, sz %lin", (int) (dev - scull_devices), dev->qset, dev->quantum, dev->size);
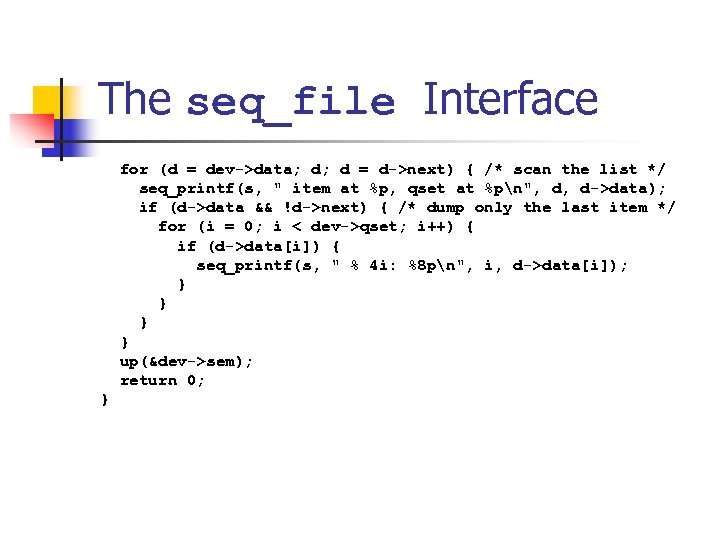
The seq_file Interface for (d = dev->data; d; d = d->next) { /* scan the list */ seq_printf(s, " item at %p, qset at %pn", d, d->data); if (d->data && !d->next) { /* dump only the last item */ for (i = 0; i < dev->qset; i++) { if (d->data[i]) { seq_printf(s, " % 4 i: %8 pn", i, d->data[i]); } } up(&dev->sem); return 0; }
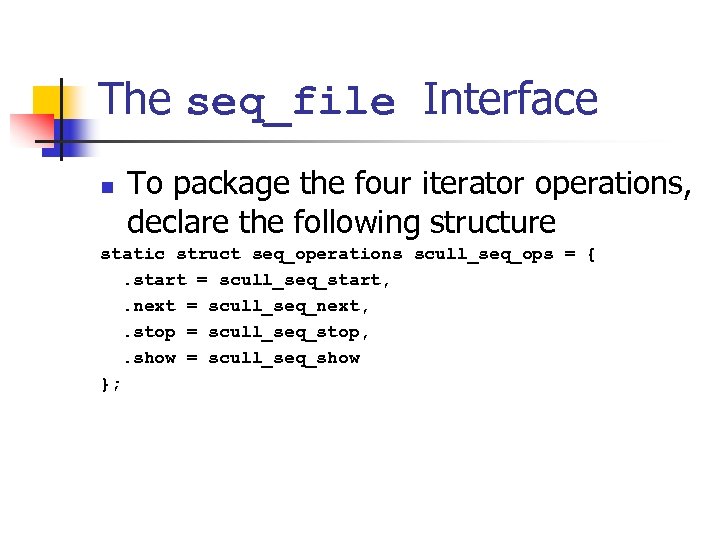
The seq_file Interface n To package the four iterator operations, declare the following structure static struct seq_operations scull_seq_ops = {. start = scull_seq_start, . next = scull_seq_next, . stop = scull_seq_stop, . show = scull_seq_show };
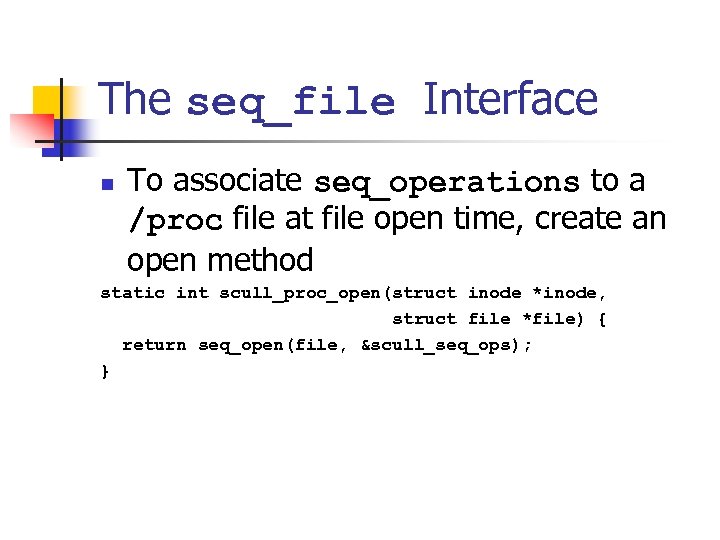
The seq_file Interface n To associate seq_operations to a /proc file at file open time, create an open method static int scull_proc_open(struct inode *inode, struct file *file) { return seq_open(file, &scull_seq_ops); }
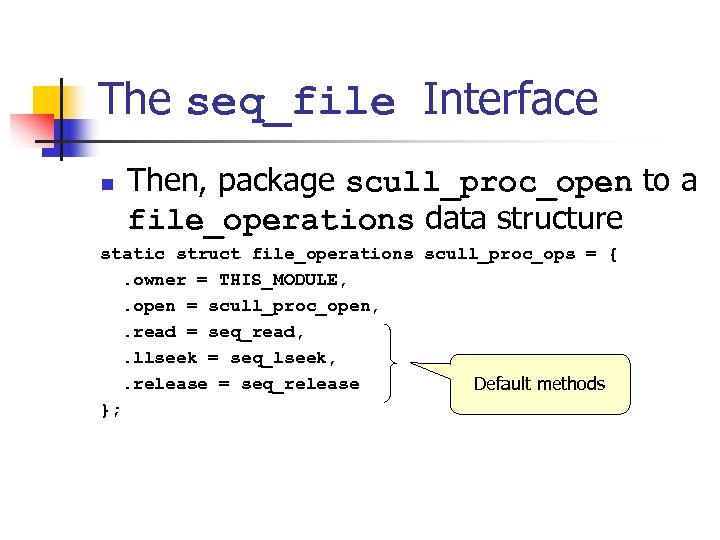
The seq_file Interface n Then, package scull_proc_open to a file_operations data structure static struct file_operations scull_proc_ops = {. owner = THIS_MODULE, . open = scull_proc_open, . read = seq_read, . llseek = seq_lseek, . release = seq_release Default methods };
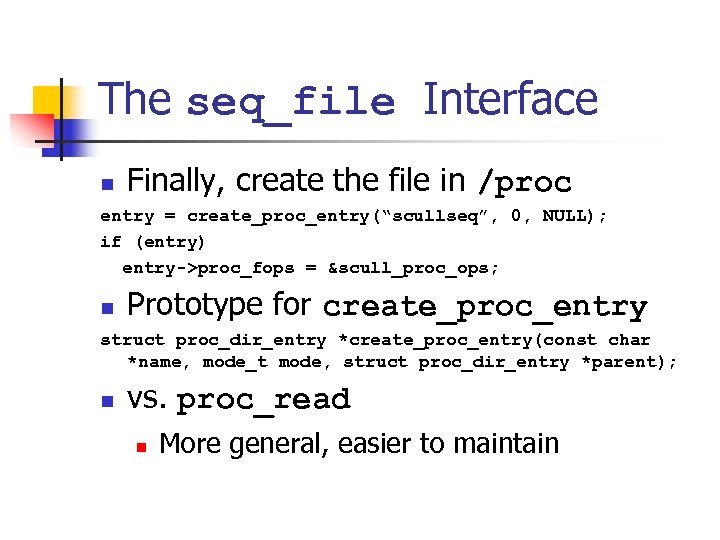
The seq_file Interface n Finally, create the file in /proc entry = create_proc_entry(“scullseq”, 0, NULL); if (entry) entry->proc_fops = &scull_proc_ops; n Prototype for create_proc_entry struct proc_dir_entry *create_proc_entry(const char *name, mode_t mode, struct proc_dir_entry *parent); n vs. proc_read n More general, easier to maintain
The ioctl Method n Implement additional commands to return debugging information n Advantages n n n More efficient Does not need to split data into pages Can be left in the driver unnoticed
The ioctl Method n Implement additional commands to return debugging information n Disadvantages n n Needs to implement a user-level debugging program that is in sync with the kernel module Slightly bigger module
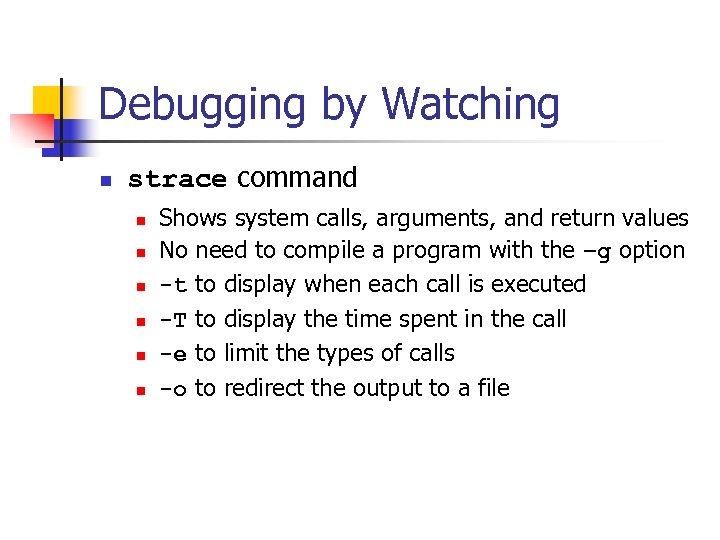
Debugging by Watching n strace command n n n Shows system calls, arguments, and return values No need to compile a program with the –g option -t to display when each call is executed -T to display the time spent in the call -e to limit the types of calls -o to redirect the output to a file
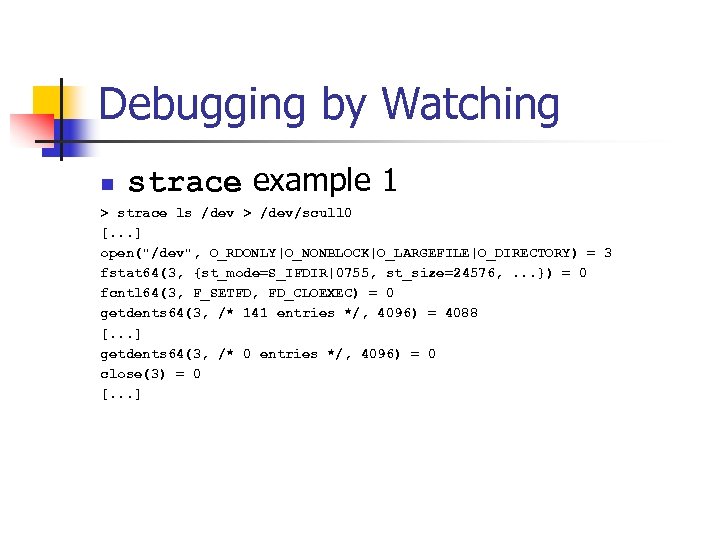
Debugging by Watching n strace example 1 > strace ls /dev > /dev/scull 0 [. . . ] open("/dev", O_RDONLY|O_NONBLOCK|O_LARGEFILE|O_DIRECTORY) = 3 fstat 64(3, {st_mode=S_IFDIR|0755, st_size=24576, . . . }) = 0 fcntl 64(3, F_SETFD, FD_CLOEXEC) = 0 getdents 64(3, /* 141 entries */, 4096) = 4088 [. . . ] getdents 64(3, /* 0 entries */, 4096) = 0 close(3) = 0 [. . . ]
![Debugging by Watching n strace example 1 [. . . ] fstat 64(1, {st_mode=S_IFCHR|0664, Debugging by Watching n strace example 1 [. . . ] fstat 64(1, {st_mode=S_IFCHR|0664,](https://present5.com/presentation/aec8c17ad9e28048fe17756469178b39/image-50.jpg)
Debugging by Watching n strace example 1 [. . . ] fstat 64(1, {st_mode=S_IFCHR|0664, st_rdev=makedev(254, 0), . . . }) = 0 write(1, "MAKEDEVnadmmidi 0nadmmidi 1nadmmid". . . , 4096) = 4000 write(1, "bnptywcnptywdnptywenptywfnptyx 0n". . . , 96) = 96 write(1, "bnptyxcnptyxdnptyxenptyxfnptyy 0n". . . , 4096) = 3904 write(1, "s 17nvcs 18nvcs 19nvcs 20nvcs 21". . . , 192) = 192 write(1, "nvcs 47nvcs 48nvcs 49nvcs 50nvc". . . , 673) = 673 close(1) = 0 exit_group(0) = ? The size of a scull quantum is 4, 000 bytes
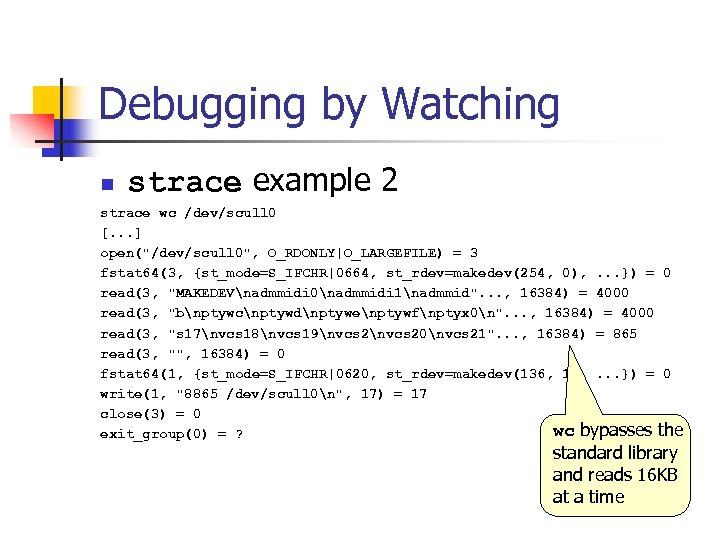
Debugging by Watching n strace example 2 strace wc /dev/scull 0 [. . . ] open("/dev/scull 0", O_RDONLY|O_LARGEFILE) = 3 fstat 64(3, {st_mode=S_IFCHR|0664, st_rdev=makedev(254, 0), . . . }) = 0 read(3, "MAKEDEVnadmmidi 0nadmmidi 1nadmmid". . . , 16384) = 4000 read(3, "bnptywcnptywdnptywenptywfnptyx 0n". . . , 16384) = 4000 read(3, "s 17nvcs 18nvcs 19nvcs 20nvcs 21". . . , 16384) = 865 read(3, "", 16384) = 0 fstat 64(1, {st_mode=S_IFCHR|0620, st_rdev=makedev(136, 1), . . . }) = 0 write(1, "8865 /dev/scull 0n", 17) = 17 close(3) = 0 wc bypasses the exit_group(0) = ? standard library and reads 16 KB at a time
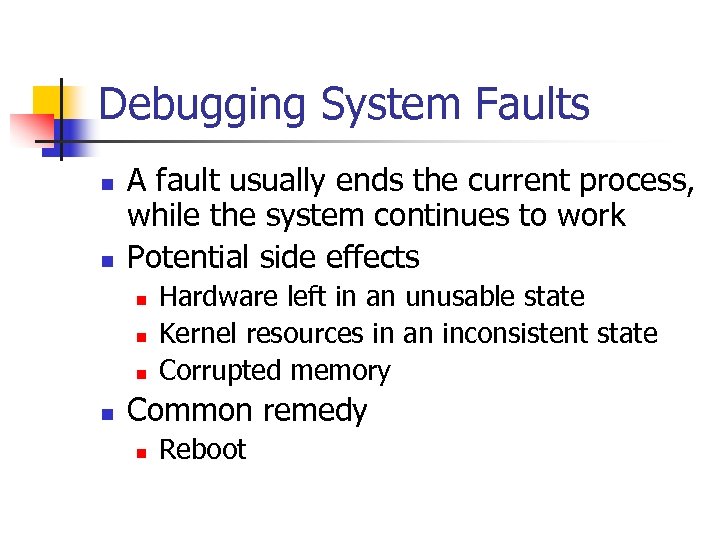
Debugging System Faults n n A fault usually ends the current process, while the system continues to work Potential side effects n n Hardware left in an unusable state Kernel resources in an inconsistent state Corrupted memory Common remedy n Reboot
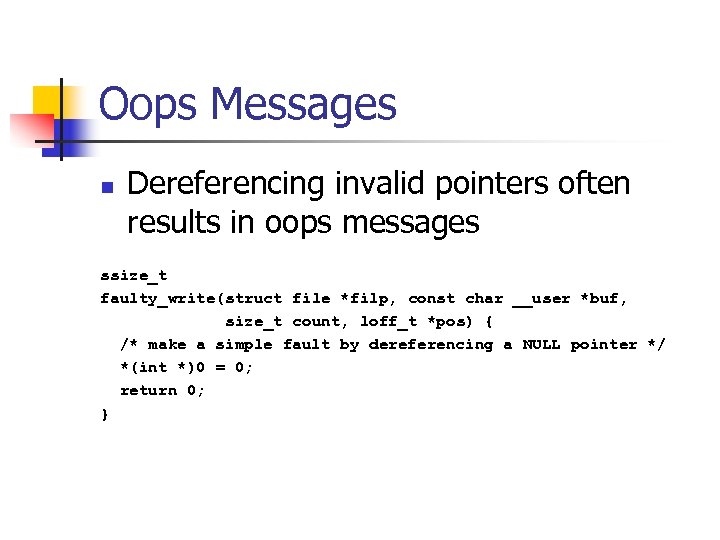
Oops Messages n Dereferencing invalid pointers often results in oops messages ssize_t faulty_write(struct file *filp, const char __user *buf, size_t count, loff_t *pos) { /* make a simple fault by dereferencing a NULL pointer */ *(int *)0 = 0; return 0; }
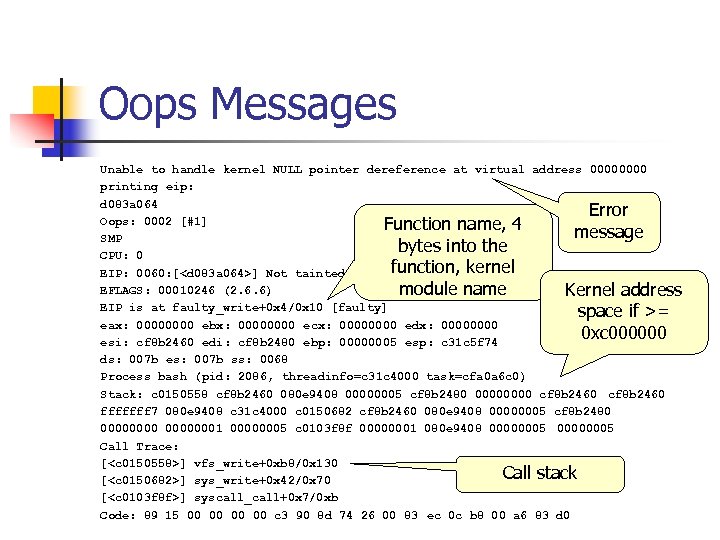
Oops Messages Unable to handle kernel NULL pointer dereference at virtual address 0000 printing eip: d 083 a 064 Error Oops: 0002 [#1] Function name, 4 message SMP bytes into the CPU: 0 function, kernel EIP: 0060: [<d 083 a 064>] Not tainted EFLAGS: 00010246 (2. 6. 6) module name Kernel address EIP is at faulty_write+0 x 4/0 x 10 [faulty] space if >= eax: 0000 ebx: 0000 ecx: 0000 edx: 0000 0 xc 000000 esi: cf 8 b 2460 edi: cf 8 b 2480 ebp: 00000005 esp: c 31 c 5 f 74 ds: 007 b es: 007 b ss: 0068 Process bash (pid: 2086, threadinfo=c 31 c 4000 task=cfa 0 a 6 c 0) Stack: c 0150558 cf 8 b 2460 080 e 9408 00000005 cf 8 b 2480 0000 cf 8 b 2460 fffffff 7 080 e 9408 c 31 c 4000 c 0150682 cf 8 b 2460 080 e 9408 00000005 cf 8 b 2480 00000001 00000005 c 0103 f 8 f 00000001 080 e 9408 00000005 Call Trace: [<c 0150558>] vfs_write+0 xb 8/0 x 130 Call stack [<c 0150682>] sys_write+0 x 42/0 x 70 [<c 0103 f 8 f>] syscall_call+0 x 7/0 xb Code: 89 15 00 00 c 3 90 8 d 74 26 00 83 ec 0 c b 8 00 a 6 83 d 0
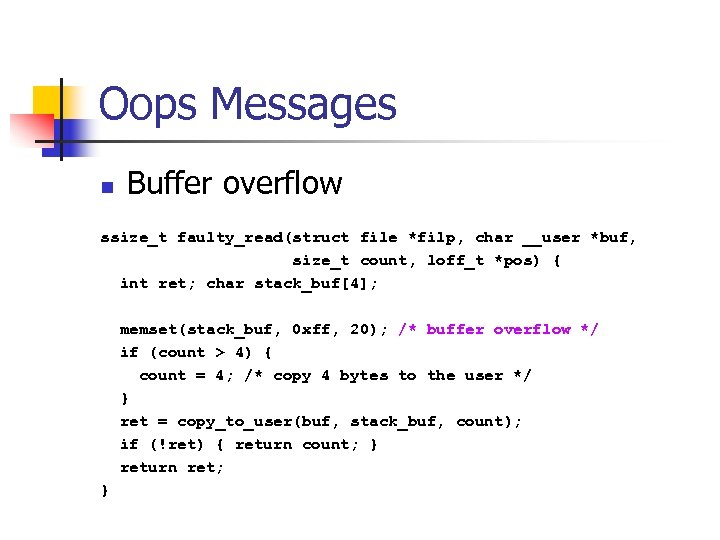
Oops Messages n Buffer overflow ssize_t faulty_read(struct file *filp, char __user *buf, size_t count, loff_t *pos) { int ret; char stack_buf[4]; memset(stack_buf, 0 xff, 20); /* buffer overflow */ if (count > 4) { count = 4; /* copy 4 bytes to the user */ } ret = copy_to_user(buf, stack_buf, count); if (!ret) { return count; } return ret; }
![Oops Messages Bad EIP: 0010: [<0000>] Unable to handle kernel paging request at virtual Oops Messages Bad EIP: 0010: [<0000>] Unable to handle kernel paging request at virtual](https://present5.com/presentation/aec8c17ad9e28048fe17756469178b39/image-56.jpg)
Oops Messages Bad EIP: 0010: [<0000>] Unable to handle kernel paging request at virtual address ffff printing eip: ffff Error Oops: 0000 [#5] message SMP 0 xffff CPU: 0 points to nowhere EIP: 0060: [<ffff>] Not tainted EFLAGS: 00010296 (2. 6. 6) EIP is at 0 xffff User-space eax: 0000000 c ebx: ffff ecx: 0000 edx: bfffda 7 c address space if esi: cf 434 f 00 edi: ffff ebp: 00002000 esp: c 27 fff 78 0 xc 000000 ds: 007 b es: 007 b ss: 0068 Process head (pid: 2331, threadinfo=c 27 fe 000 task=c 3226150) Stack: ffff bfffda 70 00002000 cf 434 f 20 00000001 00000286 cf 434 f 00 fffffff 7 bfffda 70 c 27 fe 000 c 0150612 cf 434 f 00 bfffda 70 00002000 cf 434 f 20 00000003 00002000 c 0103 f 8 f 00000003 bfffda 70 00002000 bfffda 70 Call Trace: [<c 0150612>] sys_read+0 x 42/0 x 70 Call stack [<c 0103 f 8 f>] syscall_call+0 x 7/0 xb Code: address Bad EIP value. <
Oops Messages n n Require CONFIG_KALLSYMS option turned on to see meaningful messages Other tricks n 0 xa 5 a 5 on stack memory not initialized
System Hangs n If Ctrl-Alt-Del does not work n Two choices n n Prevent hangs Debug after the fact
System Hangs n Insert schedule() calls at strategic points n n Hand the CPU back to the scheduler Do not call if your driver holds a spinlock
System Hangs n Keyboard lockups, but other things are still working n Use the “magic Sys. Rq key” n To enable magic Sys. Rq n n n Compile kernel with CONFIG_MAGIC_SYSRQ on echo 1 > /proc/sys/kernel/sysrq To trigger magic Sys. Rq n n Alt-Sys. Rq-<command> echo <command> > /proc/sysrqtrigger
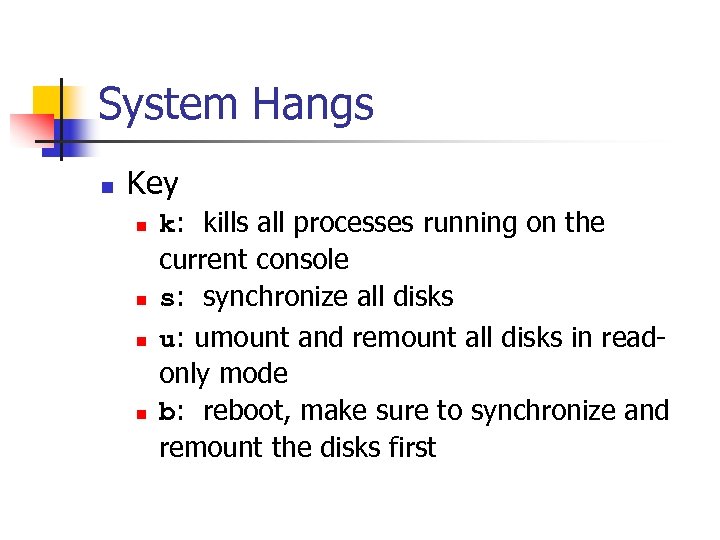
System Hangs n Key n n k: kills all processes running on the current console s: synchronize all disks u: umount and remount all disks in readonly mode b: reboot, make sure to synchronize and remount the disks first
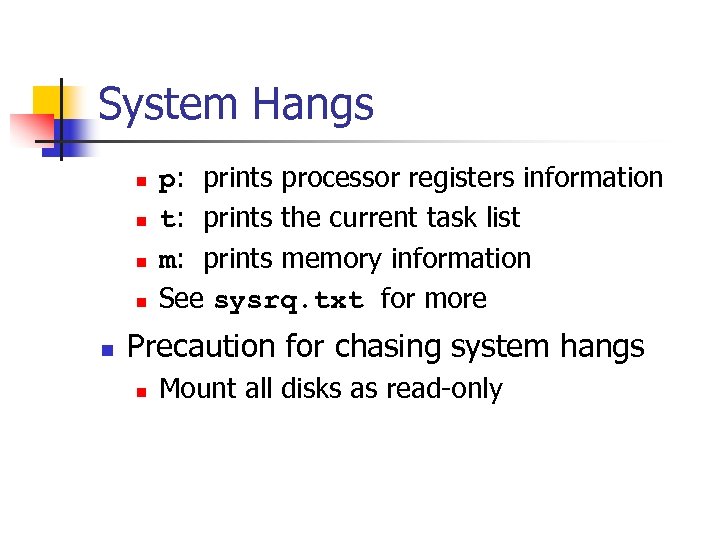
System Hangs n n n p: prints processor registers information t: prints the current task list m: prints memory information See sysrq. txt for more Precaution for chasing system hangs n Mount all disks as read-only
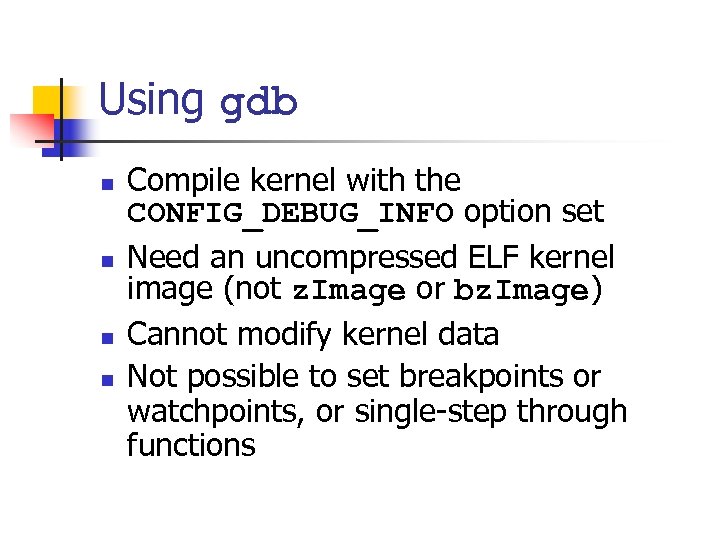
Using gdb n n Compile kernel with the CONFIG_DEBUG_INFO option set Need an uncompressed ELF kernel image (not z. Image or bz. Image) Cannot modify kernel data Not possible to set breakpoints or watchpoints, or single-step through functions
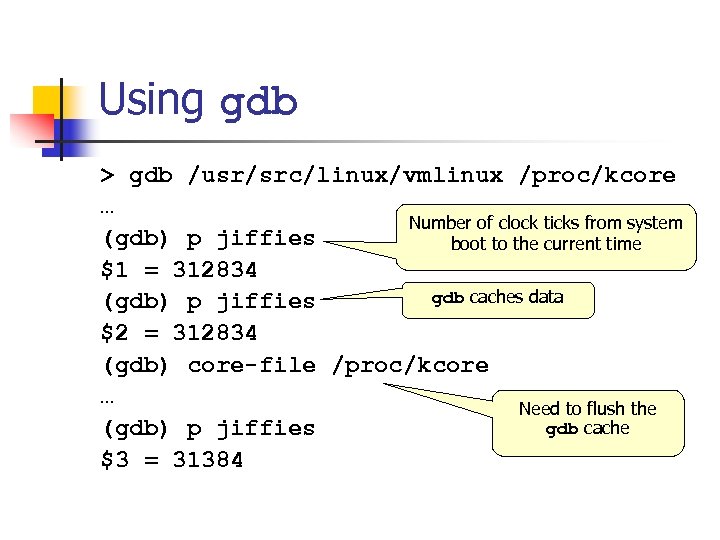
Using gdb > gdb /usr/src/linux/vmlinux /proc/kcore … Number of clock ticks from system (gdb) p jiffies boot to the current time $1 = 312834 gdb caches data (gdb) p jiffies $2 = 312834 (gdb) core-file /proc/kcore … Need to flush the gdb cache (gdb) p jiffies $3 = 31384
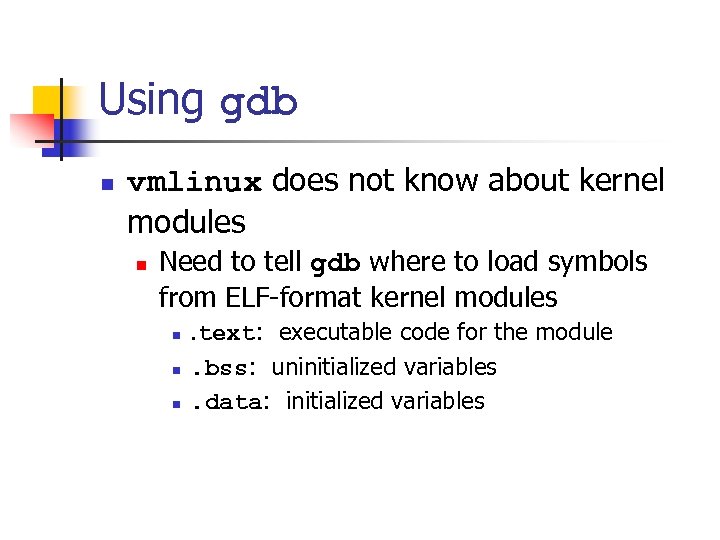
Using gdb n vmlinux does not know about kernel modules n Need to tell gdb where to load symbols from ELF-format kernel modules n n n . text: executable code for the module. bss: uninitialized variables. data: initialized variables
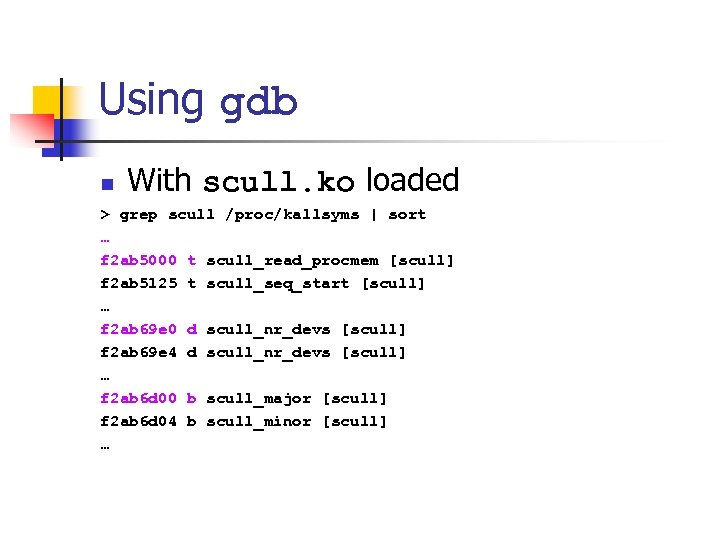
Using gdb n With scull. ko loaded > grep scull /proc/kallsyms | sort … f 2 ab 5000 t scull_read_procmem [scull] f 2 ab 5125 t scull_seq_start [scull] … f 2 ab 69 e 0 d scull_nr_devs [scull] f 2 ab 69 e 4 d scull_nr_devs [scull] … f 2 ab 6 d 00 b scull_major [scull] f 2 ab 6 d 04 b scull_minor [scull] …
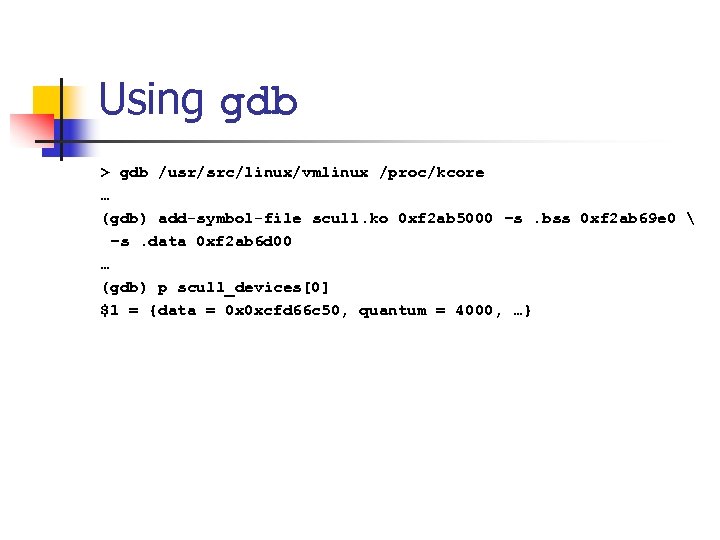
Using gdb > gdb /usr/src/linux/vmlinux /proc/kcore … (gdb) add-symbol-file scull. ko 0 xf 2 ab 5000 –s. bss 0 xf 2 ab 69 e 0 –s. data 0 xf 2 ab 6 d 00 … (gdb) p scull_devices[0] $1 = {data = 0 x 0 xcfd 66 c 50, quantum = 4000, …}
The kdb Kernel Debugger n An interactive debugger n n n Can set breakpoints Can modify data as well Download two patches from oss. sgi. com (with matching kernel version) n Obsolete
The kgdb Patches n n n Separate the machine running the test kernel from the machine running the debugger Connected via a serial cable See Documentation/i 386/kgdb
The User-Mode Linux Port n Advantages n n Allows the Linux kernel to run as a separate user-level process Limits the damage to the real system Use regular gdb Disadvantages n Has no access to hardware
The Linux Trace Toolkit n Can trace various events in the kernel n n Can track down performance problems http: //www. opersys. com/LTT
Dynamic Probes (DProbes) n n Can be inserted anywhere within a running system without kernel builds or reboots http: //oss. software. ibm. com
aec8c17ad9e28048fe17756469178b39.ppt